. 2022 Jul 7;29(7):1067-1082.e18.
doi: 10.1016/j.stem.2022.05.007. Epub 2022 Jun 20.

Lymphatics act as a signaling hub to regulate intestinal stem cell activity

Affiliations

Lymphatics act as a signaling hub to regulate intestinal stem cell activity

Rachel E Niec et al. Cell Stem Cell. .

Abstract

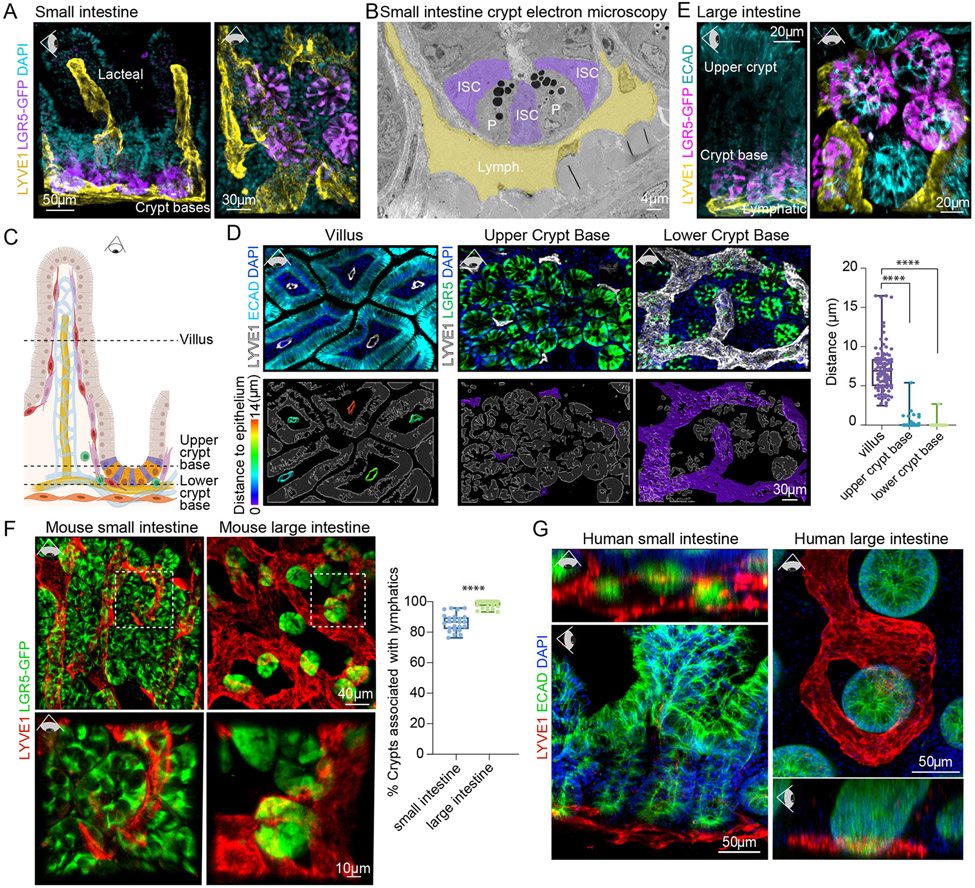
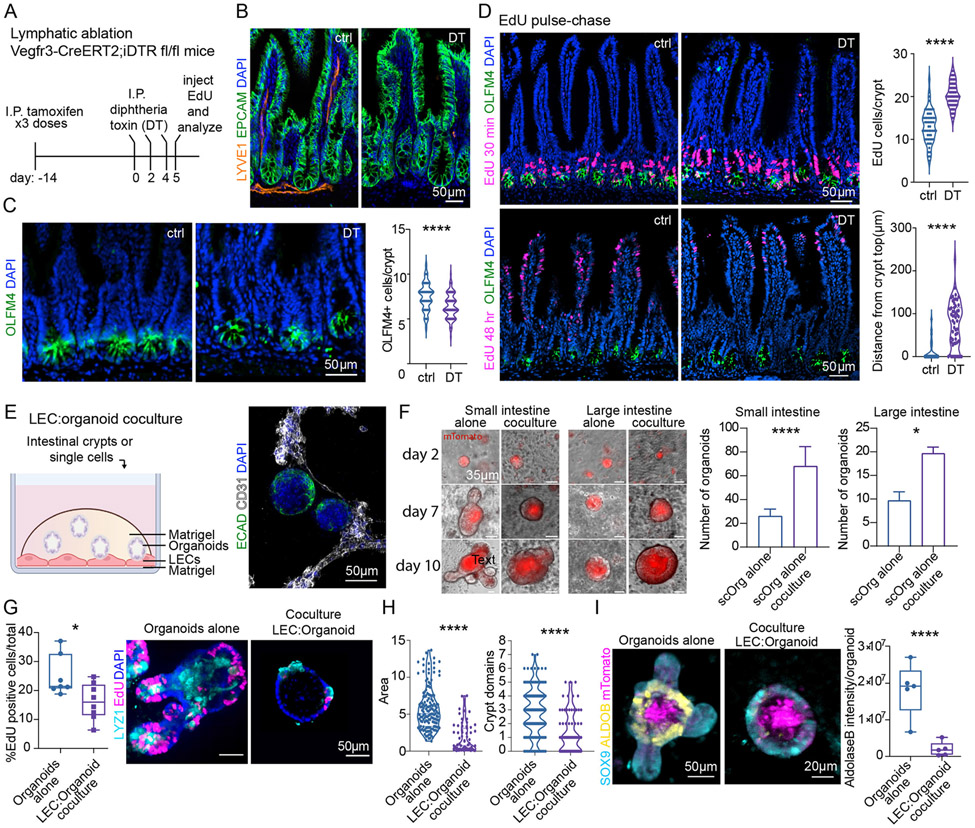
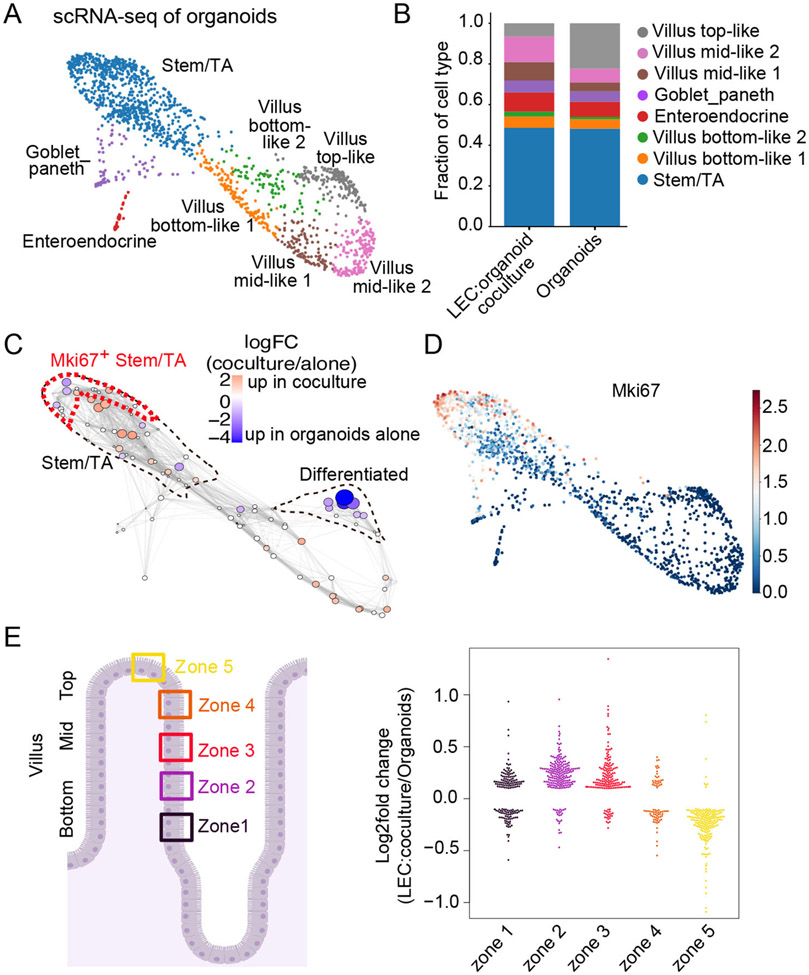
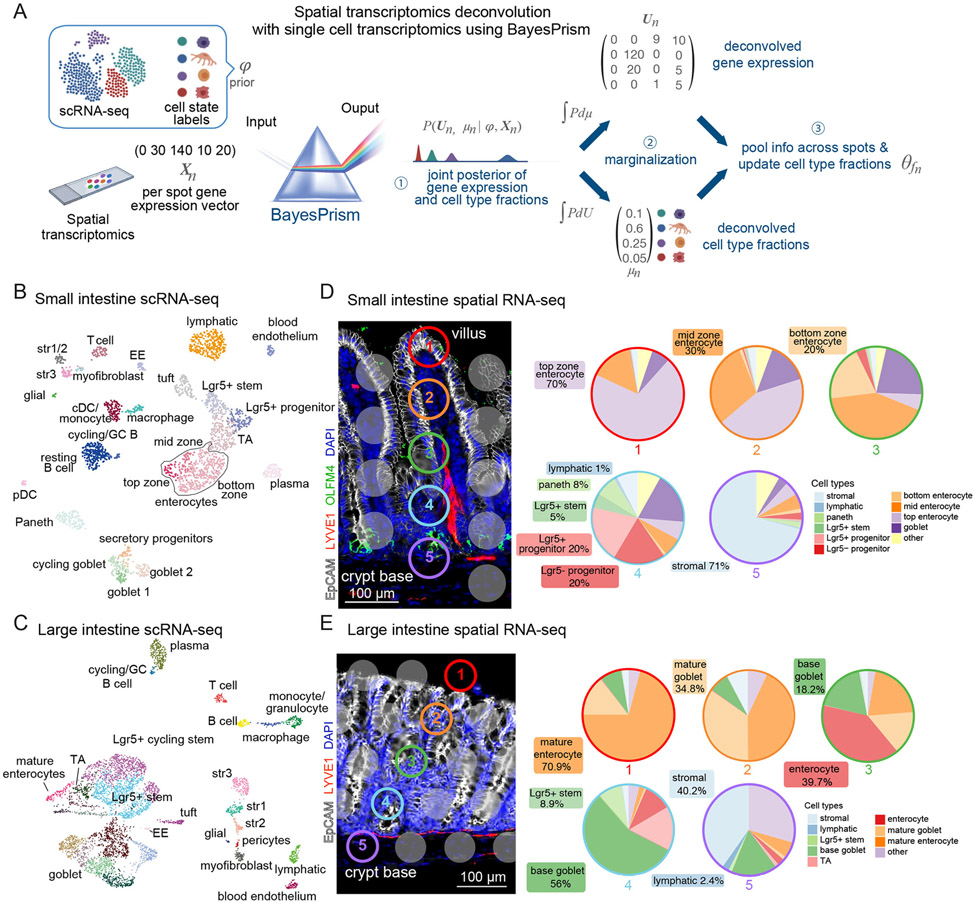
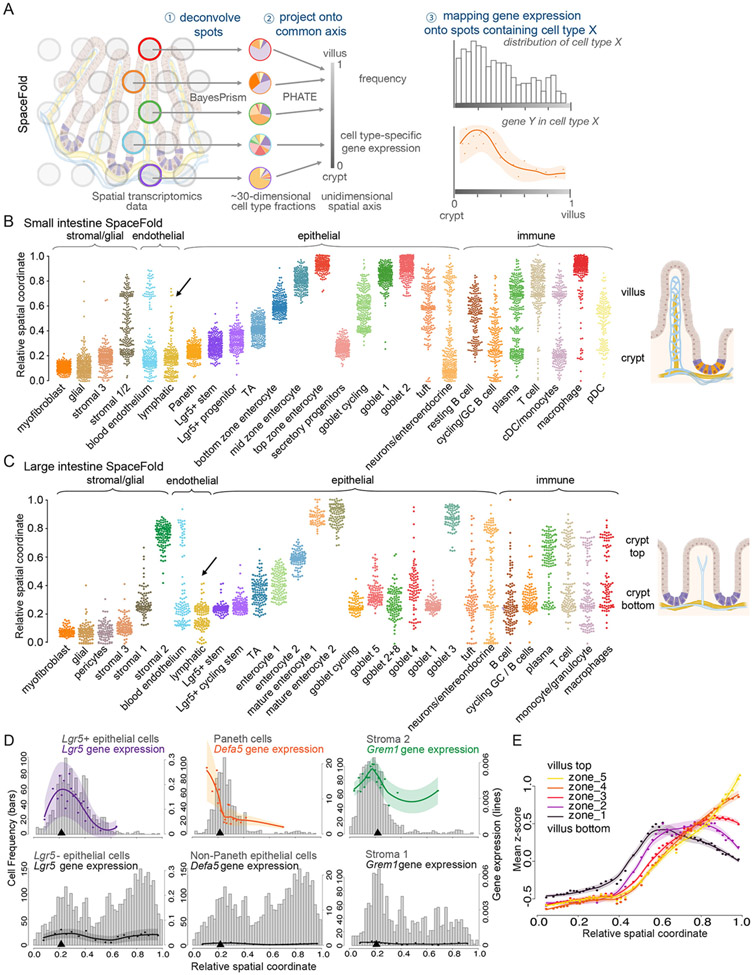
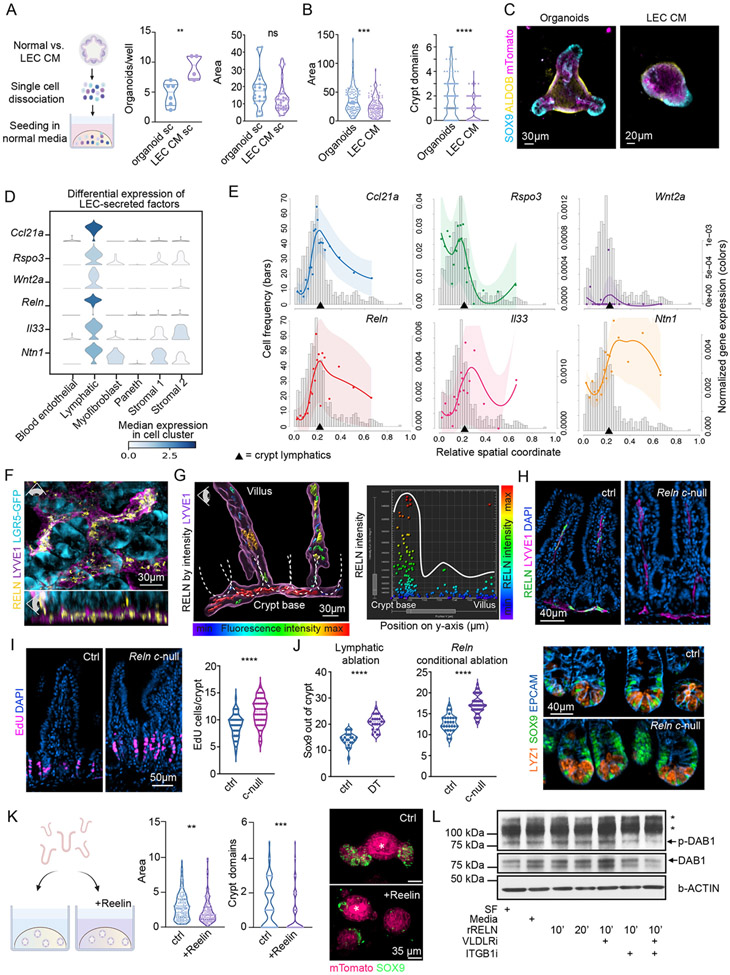
Barrier epithelia depend upon resident stem cells for homeostasis, defense, and repair. Epithelial stem cells of small and large intestines (ISCs) respond to their local microenvironments (niches) to fulfill a continuous demand for tissue turnover. The complexity of these niches and underlying communication pathways are not fully known. Here, we report a lymphatic network at the intestinal crypt base that intimately associates with ISCs. Employing in vivo loss of function and lymphatic:organoid cocultures, we show that crypt lymphatics maintain ISCs and inhibit their precocious differentiation. Pairing single-cell and spatial transcriptomics, we apply BayesPrism to deconvolve expression within spatial features and develop SpaceFold to robustly map the niche at high resolution, exposing lymphatics as a central signaling hub for the crypt in general and ISCs in particular. We identify WNT-signaling factors (WNT2, R-SPONDIN-3) and a hitherto unappreciated extracellular matrix protein, REELIN, as crypt lymphatic signals that directly govern the regenerative potential of ISCs.

Keywords: REELIN; RSPO3; WNTs; intestinal stem cells; lymphatic:stem cell interactome; lymphatics; organoids; spatial deconvolution; spatial transcriptomics of murine large and small intestine; stem cell niches.


Conflict of interest statement

Declaration of interests D.P. is on the scientific advisory board of Insitro. B.J.M. is an advisor to and recipient of an investigator-initiated research award from PureTech Corp. and recipient of an investigator-initiated research award from Regeneron. E.F. served on the scientific advisory boards of Arsenal Biosciences and L’Oreal.

Figures

Figure 1.
Figure 1.. Lymphatic capillaries nest crypt-based intestinal stem cells.
(A) 3D IMF of SI crypts and villi, revealing LYVE1+ lymphatic capillaries (yellow) nesting LGR5+ crypt-based ISCs (purple). Representative of n > 5 mice. Eye icon indicates plane of view of visualization; horizontal eye = side view, downward facing eye = top view with tissue lying flat. (B) Pseudo-colored ultrastructural images of SI crypt base with lymphatic capillaries (yellow, Lymph.), Paneth cells (P), and ISC (purple, ISCs). (C) Schematic of SI crypt niche, showing ISCs (purple) intermingled with Paneth cells (orange) and the lymphatic vasculature (yellow) (legend in Figure S1A). (D) Top: 3D IMF images of 5 μm z-stacks of the mouse SI lymphatic vasculature (LYVE1+) and differentiated epithelial (ECAD+, aqua) cells or ISCs (LGR5+, green) taken from z planes as illustrated in the schematic (dotted lines) in C. Bottom:Lymphatic vasculature is color-coded according to the distance [μm] to the nearest epithelial/ISC (white outlines). Quantification of the distance between lymphatic surfaces and the epithelium (n = 9 mice with ≥ 3 images/region/mouse) was done using nearest-distance-to-surface analysis in Imaris (Bitplane) and is summarized in the box-plot on the right. **** indicates a p-value of <0.0001 (One-way analysis of variance (ANOVA), Tukey’s multiple comparisons) (E) 3D IMF of LI crypts revealing LYVE1+ lymphatics (yellow) nesting LGR5+ ISCs (purple). Representative of n > 5 mice. (F) 3D IMF images of cleared SI and LI, demonstrating the percentage of LGR5+ crypts (green) that are associated with lymphatic capillaries (LYVE1+, red) (n = 9 mice with ≥ 4 images/region/mouse). Boxed images are magnified. **** indicates a p-value of <0.0001 (Unpaired two-tailed Student’s t-test). (G) Representative 3D IMF images from human SI (terminal ileum) and LI (distal) biopsies, demonstrating conserved association between lymphatics (LYVE1+, red) and the intestinal crypt base (ECAD+, green) (representative of n = 4 individual patients). LGR5-GFP staining in panels (A), (E) and (F) refers to endogenous Lgr5-EGFP expression in Lgr5-EGFP-IRES-CreERT2 mice. Scale bars appear on each image.
Figure 2.
Figure 2.. In vivo and in vitro, lymphatic endothelial cells maintain ISCs and restrict lineage progression.
(A) Schematic for lymphatic ablation. (B) Representative images of lymphatic ablation in SI upon treatment with Diphtheria toxin (DT) as per schematic in (A). (C) Representative IMF images and quantification of OLFM4+ cells in control and DT-treated mice. (D) EdU pulse-chase: Top: EdU+ cells in control and DT-treated mice 30 minutes after EdU (quantified on the right). Bottom: EdU+ cells 48 hours after EdU. The distance between the top of the crypt and the nearest EdU+ cell [μm] is quantified on the bottom right. n = 3 experiments (E) LEC:organoid coculture schematic (left) and a representative IMF image of organoids (ECAD+, green) and LECs (CD31+, white) (right). (F) Organoid growth from single cells harvested from SI (left) and LI (right). The number of single cell-derived organoids under control and coculture conditions is quantified on the right. (n = 2 experiments). (G) Representative images and boxplot showing the percentage of EdU (magenta)-positive cells after a 10 minute-pulse in crypt-derived SI organoids cultured in the absence or presence of LECs (n = 2 experiments). (H) Quantification of organoid size (area) and number of crypt domains (n = 3 experiments). (I) mTomato+ (magenta) organoids grown with or without LECs. Images show SOX9+ progenitors (light blue) and ALDOB+ differentiated enterocytes (yellow). Quantification of ALDOB maximum fluorescence signal intensity is on the right (n = 3 experiments). * p-value 0.01 to 0.05, ** p-value of 0.001 to 0.01, *** p-value of 0.0001 to 0.001, **** p < 0.0001 (Unpaired two-tailed Student’s t-test).
Figure 3:
Figure 3:. scRNA-sequencing supports a role for LECs in enhancing ISCs and reducing terminally differentiated enterocytes within organoids.
(A) Force-directed layout generated from scRNA-seq of organoids cultured with or without LECs. Cells are colored by cell type. (B) Bar plot shows the relative abundance of cell types per condition. (C) Differential abundance testing of cell states in scRNA-seq data using Milo (Dann et al., 2021). Nodes represent Milo neighborhoods, colored by their log2 fold change of cell abundance in LEC-cocultured organoids vs. organoids alone. Node size corresponds to the minus log10 false discovery rate (FDR). Stem/TA cells and differentiated enterocytes are outlined (dotted lines). Mki67+ population from (D) is outlined in red. (D) Force-directed layout colored by the log-transformed normalized gene expression values of Mki67 (cycling cells). (E) Log2 fold change of the expression of villus enterocyte zone genes (Moor et al., 2018) in cocultured and control organoids. Each dot represents a zone gene. Only significantly differentially expressed genes were visualized (absolute value of log2 fold change > 0.1 and FDR < 0.01).
Figure 4.
Figure 4.. Integrated transcriptomics reconstructs cellular and molecular intestinal landscapes.
A) Bayesprism workflow of single-cell:spatial transcriptomic data integration and deconvolution based on BayesPrism to infer joint gene expression and cell type fraction per spot of the 10X Visium gene expression slide. (B and C) Uniform Manifold Approximation and Projection (UMAP) plots of murine scRNA-seq data of SI (B) and LI (C) tissue, containing 2,239 and 5,163 cells respectively. Each cell is colored according to cell type annotation. EE: enteroendocrine cell, pDC: plasmacytoid dendritic cell, cDC: classical dendritic cell, str: stromal cell and TA: transit-amplifying cell. Data were enriched for LECs and LGR5+ ISCs. (D and E) Left: Representative IMF images from SI and LI tissue sections, used for spatial transriptomics. Gray or color-outlined dots reflect the 55 μm (diameter) capture areas. Images show EPCAM+ epithelial cells (white), LYVE1+ lymphatic vasculature (red), DAPI+ nuclei (blue) and, in the SI, OLFM4+ ISCs (green). Right: Pie charts represent the fractions of cell types in each correspondingly colored and numbered spot along the crypt-villus axis deconvolved by BayesPrism. For visualization, multiple crypt-based goblet subtypes were grouped (base goblet).
Figure 5.
Figure 5.. SpaceFold cartography reconstructs transcriptomes along crypt-villus and crypt axis.
(A) SpaceFold schematic. Each spatial spot was deconvolved using BayesPrism (step 1) to infer cell type fractions. Vectors of cell type fractions were reduced to a 1D projection that approximates its physical position along the crypt or crypt-villus axis (step 2). BayesPrism’s cell type-specific gene expression was used to generate trends along this axis for spots containing the cell type(s) of interest (step 3). (B-C) SpaceFold reveals the relative spatial coordinates of cell types, as identified from individual spots, along the SI crypt-villus (B) and LI crypt axis (C). Cell type annotation follows the cluster nomenclature in figures 4B-4C. Each dot represents a Visium spot containing the indicated cell type, plotted along its SpaceFold projection. Black arrow in B denotes computationally reconstructed lymphatic lacteals in the SI, absent in the LI in (C). (D) SpaceFold maps cell type-specific expression of known cell type markers onto the SI crypt-villus axis. X-axes mark the relative SpaceFold spatial coordinate. Histograms show the frequency of spots containing the selected cell types along the crypt-villus axis with corresponding Y-axes on the left. Lines mark smoothed mean values and shaded areas represent the mean ± 2 standard error of total (groups of cell types in left and center panels) or normalized (individual cell types in right panel) gene expression levels inferred by BayesPrism, corresponding to Y-axes on the right. Top panels show the predicted expression in groups of cell types or cell types expected to express the indicated marker genes, while bottom panels show the predicted expression in cell types not expected to express those genes. Black arrowheads indicate the spatial position of crypt-base lymphatics. (E) Intestinal villus epithelial cell zone gene expression distributed spatially along the projected SpaceFold crypt-villus axis. Similar to D, mean z-scores of the normalized expression of each group of zone markers in enterocytes are shown. Each dot represents the mean z-scores averaged over an interval of spatial spots binned by the SpaceFold coordinate. The x-coordinate of each dot represents the mean of the SpaceFold spatial coordinates in each bin. Lines mark the mean values fitted using local polynomial regression. Shaded areas represent the mean ± 2 standard error.
Figure 6.
Figure 6.. Lymphatics form a signaling hub of secreted factors that localize to the crypt.
(A) Single cells derived from organoids grown in control or LEC-conditioned media and re-seeded in 100% organoid (ENR) media. Quantification was done for organoid number (one value/well) and size of organoids (one value/organoid) on day 10 (n = 2 experiments), revealing that LEC effects on ISCs are reversible. (B) Crypt-derived organoids were cultured alone in 50:50 control or LEC-conditioned media. Violin plots of area and number of crypt domains per organoid following culture for 4 days (n = 3 experiments). (C) Representative IMF images of mTomato+ (magenta) organoids grown in control or LEC-conditioned medium. SOX9+ progenitors (light blue) and ALDOB+ differentiated enterocytes (yellow) are shown. (D) Violin plots of candidate lymphatic-secreted factors in selected cell types from mouse SI scRNA-seq. (E) SpaceFold cartographs of candidate lymphatic-secreted factors normalized by the total gene expression of lymphatics over the crypt-villus axis as in figure 5D. X-axes mark the relative spatial coordinate. Histograms with related y-axes on the left refer to spot frequency. Y-axes on the right show normalized expression of the indicated genes (lines). (F) Whole-mount IMF image of SI crypts harboring LGR5+ ISCs (cyan) that are embedded in a network of LYVE1+ lymphatic capillaries (purple) expressing REELIN (yellow). Eye icon indicates the angle of view. LGR5 staining refers to endogenous Lgr5-EGFP expression in Lgr5-EGFP-IRES-CreERT2 mice. (G) Left panel: 3D-reconstructed IMF whole-mount image of the lymphatic capillary network (LYVE1+, purple) along the crypt-villus axis in the SI. Dotted lines outline individual crypts. REELIN expression in lymphatics is color-coded by fluorescence signal intensity, demonstrating highest intensity in the crypt vs lacteals. Right panel: quantification of the signal intensity of REELIN IMF panel plotted against the y-position along the crypt-villus axis. Each dot represents a surface spot of REELIN fluorescence, generated in Imaris 9.5, color-coded by its’ REELIN signal intensity. (H) Immunofluorescent imaging of REELIN (green) in intestinal lymphatics (purple) of control (ctrl, Relnfl/fl) and VE-Cadherin-CreERT2 Relnfl/delta conditional null (Reln c-null) mice showing loss of REELIN in lymphatics. (I) Incorporation of EdU after a 30-minute pulse in mice of the indicated genotype. Representative immunofluorescent images (left) and quantification of EdU+ cells per crypt (right) are shown. (J) Number of SOX9+ cells out of the crypt (TA cells) in control and lymphatic-ablated (left) and control and Reln c-null mice (center). Representative images showing the distribution of LYZ1+ Paneth cells and SOX9+ cells (stem, Paneth and TA cells) are on the right. Panels H-J, showing control and Reln c-null mice, are representative of n = 2 mice per group. (K) Left: schematic of organoid experiments with recombinant murine REELIN. Middle: violin plots of the area and number of crypt domains per organoid cultured in the presence or absence of murine recombinant REELIN for 4 days. Right: representative IMF images showing SOX9 (green) and mTomato (magenta). Asterisk marks the autofluorescent organoid lumen (n = 3 independent experiments). (L) Western blot of murine SI organoids showing phosphorylation of DAB1 upon stimulation with recombinant REELIN (rRELN) for 10 or 20 minutes +/− inhibitors against REELIN receptors (VLDLRi, ITGB1i). Western blot image is representative of n = 3 independent experiments. SF = serum-free media, * on the right indicate non-specific protein bands. For statistics * indicates a p-value 0.01 to 0.05, ** p-value of 0.001 to 0.01, *** p-value of 0.0001 to 0.001, **** p < 0.0001 (Unpaired two-tailed Student’s t-test).

Comment in

References

    1. Alexander JS, Chaitanya GV, Grisham MB, and Boktor M (2010). Emerging roles of lymphatics in inflammatory bowel disease. Ann. N. Y. Acad. Sci 1207, E75–E85. - PubMed
    1. Andersson A, Bergenstråhle J, Asp M, Bergenstråhle L, Jurek A, Fernández Navarro J, and Lundeberg J (2020). Single-cell and spatial transcriptomics enables probabilistic inference of cell type topography. Commun. Biol 3, 562. - PMC - PubMed
    1. Aoki R, Shoshkes-Carmel M, Gao N, Shin S, May CL, Golson ML, Zahm AM, Ray M, Wiser CL, Wright CVE, et al. (2016). Foxl1-expressing mesenchymal cells constitute the intestinal stem cell niche. Cell. Mol. Gastroenterol. Hepatol 2, 175–188. - PMC - PubMed
    1. Baccin C, Al-Sabah J, Velten L, Helbling PM, Grünschläger F, Hernández-Malmierca P, Nombela-Arrieta C, Steinmetz LM, Trumpp A, and Haas S (2019). Combined single-cell and spatial transcriptomics reveal the molecular, cellular and spatial bone marrow niche organization. Nat. Cell Biol 2019 221 22, 38–48. - PMC - PubMed
    1. Baghdadi MB, Ayyaz A, Coquenlorge S, Chu B, Kumar S, Streutker C, Wrana JL, and Kim T-H (2021). Enteric glial cell heterogeneity regulates intestinal stem cell niches. Cell Stem Cell 29, 1–15. - PubMed

Publication types