

Development of cVSSI-APCI for the Improvement of Ion Suppression and Matrix Effects in Complex Mixtures
- PMID: 35729103
- PMCID: PMC9260805
- DOI: 10.1021/acs.analchem.1c05136
Development of cVSSI-APCI for the Improvement of Ion Suppression and Matrix Effects in Complex Mixtures
Abstract
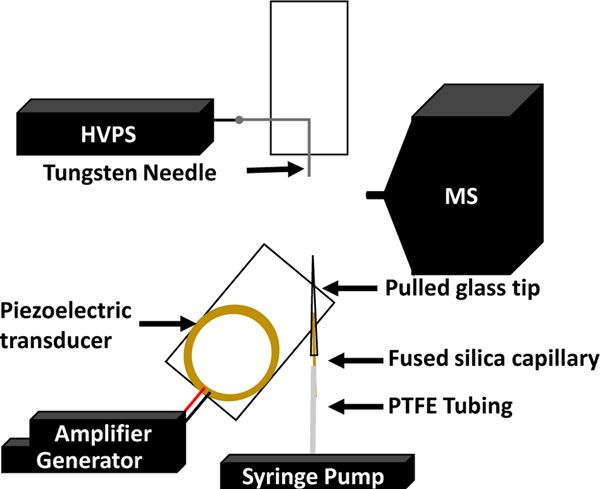
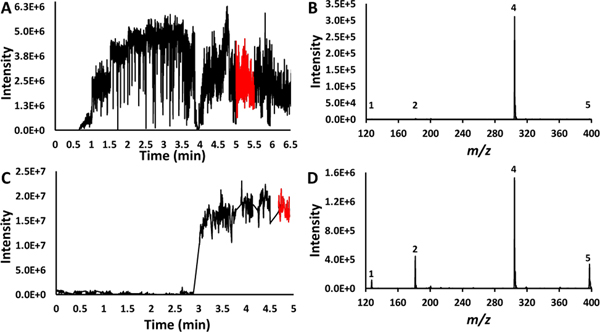
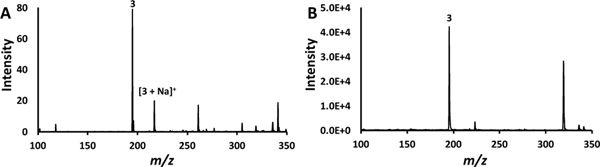
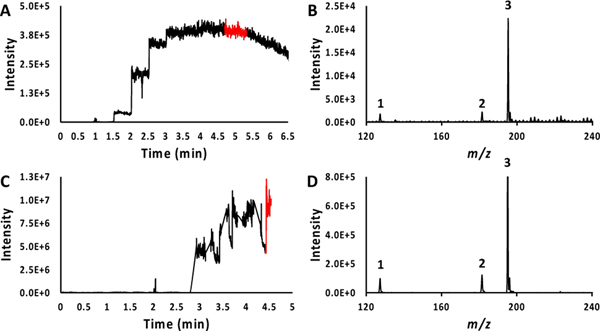
The new ionization technique termed vibrating sharp-edge spray ionization (cVSSI) has been coupled with corona discharge to investigate atmospheric pressure chemical ionization (APCI) capabilities. The optimized source was evaluated for its ability to enhance ion signal intensity, overcome matrix effects, and limit ion suppression. The results have been compared with state-of-the-art ESI source performance as well as a new APCI-like source. In methanol, the ion signal intensity increased 10-fold and >10-fold for cocaine and the suppressed analytes, respectively. The ability to overcome ion suppression was improved from 2-fold to 16-fold for theophylline and vitamin D2, respectively. For aqueous samples, ion signal levels increased by two orders of magnitude for all analytes. In both solvent systems, the signal-to-noise ratios also increased for all suppressed analytes. One example of the characterization of low-ionizing (by ESI or cVSSI alone) species in the presence of high-ionizing species by direct analysis from a cotton swab is presented. The work is discussed with respect to the advantages of cVSSI-APCI for direct, in situ, and field analyses.
Figures
Similar articles
-
Combining Field-Enabled Capillary Vibrating Sharp-Edge Spray Ionization with Microflow Liquid Chromatography and Mass Spectrometry to Enhance 'Omics Analyses.J Am Soc Mass Spectrom. 2021 Feb 3;32(2):473-485. doi: 10.1021/jasms.0c00376. Epub 2021 Jan 8. J Am Soc Mass Spectrom. 2021. PMID: 33417454 Free PMC article.
-
Physicochemical Property Correlations with Ionization Efficiency in Capillary Vibrating Sharp-Edge Spray Ionization (cVSSI).J Am Soc Mass Spectrom. 2021 Jan 6;32(1):84-94. doi: 10.1021/jasms.0c00100. Epub 2020 Aug 28. J Am Soc Mass Spectrom. 2021. PMID: 32856909 Free PMC article.
-
Simultaneous detection of polar and nonpolar compounds by ambient mass spectrometry with a dual electrospray and atmospheric pressure chemical ionization source.Anal Chem. 2015 Feb 3;87(3):1743-8. doi: 10.1021/ac503625m. Epub 2015 Jan 20. Anal Chem. 2015. PMID: 25562530
-
Gas chromatography coupled to atmospheric pressure ionization mass spectrometry (GC-API-MS): review.Anal Chim Acta. 2015 Sep 3;891:43-61. doi: 10.1016/j.aca.2015.08.002. Epub 2015 Aug 13. Anal Chim Acta. 2015. PMID: 26388363 Review.
-
Super-atmospheric pressure ionization mass spectrometry and its application to ultrafast online protein digestion analysis.J Mass Spectrom. 2016 Jun;51(6):396-411. doi: 10.1002/jms.3779. J Mass Spectrom. 2016. PMID: 27270863 Review.
Cited by
-
Acoustic Atomization-Induced Pumping Based on a Vibrating Sharp-Tip Capillary.Micromachines (Basel). 2023 Jun 8;14(6):1212. doi: 10.3390/mi14061212. Micromachines (Basel). 2023. PMID: 37374797 Free PMC article.
-
Applications of ambient ionization mass spectrometry in 2022: An annual review.Anal Sci Adv. 2023 Apr 26;4(5-6):133-153. doi: 10.1002/ansa.202300004. eCollection 2023 Jul. Anal Sci Adv. 2023. PMID: 38716065 Free PMC article. Review.
-
Portable mass spectrometry system: instrumentation, applications, and path to 'omics analysis.Proteomics. 2022 Dec;22(23-24):e2200112. doi: 10.1002/pmic.202200112. Epub 2022 Nov 18. Proteomics. 2022. PMID: 36349734 Free PMC article. Review.
-
Solvent-Assisted Laser Desorption Flexible Microtube Plasma Mass Spectrometry for Direct Analysis of Dried Samples on Paper.Anal Chem. 2023 Dec 19;95(50):18370-18378. doi: 10.1021/acs.analchem.3c03009. Epub 2023 Oct 30. Anal Chem. 2023. PMID: 37902451 Free PMC article.
-
Acoustofluidics: Technology Advances and Applications from 2022 to 2024.Anal Chem. 2025 Apr 8;97(13):6847-6870. doi: 10.1021/acs.analchem.4c06803. Epub 2025 Mar 25. Anal Chem. 2025. PMID: 40133046 Free PMC article. Review. No abstract available.
References
-
- Shelley JT; Badal SP; Engelhard C; Hayen H.Anal. Bioanal. Chem. 2018, 410, 4061–4076. - PubMed
-
- Covey TR; Thomson BA; Schneider BB Mass Spectrom. Rev 2009, 28, 870–897. - PubMed
-
- Harris GA; Nyadong L; Fernandez FM Analyst 2008, 133, 1297–1301. - PubMed
-
- Li Y; Cao Y; Guo Y.Chin. J. Chem 2020, 38, 25–38.
Publication types
MeSH terms
Substances
Grants and funding
LinkOut - more resources
Full Text Sources
