. 2022 Jun 21;11(1):34.
doi: 10.1038/s41389-022-00409-3.

MYCN induces cell-specific tumorigenic growth in RB1-proficient human retinal organoid and chicken retina models of retinoblastoma

Affiliations

MYCN induces cell-specific tumorigenic growth in RB1-proficient human retinal organoid and chicken retina models of retinoblastoma

Maria K E Blixt et al. Oncogenesis. .

Abstract

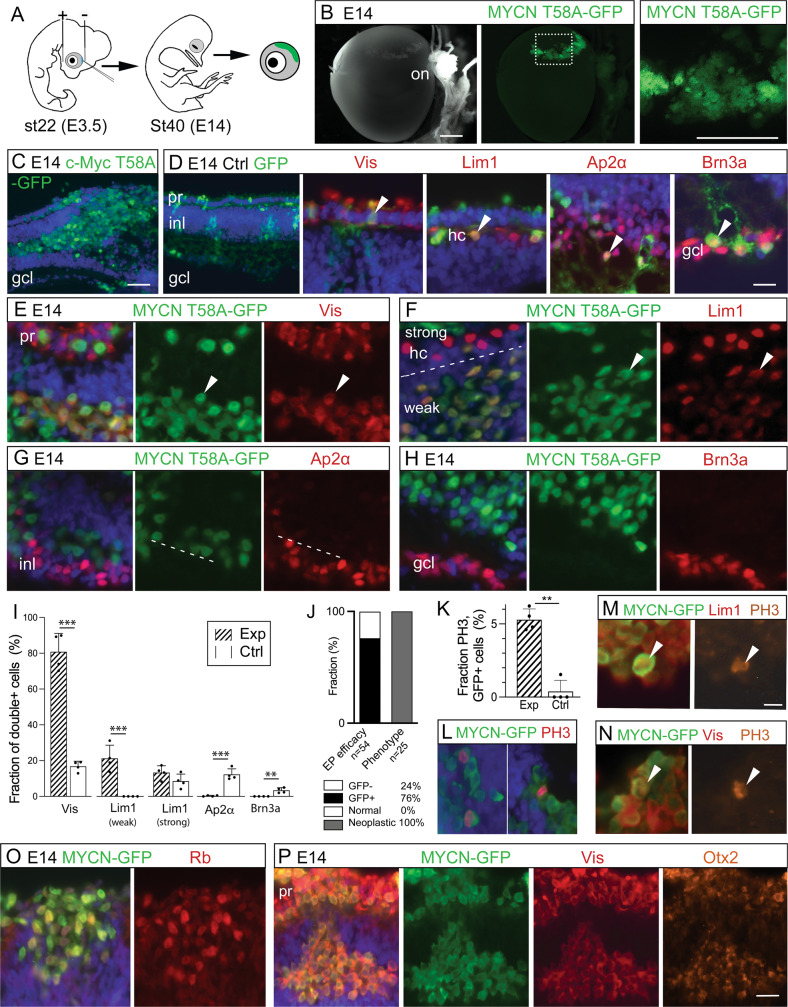
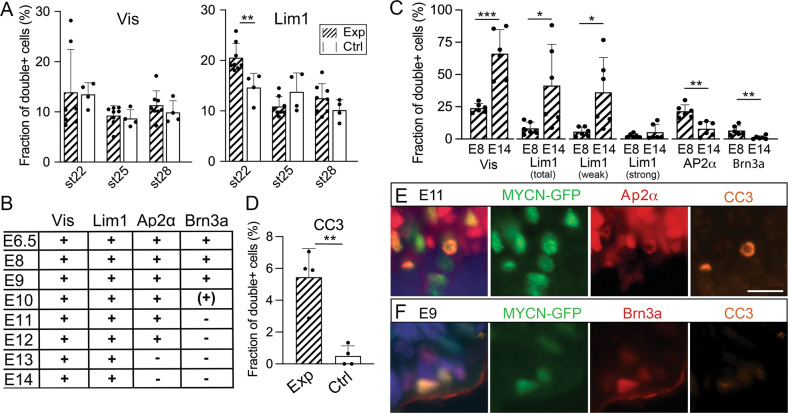
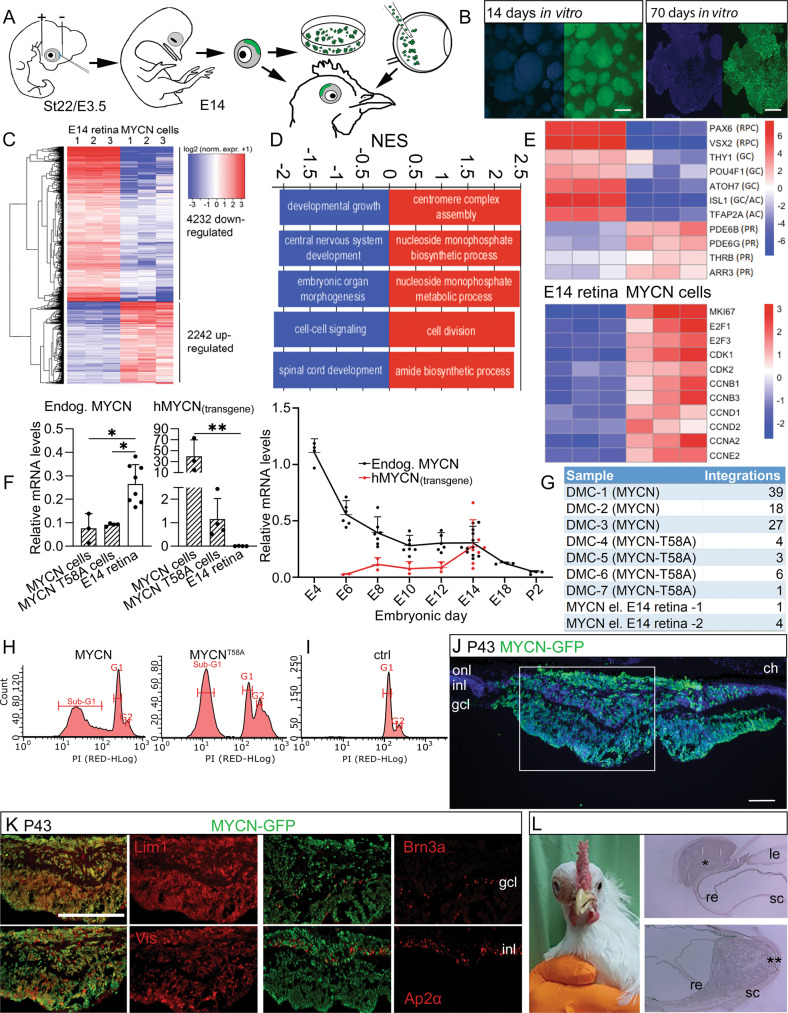
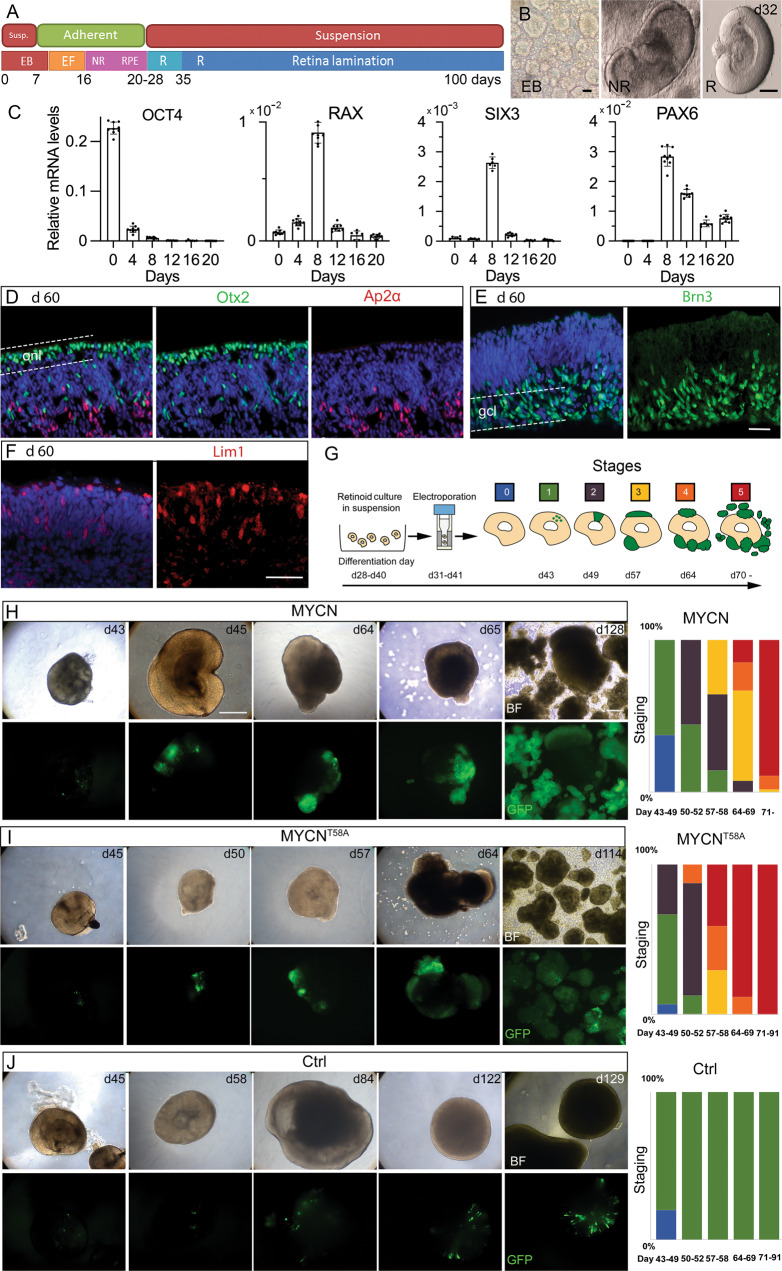
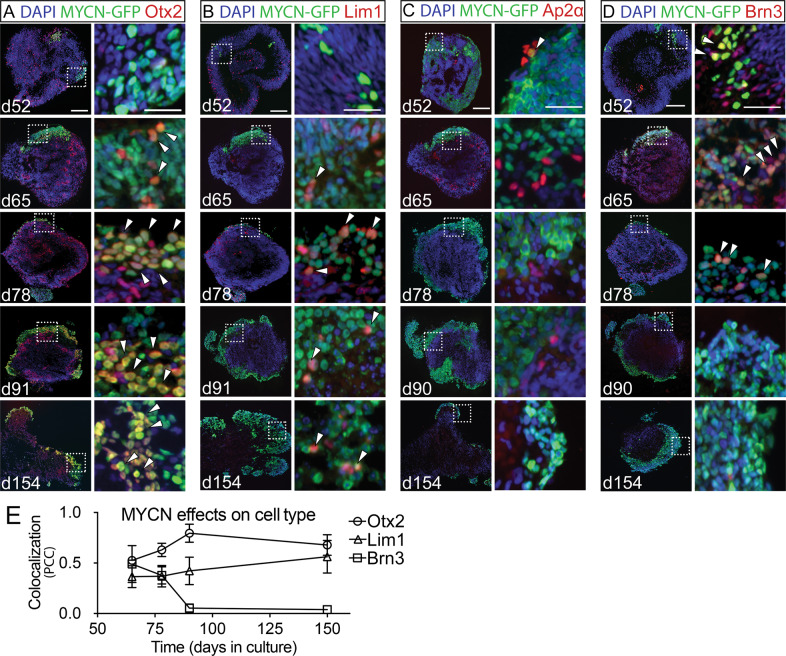
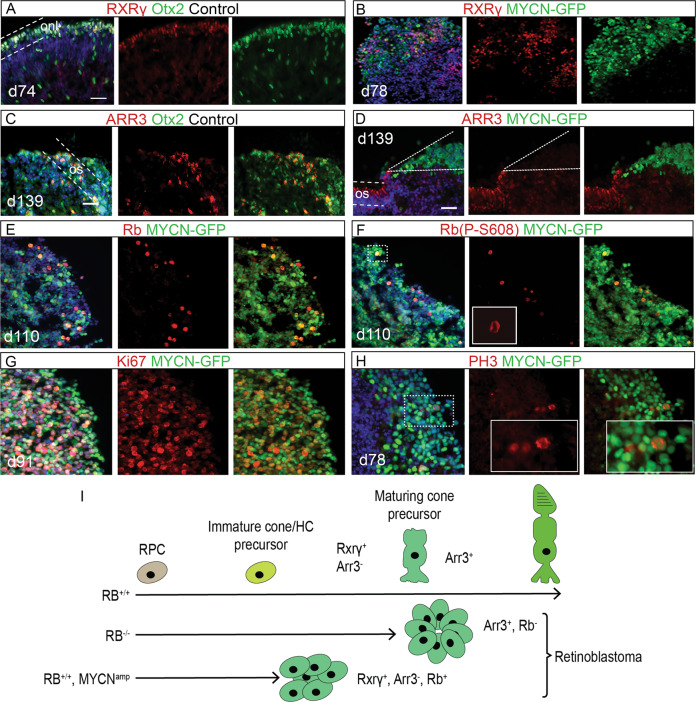
Retinoblastoma is a rare, intraocular paediatric cancer that originates in the neural retina and is most frequently caused by bi-allelic loss of RB1 gene function. Other oncogenic mutations, such as amplification and increased expression of the MYCN gene, have been found even with proficient RB1 function. In this study, we investigated whether MYCN over-expression can drive carcinogenesis independently of RB1 loss-of-function mutations. The aim was to elucidate the events that result in carcinogenesis and identify the cancer cell-of-origin. We used the chicken retina, a well-established model for studying retinal neurogenesis, and established human embryonic stem cell-derived retinal organoids as model systems. We over-expressed MYCN by electroporation of piggyBac genome-integrating expression vectors. We found that over-expression of MYCN induced tumorigenic growth with high frequency in RB1-proficient chicken retinas and human organoids. In both systems, the tumorigenic cells expressed markers for undifferentiated cone photoreceptor/horizontal cell progenitors. The over-expression resulted in metastatic retinoblastoma within 7-9 weeks in chicken. Cells expressing MYCN could be grown in vitro and, when orthotopically injected, formed tumours that infiltrated the sclera and optic nerve and expressed markers for cone progenitors. Investigation of the tumour cell phenotype determined that the potential for neoplastic growth was embryonic stage-dependent and featured a cell-specific resistance to apoptosis in the cone/horizontal cell lineage, but not in ganglion or amacrine cells. We conclude that MYCN over-expression is sufficient to drive tumorigenesis and that a cell-specific resistance to apoptosis in the cone/horizontal cell lineage mediates the cancer phenotype.


Conflict of interest statement

The authors declare no competing interests.

Figures

Fig. 1
Fig. 1. Effects of MYC over-expression in chicken retina.
Fluorescence micrographs of retinal cross sections and bar graphs of cell counting of in ovo electroporated st22/E3.5 chicken embryos with immunohistochemical analysis at st40/E14. GFP epifluorescence indicates transgenic cells in control (Ctrl) and experimental groups (Exp, electroporated with human MYCN or c-MYC with or without the oncogenic T58A mutation). A Schematic illustration of subretinal plasmid injection and electroporation. B Representative micrograph of GFP fluorescence for the Exp group. Dashed box is magnified in the right panel. Micrographs of C GFP positive cells in c-MYCT58A electroporated retina (note the cell-cluster phenotype and disrupted retinal lamination), and D control-electroporated retina with IR for GFP, Visinin (Vis), GFP, Lim1, GFP, Ap2α, and GFP, Brn3a double-positive cells. Micrographs of experimental MYCNT58A retina with IR for E GFP, Visinin, F GFP, Lim1 (note weak staining over cluster cells and strong staining in HCs delineated by a dashed line), G GFP, Ap2α, and H GFP, Brn3a. I Bar graph with counts of GFP and Vis, Lim1, Ap2α, or Brn3a double-positive cells in st40/E14 retina, Ctrl vs Exp (MYCN) groups. J Stacked bar graph of the efficacy of electroporation and the penetrance of the cluster-phenotype after MYCN-electroporation. K Bar graph with counts and L micrographs with GFP, phospho-histone 3 (PH3) double-positive cells in Ctrl vs Exp groups. Micrographs of M GFP, PH3, Lim1 triple-positive and N GFP, PH3, Vis triple-positive cells in Exp groups. Note the PH3 IR over mitotic figures in panels LN Micrographs of O GFP, Rb double-positive and P GFP, Vis, Otx2 triple-positive cells in Exp group st40/E14 retina. Mean ± SD, **p < 0.01, ***p < 0.005, I ANOVA n = 4, 6 550 GFP+ cells analysed, and K Student’s t-test n = 4, 1 587 GFP+ cells analysed. Arrowheads exemplify double- and triple-positive cells. E embryonic day, gcl ganglion cell layer, hc horizontal cell, inl inner nuclear layer, IR immunoreactivity, on optic nerve, PH3 phospho-histone 3, pr photoreceptor, st Hamburger & Hamilton developmental stage, Vis Visinin. Scale bars in B, 500 µm; in C, 200 µm also applicable to left panel in (D), in D, 25 µm also for EH, M, N, P; in O, 10 µm, and P, 50 µm.
Fig. 2
Fig. 2. Stage- and cell-specific responses to over-expression of MYCN, MYCNT58A, and c-MYCT58A in chicken retina.
Fluorescence micrographs and cell counts of retinas electroporated with MYC constructs and analysed at various stages. GFP epifluorescence indicate MYC over-expressing cells. Effects of over-expression on retinal cell types over time were analysed. A Bar graphs with fractions of GFP, Lim1 and GFP, Visinin (Vis) double-positive cells in experimental (Exp) and control (Ctrl) group retinas electroporated at st22/E3.5, st25/E4.5, or st28/E5.5 and analysed after 48 h. Experimental group consisted of animals electroporated with c-MYCT58A or MYCNT58A. See also Fig. S2A. B Table displaying the estimation of presence (+) or absence (−) of GFP and Vis, Lim1, Ap2α, or Brn3a double-positive cells in retinas electroporated with c-MYCT58A or MYCNT58A at st22/E3.5 and analysed at st30/E6.5-st40/E14. C Bar graphs with fractions of GFP and Vis, Lim1 (total, weak, and strong staining), Ap2α, or Brn3a double-positive cells in retinas electroporated with MYCN at st22/E3.5 and analysed at st34/E8 or st40/E14. D Bar graph with fractions of GFP, CC3 double-positive cells in Exp and Ctrl groups electroporated with MYCN or GFP control, respectively, at st22/E3.5 and analysed at st40/E14. E, F Fluorescence micrographs showing GFP, CC3, and Ap2α or Brn3a triple-positive cells in retinas electroporated with MYCN at st22/E3.5 and analysed st37/E11 or st35/E9. Mean ± SD, *p < 0.05, **p < 0.01, ***p < 0.001, A ANOVA n(exp) = 8, n(ctrl) = 4, B Student’s t-test, n = 4, C Student’s t-test, st34/E8, 16 568 cells counted, n = 6; st40/E14, 26 855 cells counted, n = 6. D Student’s t-test, 1 357 cells counted, n = 4. CC3 cleaved caspase-3, E embryonic day, st Hamburger & Hamilton developmental stage, Vis Visinin. Scale bar in E is 25 µm also for F.
Fig. 3
Fig. 3. Establishment of cells from MYCN/MYCNT58A electroporated retina, tumour formation from orthotopically injected MYCNT58A cells, and MYCN over-expression in adult chicken retina.
Cells from electroporated chicken retina were cultured and green-fluorescing, MYCN/MYCNT58A-expressing cells were enriched in vitro, forming pure cultures. The transcriptome of three MYCN cell lines was determined by RNA sequencing and compared to the transcriptome of st40/E14 retina. Differentially expressed genes (DEG) and Gene Ontology (GO) over-representation was determined. MYCN expression and the number of vector integrations was quantified and the cell cycle of the established MYCN cells was analysed. Established MYCN/MYCNT58A cells were orthotopically injected and the eye was analysed. Long-term effects of MYCN expression in retina after in ovo electroporation was also analysed. A Schematic illustration of subretinal plasmid injection and electroporation, establishment of MYC cells, and orthotopic injection. B Representative fluorescence micrographs of 2- and 10-week-old (left and right, respectively) primary MYCN-cell cultures established from retinas electroporated at st22/E3.5 and dissected at st40/E14. C Heat map with log2 normalised expression +1 according to colour scale, featuring DEG (FDR < 0.05, log2 fold-change >1, n = 3) in st40/E14 retina and MYCN cells. Of the 13 218 genes that were analysed in the samples, 6 474 were differentially expressed and the majority of them were downregulated. D GO gene set enrichment analysis identified 419 GO terms with gene sets of at least 10 genes (FDR < 0.05). The 5 GO terms with the most up- and downregulated DEG based on their normalised enrichment scores (NES) are displayed. Note that the GO terms with downregulated DEG represent neuronal categories and the upregulated ones represent cell-cycle and biogenesis categories related to proliferation. E Heat maps with log2 normalised expression +1 according to colour scales, of selected genes for the retinal cell types and for genes regulating cell proliferation. Note that genes related to ganglion (THY1, POU4F1/Brn3a, ATOH7) or amacrine cells (ISL1, TFAP2A/Ap2α) are downregulated and genes related to photoreceptor (PDE6B, THRB, ARR3) functions are upregulated. F Relative mRNA levels of endogenous MYCN and transgene hMYCN depicted in bar graphs with established MYCN and MYCNT58A cells, and ctrl st40/E14 retinas and as an in a line plot of normal and electroporated retinas of ages between st24/E4–P2. G Table with number of vector integrations per haploid genome in MYCN and MYCNT58A primary cells and retinas electroporated at st22/E3.5 and analysed at st40/E14. H, I Cell cycle analysis plots showing number of cells and their DNA content as determined by propidium iodide (PI)-staining of MYCN and MYCNT58A and control retinal cells. The sub-G1 peak seen in MYCN and MYCNT58A samples are dead/apoptotic cells. J Fluorescence micrographs of retina electroporated with a MYCN vector at st22/E3.5, stained for GFP and Lim1, Vis, Brn3a, or Ap2α and analysed at P43. Note the absence of ganglion and amacrine cell markers in the tumour. K Photograph of a P58 chicken with a large tumour from MYCN expression generated by electroporation at st22/E3.5. L Bright-field micrograph of haematoxylin staining of extraocular * and intraocular ** tumours. Mean + SD, *p < 0.05, **p< 0.01, ***p< 0.001; F ANOVA, n = 3–8. AC Amacrine cells, Ch choroid, ctrl control, E embryonic day, FDR false discovery rate, GC Ganglion cells, gcl ganglion cell layer, inj injection, inl inner nuclear layer, le lens, NES normalised enrichment score, onl outer nuclear layer, PR Photoreceptors, P post-hatch day, re retina, RPC Retinal progenitor cells, sc sclera, st stage. Scale bars in B, 300 µm; in I–M, 10 µm; in N, O, 50 µm.
Fig. 4
Fig. 4. Neoplastic transformation of human retinal organoid cells by over-expression of MYCN or MYCNT58A.
Human hESC-derived retinal organoids were generated and electroporated with MYCN or MYCNT58A piggyBac vectors at a stage when early retinal progenitors were present. The MYCN or MYCNT58A transgenes were constitutively over-expressed in the organoids, mimicking copy number amplifying MYCN oncogenic mutations. The effect of over-expression was monitored by GFP expression from the MYCN-GFP bi-cistronic expression units. A Schematic illustration of the culture conditions and organoid development. B Representative images of organoids during three stages of development. C Bar graphs with relative mRNA levels of OCT4, RAX, SIX3, and PAX6 during early retinal organoid development. Fluorescence micrographs of naïve d60 organoids with IR for D Otx2 and Ap2α, I Brn3, and F Lim1. Dashed lines delineate outer retina/onl or the inner retina/gcl. G Schematic of the electroporation protocol for transfecting developing organoids. The image also depicts the scores (0-5) of the neoplastic stages and their associated phenotypes. HJ Brightfield and fluorescence low magnification micrographs of the progressive growth of GFP-positive cell populations with representative examples of organoids with tumorigenic neoplastic growth in MYCN transformed organoids (green fluorescence) as well as stacked histograms showing the percentiles of organoids belonging to each neoplastic stage over time in H MYCN-, I MYCNT58A-, and J control-electroporated organoids. BF brightfield, d days in culture (organoid age), EB embryoid body, EF eye field, gcl ganglion cell layer, IR immunoreactivity, NR neural retina, onl outer nuclear layer, R retina, RPE retinal pigment epithelium. Scale bars in B are 200 µm, in E and F 50 µm, and in H 200 µm.
Fig. 5
Fig. 5. Cell-specific survival following over-expression of MYCN in human retinal organoids.
Immunohistochemical analysis of human retinal organoids electroporated on d39–41 with a bi-cistronic MYCN-GFP piggyBac expression vector. The electroporation generated stable and robust MYCN over-expression in all cell types driven by the CAG promoter and visualised by GFP. Time-points between d52 and 154 were analysed. Electroporation at d39–41 targets retinal progenitors before neuronal differentiation. Fluorescence micrographs of MYCN organoids of various ages are shown with IR for GFP and A Otx2, B Lim1, C Ap2α, and D Brn3. Dashed line-boxes in the left panels indicate magnified regions shown in the right panel images. White arrowheads depict examples of colocalization of MYCN-GFP with either of the retinal cell-markers. E Line graph showing colocalization of MYCN-GFP with Otx2, Lim1, or Brn3 IR. Colocalization is illustrated by Pearson’s correlation coefficient (PCC) where 1 is high correlation (colocalization) and 0 is low. Mean ± SD, n = 4. d, days in culture (organoid age). Scale bars in left image panels are 100 µm and in right panels are 25 µm.
Fig. 6
Fig. 6. Effects of MYCN over-expression on differentiation and proliferation in human retinal organoids.
Immunohistochemical analysis of human retinal organoids electroporated on d39–41 with a bi-cistronic MYCN-GFP piggyBac expression vector. The electroporation generated stable and robust MYCN over-expression in all cell types driven by the CAG promoter and visualised by GFP. Fluorescence micrographs of A and C naïve control organoids and B, DH MYCN-electroporated organoids aged between d74–139 in culture. IR for A RXRγ and Otx2; dashed lines delineate onl, B GFP and RXRγ, C ARR3 and Otx2; dashed lines delineate the outer segments (os) D GFP and ARR3; note the absence of colocalization between ARR3 positive cells and GFP positive cells delineated with the dashed lines, E GFP and total Rb, F GFP and S608-phosphorylated Rb, G GFP and Ki67 (proliferation antigen Ki67), and H GFP and PH3 (phospho-histone 3). Dashed line-boxes indicate magnified region in right panels. Note the GFP, PH3 double-positive mitotic figure in anaphase. I Schematic illustration depicting effects of bi-allelic loss of RB1 or MYCN over-expression on retinal progenitor cells. Homozygous loss of RB1 function generates differentiated tumour cells that express ARR3 while over-expression of MYCN generates less differentiated cells that do not express ARR3. d days in culture (organoid age), IR immunoreactivity, onl outer nuclear layer, os outer segments. Scale bars are 50 µm.

References

    1. Buss RR, Sun W, Oppenheim RW. Adaptive roles of programmed cell death during nervous system development. Annu Rev Neurosci. 2006;29:1–35. doi: 10.1146/annurev.neuro.29.051605.112800. - DOI - PubMed
    1. Fawcett JW, O’Leary DD, Cowan WM. Activity and the control of ganglion cell death in the rat retina. Proc Natl Acad Sci USA. 1984;81:5589–93. doi: 10.1073/pnas.81.17.5589. - DOI - PMC - PubMed
    1. Provis JM, van Driel D, Billson FA, Russell P. Human fetal optic nerve: Overproduction and elimination of retinal axons during development. J Comp Neurol. 1985;238:92–100. doi: 10.1002/cne.902380108. - DOI - PubMed
    1. Baleriola J, Suarez T, de la Rosa EJ. DNA-PK promotes the survival of young neurons in the embryonic mouse retina. Cell Death Differ. 2010;17:1697–706. doi: 10.1038/cdd.2010.46. - DOI - PubMed
    1. Becker EB, Bonni A. Cell cycle regulation of neuronal apoptosis in development and disease. Prog Neurobiol. 2004;72:1–25. doi: 10.1016/j.pneurobio.2003.12.005. - DOI - PubMed