. 2022 Jun 22;10(1):45.
doi: 10.1038/s41413-022-00211-2.

FABP4 secreted by M1-polarized macrophages promotes synovitis and angiogenesis to exacerbate rheumatoid arthritis

Affiliations

FABP4 secreted by M1-polarized macrophages promotes synovitis and angiogenesis to exacerbate rheumatoid arthritis

Dong Guo et al. Bone Res. .

Erratum in

Abstract

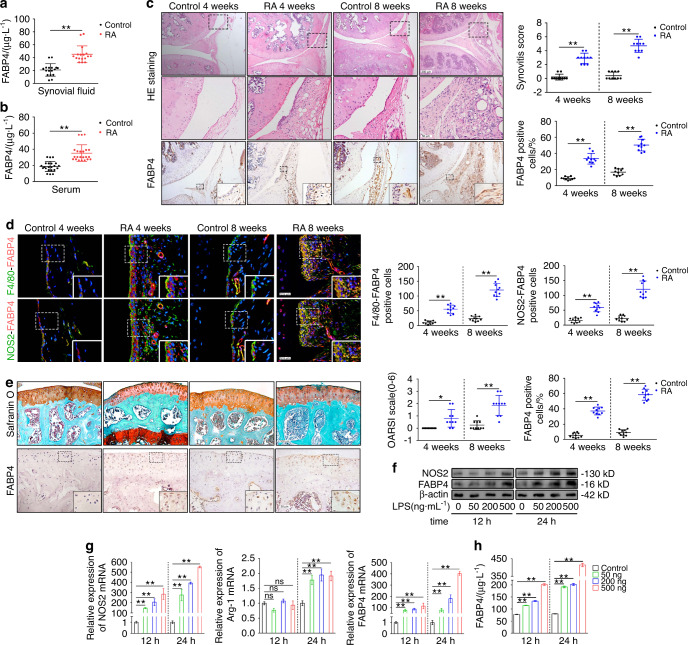
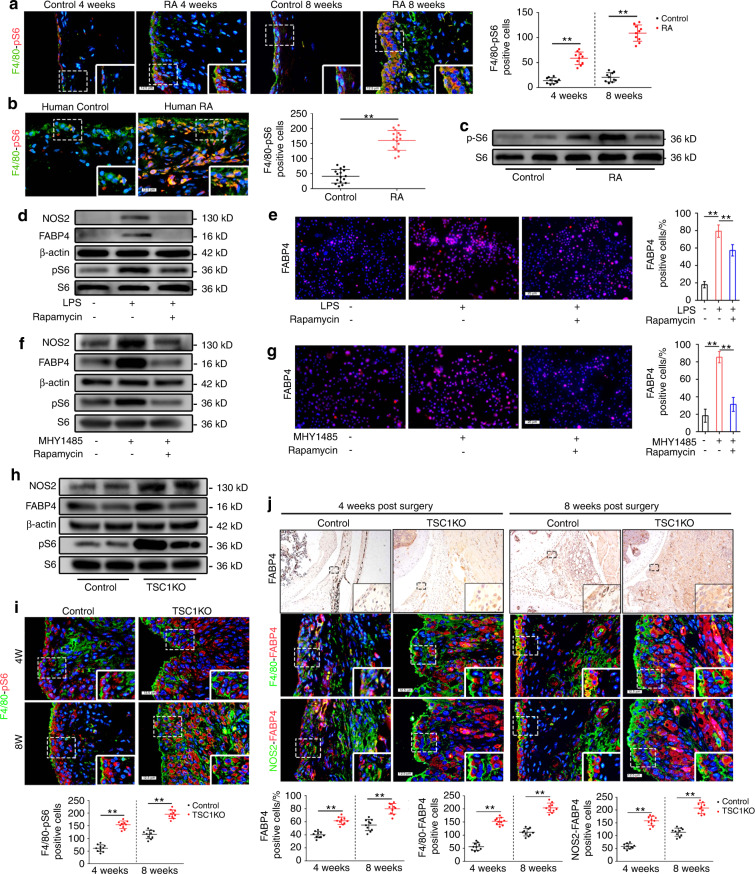
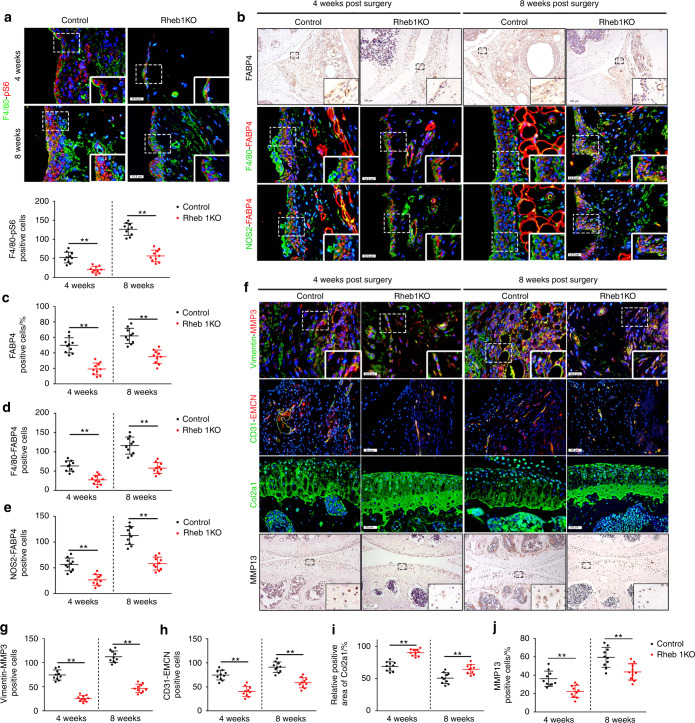
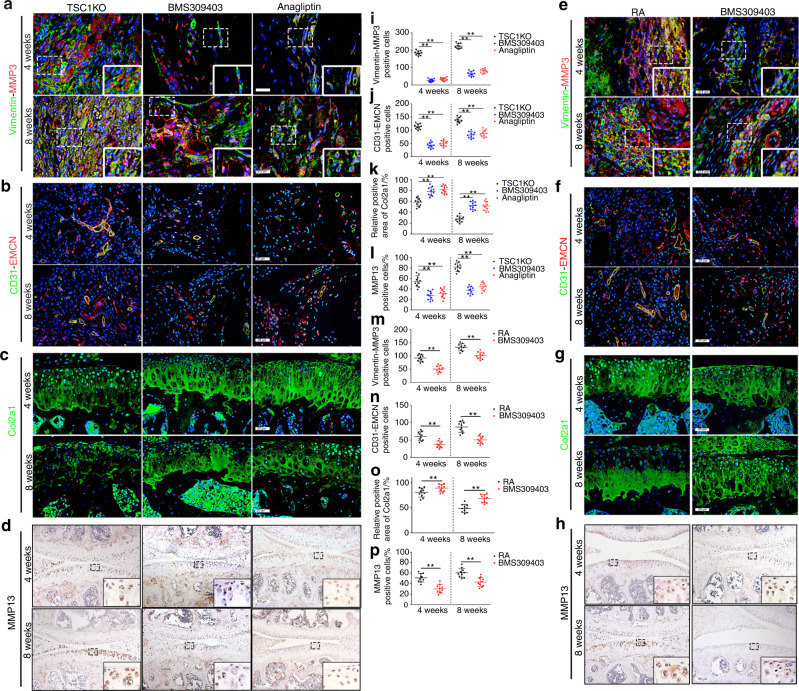
Increasing evidence shows that adipokines play a vital role in the development of rheumatoid arthritis (RA). Fatty acid-binding protein 4 (FABP4), a novel adipokine that regulates inflammation and angiogenesis, has been extensively studied in a variety of organs and diseases. However, the effect of FABP4 on RA remains unclear. Here, we found that FABP4 expression was upregulated in synovial M1-polarized macrophages in RA. The increase in FABP4 promoted synovitis, angiogenesis, and cartilage degradation to exacerbate RA progression in vivo and in vitro, whereas BMS309403 (a FABP4 inhibitor) and anagliptin (dipeptidyl peptidase 4 inhibitor) inhibited FABP4 expression in serum and synovial M1-polarized macrophages in mice to alleviate RA progression. Further studies showed that constitutive activation of mammalian target of rapamycin complex 1 (mTORC1) by TSC1 deletion specifically in the myeloid lineage regulated FABP4 expression in macrophages to exacerbate RA progression in mice. In contrast, inhibition of mTORC1 by ras homolog enriched in brain (Rheb1) disruption specifically in the myeloid lineage reduced FABP4 expression in macrophages to attenuate RA development in mice. Our findings established an essential role of FABP4 that is secreted by M1-polarized macrophages in synovitis, angiogenesis, and cartilage degradation in RA. BMS309403 and anagliptin inhibited FABP4 expression in synovial M1-polarized macrophages to alleviate RA development. Hence, FABP4 may represent a potential target for RA therapy.


Conflict of interest statement

The authors declare no competing interests.

Figures

Fig. 1
Fig. 1
The expression of FABP4 in the RA mouse model, BMDMs and RA patients. a, b FABP4 concentrations in the synovial fluid (a) and serum (b) of controls and RA patients (n = 8 per group) were assessed by ELISA. C Representative images and quantification of HE staining and FABP4 immunohistochemical staining in the synovium of control and C57BL/6 J mice at 4 and 8 weeks after AIA modeling (n = 10 per group). Scale bars: 50 μm, 100 μm and 200 μm. d Representative images and quantitative analysis of coimmunostaining of FABP4 with F4/80 or NOS2 in the synovium of control and C57BL/6 J mice at 4 and 8 weeks after AIA modeling (n = 10 per group). Scale bars: 12.5 μm. e Representative images and quantification of safranin O and fast green staining and FABP4 immunohistochemical staining in knee cartilage from controls and C57BL/6 J mice at 4 and 8 weeks after AIA modeling (n = 10 per group). Scale bars: 50 μm and 100 μm. f Western blot showing FABP4 and NOS2 in BMDMs stimulated with 50, 200, or 500 ng·mL−1 LPS for 12 h or 24 h. g Quantitative PCR analysis of NOS2, Arg-1, and FABP4 mRNA expression in BMDMs (n = 3 per group). h FABP4 concentrations in the supernatant of BMDMs stimulated with 50, 200, or 500 ng·mL−1 LPS for 12 h or 24 h (n = 3 per group) were assessed by ELISA. Student’s t-test or one-way analysis of variance (ANOVA) and Tukey’s multiple comparison test. *P < 0.05, **P < 0.01; ns, no significance. The data are shown as the mean ± SEM
Fig. 2
Fig. 2
The effect of FABP4 and M1-polarized macrophage supernatant on HUVECs, FLSs, and chondrocytes in vitro. a, b Tube formation assay and quantification of HUVECs cultured with vehicle (C), rhFABP4 (P), rhFABP4 + BMS309403 (PB), M1-polarized macrophage supernatant (S), or M1-polarized macrophage supernatant+BMS309403 (SB) (n = 3 per group). Scale bar: 100 µm. c Immunoblot analysis of FABP4 and VEGFα in HUVECs cultured with C, P, PB, S, or SB for 24 h. d, g Representative images and quantification of BrdU (green) immunofluorescence (d) and Transwell assays (g) in HUVECs and FLSs treated with C, P, PB, S, or SB for 24 h (n = 3 per group). Scale bar: 25 µm, 100 µm. e, f Immunoblot analysis of ERK1/2, p-ERK1/2, P65, and p-P65 in HUVECs (e) and FLSs (f) treated with C, P, PB, S, or SB for 1 h. h Toluidine blue staining of ATDC5 cells treated with C, P, PB, S, or SB for 24 h (n = 3 per group). i Immunoblot analysis of FABP4, MMP13, Sox9, and Col2a1 in primary chondrocytes treated with C, P, PB, S, or SB for 24 h. j Immunoblot analysis of P65 and p-P65 in primary chondrocytes treated with C, P, PB, S, or SB for 1 h. One-way ANOVA and Tukey’s multiple comparison test. *P < 0.05, **P < 0.01; #P < 0.05, ##P < 0.01 compared to the control. The data are shown as the mean ± SEM
Fig. 3
Fig. 3
Recombinant FABP4 exacerbates the development of RA in C57BL/6 J mice. a Representative images and quantitative analysis of FABP4 were assessed by immunohistochemical staining and coimmunostaining of FABP4 with F4/80 or NOS2 in the synovium of control and RA mice treated with vehicle or rmFABP4 for 4 and 8 weeks (n = 10 per group). Scale bars: 12.5 µm and 100 µm. bi Representative images and quantification of Vimentin and MMP3 coimmunostaining (b, f), CD31 and EMCN coimmunostaining (c, g), Col2a1 immunofluorescence staining (d, h), and MMP13 immunohistochemical staining (e, i) in the knee joints of control and RA mice treated with vehicle or rmFABP4 for 4 and 8 weeks (n = 10 per group). Scale bars: 12.5 µm, 25 µm, and 100 µm. One-way ANOVA and Tukey’s multiple comparison test. **P < 0.01. The data are shown as the mean ± SEM
Fig. 4
Fig. 4
Activation of the mTORC1 pathway enhances the secretion of FABP4 by M1-polarized macrophages to exacerbate RA progression. a, b Representative images and quantification of F4/80 and pS6 coimmunostaining in the mouse (n = 10 per group) (a) and human synovium (n = 16 per group) (b) of the control and RA groups. Scale bar: 12.5 µm. c Western blot showing S6 and pS6 in human synovial tissue. d Western blot showing FABP4, NOS2, S6 and pS6 in BMDMs treated with LPS or rapamycin. e Representative immunofluorescence staining images and quantitative analysis of FABP4 in BMDMs stimulated with LPS or rapamycin (n = 3 per group). Scale bar: 100 µm. f Western blot showing FABP4, NOS2, S6 and pS6 in BMDMs treated with MHY1485 or rapamycin. g Representative immunofluorescence staining images and quantitative analysis of FABP4 in BMDMs treated with MHY1485 or rapamycin (n = 3 per group). Scale bar: 100 µm. h Western blot showing FABP4, NOS2, S6 and pS6 in BMDMs from control and TSC1KO mice. i Representative images and quantification of F4/80 and pS6 coimmunostaining in the synovium of wild-type and TSC1KO mice at 4 and 8 weeks after AIA modeling (n = 10 per group). Scale bar: 12.5 µm. j Representative images and quantification of FABP4 immunohistochemical staining and coimmunostaining of FABP4 with F4/80 or NOS2 in the synovium of control and TSC1KO mice at 4 and 8 weeks after AIA modeling (n = 10 per group). Scale bars: 12.5 µm and 100 µm. f–j Representative images (f) and quantification of Vimentin and MMP3 coimmunostaining (g), CD31 and EMCN coimmunostaining (h), Col2a1 immunofluorescence staining (i), and MMP13 immunohistochemical staining (j) in the knee joints of controls and TSC1KO mice at 4 and 8 weeks after AIA modeling (n = 10 per group). Scale bar: 12.5 µm, 25 µm, and 100 µm. Student’s t-test or one-way ANOVA and Tukey’s multiple comparison test. **P < 0.01. The data are shown as the mean ± SEM
Fig. 5
Fig. 5
Inhibition of the mTORC1 pathway reduces FABP4 secretion by M1-polarized macrophages to attenuate RA progression. a Representative images and quantification of F4/80 and pS6 coimmunostaining in the synovium of controls and Rheb1KO mice at 4 and 8 weeks after AIA modeling (n = 10 per group). Scale bar: 12.5 µm. be Representative images (b) and quantitative analysis of FABP4 immunohistochemical staining (c) and coimmunostaining of FABP4 with F4/80 (d) or NOS2 (e) in the synovium of controls and Rheb1KO mice at 4 and 8 weeks after AIA modeling (n = 10 per group). Scale bars: 12.5 µm and 100 µm. fj Representative images (f) and quantitative analysis of Vimentin and MMP3 coimmunostaining (g), CD31 and EMCN coimmunostaining (h), Col2a1 immunofluorescence staining (i), and MMP13 immunohistochemical staining (j) in the knee joints of controls and Rheb1KO mice at 4 and 8 weeks after AIA modeling (n = 10 per group). Scale bar: 12.5 µm, 25 µm, and 100 µm. Student’s t-test. **P < 0.01. The data are shown as the mean ± SEM
Fig. 6
Fig. 6
BMS309403 and anagliptin reduce FABP4 expression in murine synovial macrophages. ac Representative images and quantification of FABP4 immunohistochemical staining and coimmunostaining of FABP4 with F4/80 or NOS2 in the synovium of TSC1KO mice treated with vehicle, BMS309403 or anagliptin for 4 and 8 weeks after AIA modeling (n = 10 per group). Scale bar: 12.5 µm and 100 µm. df Representative images and quantification of FABP4 immunohistochemical staining and coimmunostaining of FABP4 and F4/80 or NOS2 in the synovium of RA mice treated with vehicle or BMS309403 for 4 and 8 weeks (n = 10 per group). Scale bar: 12.5 µm and 100 µm. Student’s t-test or one-way ANOVA and Tukey’s multiple comparison test. *P < 0.05, **P < 0.01. The data are shown as the mean ± SEM
Fig. 7
Fig. 7
Inhibiting FABP4 prevents RA development. ad Representative images of Vimentin and MMP3 coimmunostaining (a), CD31 and EMCN coimmunostaining (b), Col2a1 immunofluorescence staining (c), and immunohistochemical staining of MMP13 (D) in the knee joints of TSC1KO mice treated with vehicle, BMS309403 or anagliptin for 4 and 8 weeks after AIA modeling. Scale bar: 12.5 µm, 25 µm, and 100 µm. eh Representative images of Vimentin and MMP3 coimmunostaining (e), CD31 and EMCN coimmunostaining (f), Col2a1 immunofluorescence staining (g), and immunohistochemical staining of MMP13 (h) in the knee joints of RA mice treated with vehicle or BMS309403 for 4 and 8 weeks. Scale bar: 12.5 µm, 25 µm, and 100 µm. il Quantification of Vimentin-MMP3 (i), CD31-EMCN (j), Col2a1 (k), and MMP13 (l) in TSC1KO mice treated with vehicle, BMS309403, or anagliptin for 4 and 8 weeks after AIA surgery (n = 10 per group). mp Quantification of Vimentin-MMP3 (m), CD31-EMCN (n), Col2a1 (o), and MMP13 (p) in RA mice treated with vehicle or BMS309403 for 4 and 8 weeks (n = 10 per group). Student’s t-test or one-way ANOVA and Tukey’s multiple comparison test were used. **P < 0.01. The data are shown as the mean ± SEM

References

    1. Buckley BJ, Ali U, Kelso MJ, Ranson M. The urokinase plasminogen activation system in rheumatoid Arthritis: Pathophysiological roles and prospective therapeutic targets. Curr. Drug Targets. 2019;20:970–981. - PMC - PubMed
    1. Patel D, et al. Cost-effectiveness of early treatment with originator biologics or their biosimilars after methotrexate failure in patients with established rheumatoid arthritis. Adv. Ther. 2019;36:2086–2095. - PMC - PubMed
    1. Zhai KF, et al. Liquiritin from glycyrrhiza uralensis attenuating rheumatoid arthritis via reducing inflammation, suppressing angiogenesis, and inhibiting MAPK signaling pathway. J. Agric. Food Chem. 2019;67:2856–2864. - PubMed
    1. Shi Y, et al. Transcription factor SOX5 promotes the migration and invasion of fibroblast-like synoviocytes in part by regulating MMP-9 expression in collagen-induced arthritis. Front. Immunol. 2018;9:749. - PMC - PubMed
    1. Yang G, et al. Resveratrol alleviates rheumatoid arthritis via reducing ROS and inflammation, inhibiting mapk signaling pathways, and suppressing angiogenesis. J. Agric. Food Chem. 2018;66:12953–12960. - PubMed