

A multi-ethnic polygenic risk score is associated with hypertension prevalence and progression throughout adulthood
- PMID: 35729114
- PMCID: PMC9213527
- DOI: 10.1038/s41467-022-31080-2
A multi-ethnic polygenic risk score is associated with hypertension prevalence and progression throughout adulthood
Abstract
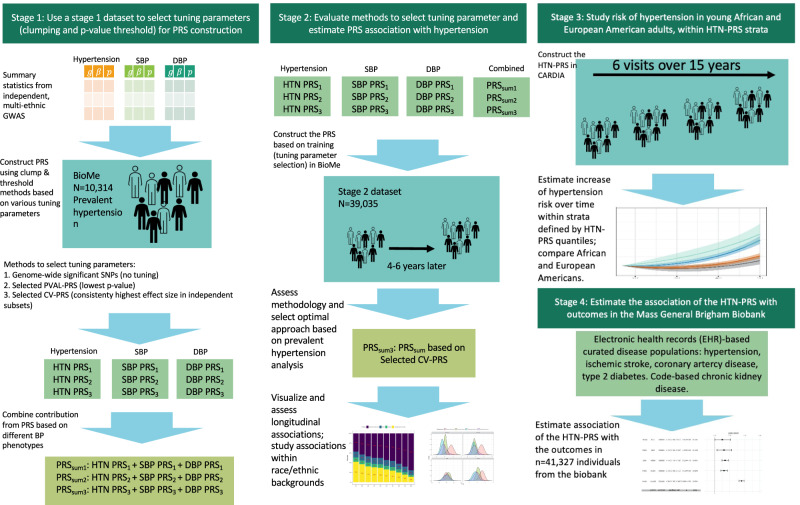
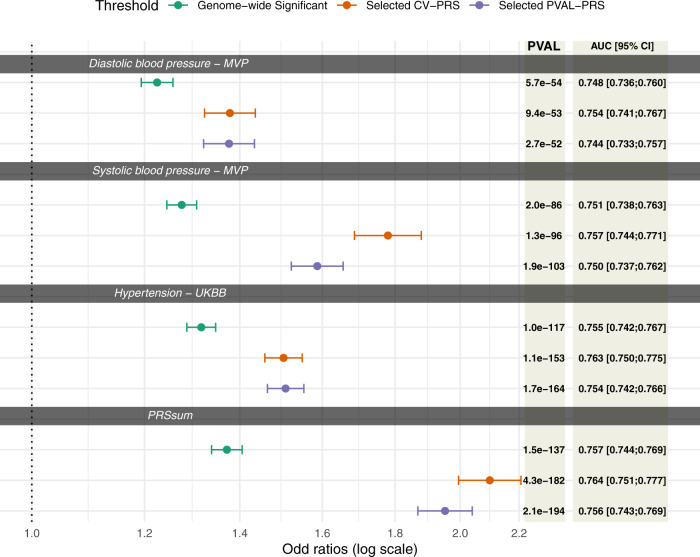
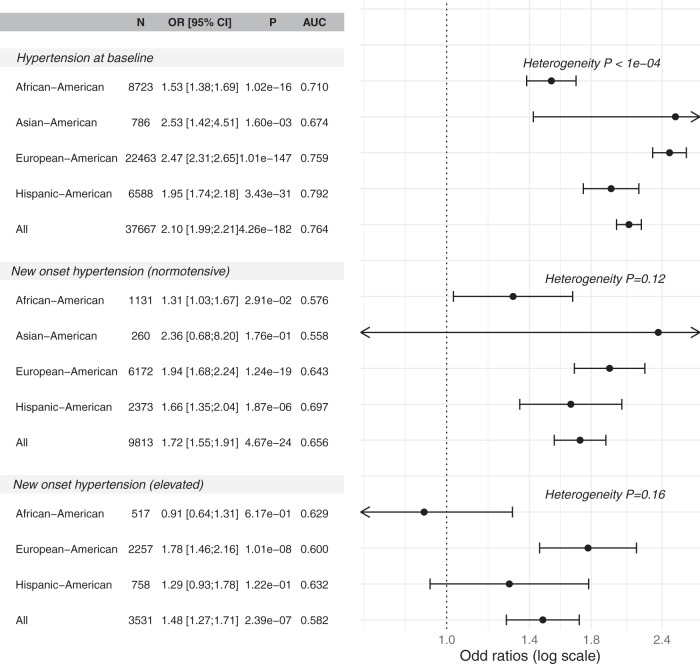
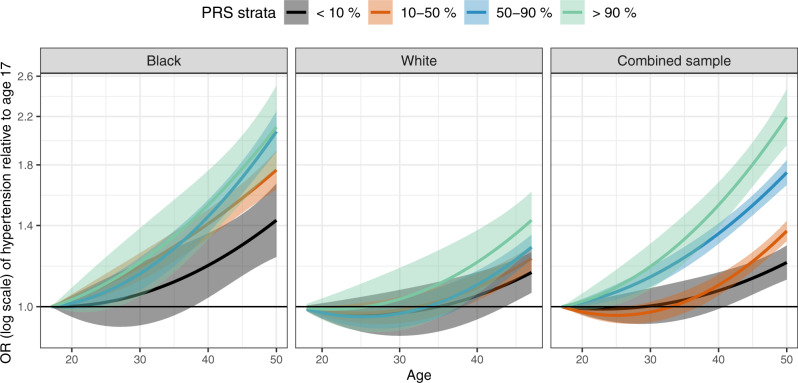
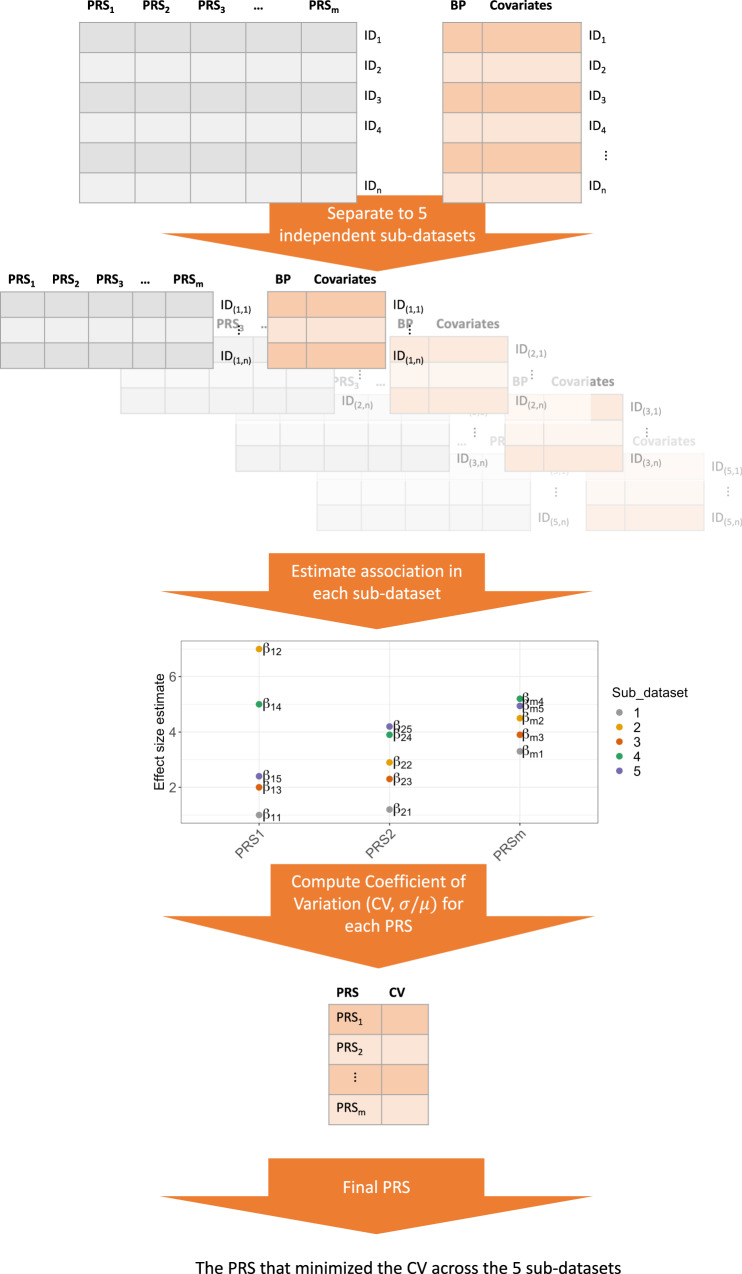
In a multi-stage analysis of 52,436 individuals aged 17-90 across diverse cohorts and biobanks, we train, test, and evaluate a polygenic risk score (PRS) for hypertension risk and progression. The PRS is trained using genome-wide association studies (GWAS) for systolic, diastolic blood pressure, and hypertension, respectively. For each trait, PRS is selected by optimizing the coefficient of variation (CV) across estimated effect sizes from multiple potential PRS using the same GWAS, after which the 3 trait-specific PRSs are combined via an unweighted sum called "PRSsum", forming the HTN-PRS. The HTN-PRS is associated with both prevalent and incident hypertension at 4-6 years of follow up. This association is further confirmed in age-stratified analysis. In an independent biobank of 40,201 individuals, the HTN-PRS is confirmed to be predictive of increased risk for coronary artery disease, ischemic stroke, type 2 diabetes, and chronic kidney disease.
© 2022. The Author(s).
Conflict of interest statement
B.M.P. serves on the Steering Committee of the Yale Open Data Access Project funded by Johnson & Johnson. All other co-authors declare no competing interests.
Figures
Similar articles
-
Polygenic risk score identifies associations between sleep duration and diseases determined from an electronic medical record biobank.Sleep. 2019 Mar 1;42(3):zsy247. doi: 10.1093/sleep/zsy247. Sleep. 2019. PMID: 30521049 Free PMC article.
-
Evaluating the use of blood pressure polygenic risk scores across race/ethnic background groups.Nat Commun. 2023 Jun 2;14(1):3202. doi: 10.1038/s41467-023-38990-9. Nat Commun. 2023. PMID: 37268629 Free PMC article.
-
Polygenic risk scores for cardiometabolic traits demonstrate importance of ancestry for predictive precision medicine.Pac Symp Biocomput. 2024;29:611-626. Pac Symp Biocomput. 2024. PMID: 38160310 Free PMC article.
-
Polygenic Risk Score in African populations: progress and challenges.F1000Res. 2023 Apr 11;11:175. doi: 10.12688/f1000research.76218.2. eCollection 2022. F1000Res. 2023. PMID: 37273966 Free PMC article. Review.
-
Perspectives on genetic studies of type 2 diabetes from the genome-wide association studies era to precision medicine.J Diabetes Investig. 2024 Apr;15(4):410-422. doi: 10.1111/jdi.14149. Epub 2024 Jan 23. J Diabetes Investig. 2024. PMID: 38259175 Free PMC article. Review.
Cited by
-
Multi-Omics Studies in Historically Excluded Populations: The Road to Equity.Clin Pharmacol Ther. 2023 Mar;113(3):541-556. doi: 10.1002/cpt.2818. Epub 2023 Jan 16. Clin Pharmacol Ther. 2023. PMID: 36495075 Free PMC article. Review.
-
A polygenic risk score for Alzheimer's disease constructed using APOE-region variants has stronger association than APOE alleles with mild cognitive impairment in Hispanic/Latino adults in the U.S.Alzheimers Res Ther. 2023 Aug 30;15(1):146. doi: 10.1186/s13195-023-01298-3. Alzheimers Res Ther. 2023. PMID: 37649099 Free PMC article.
-
Polygenic risk scores associate with blood pressure traits across the lifespan.Eur J Prev Cardiol. 2024 Apr 18;31(6):644-654. doi: 10.1093/eurjpc/zwad365. Eur J Prev Cardiol. 2024. PMID: 38007706 Free PMC article.
-
Genetic determinants of obesity in Korean populations: exploring genome-wide associations and polygenic risk scores.Brief Bioinform. 2024 Jul 25;25(5):bbae389. doi: 10.1093/bib/bbae389. Brief Bioinform. 2024. PMID: 39207728 Free PMC article.
-
Genetic contribution to disease-course severity and progression in the SUPER-Finland study, a cohort of 10,403 individuals with psychotic disorders.Mol Psychiatry. 2024 Sep;29(9):2733-2741. doi: 10.1038/s41380-024-02516-6. Epub 2024 Apr 1. Mol Psychiatry. 2024. PMID: 38556557 Free PMC article.
References
-
- Graham I, et al. European guidelines on cardiovascular disease prevention in clinical practice: executive summary. Fourth Joint Task Force of the European Society of Cardiology and other societies on cardiovascular disease prevention in clinical practice (constituted by representatives of nine societies and by invited experts) Eur. J. Cardiovasc Prev. Rehabil. 2007;14:E1–E40. doi: 10.1097/01.hjr.0000277984.31558.c4. - DOI - PubMed
-
- Lim SS, et al. A comparative risk assessment of burden of disease and injury attributable to 67 risk factors and risk factor clusters in 21 regions, 1990-2010: a systematic analysis for the Global Burden of Disease Study 2010. Lancet. 2012;380:2224–2260. doi: 10.1016/S0140-6736(12)61766-8. - DOI - PMC - PubMed
