. 2022 Jun 21;9(1):354.
doi: 10.1038/s41597-022-01462-8.

Presenting the Compendium Isotoporum Medii Aevi, a Multi-Isotope Database for Medieval Europe

Affiliations

Presenting the Compendium Isotoporum Medii Aevi, a Multi-Isotope Database for Medieval Europe

Carlo Cocozza et al. Sci Data. .

Abstract

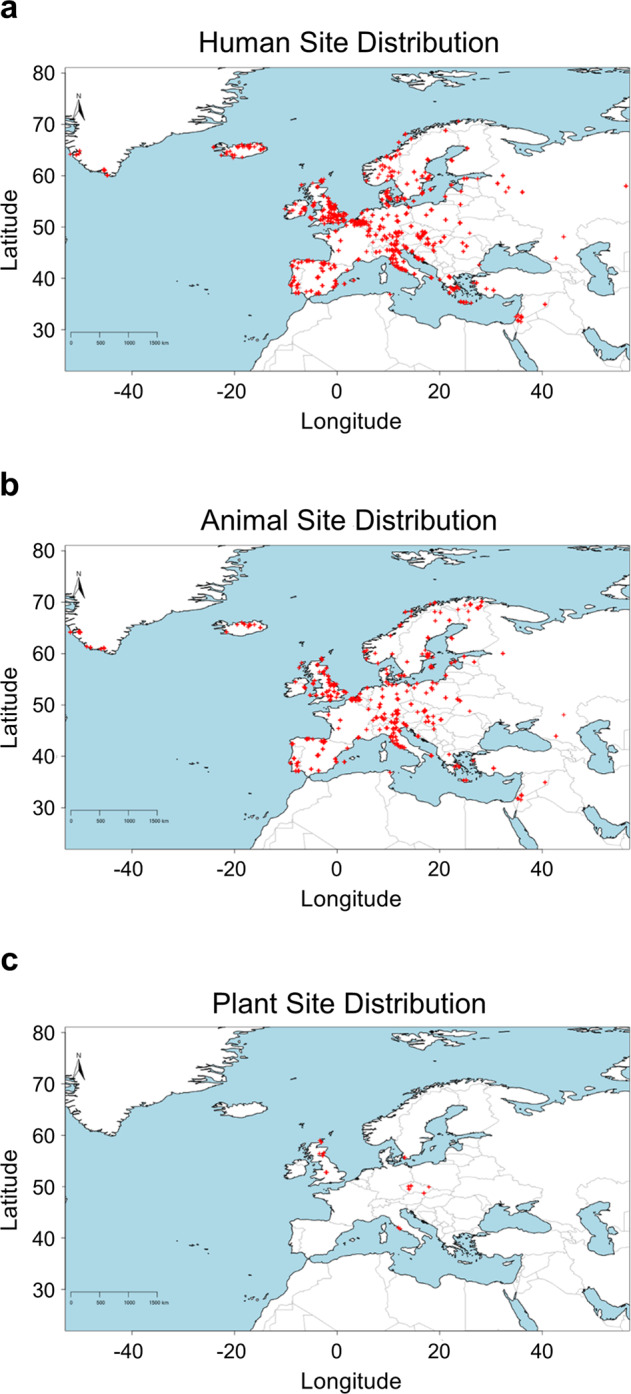
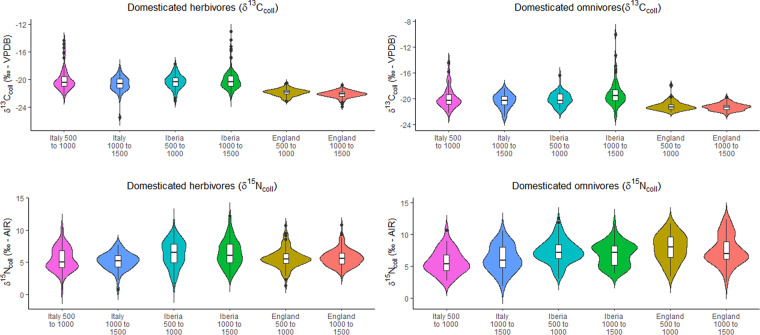
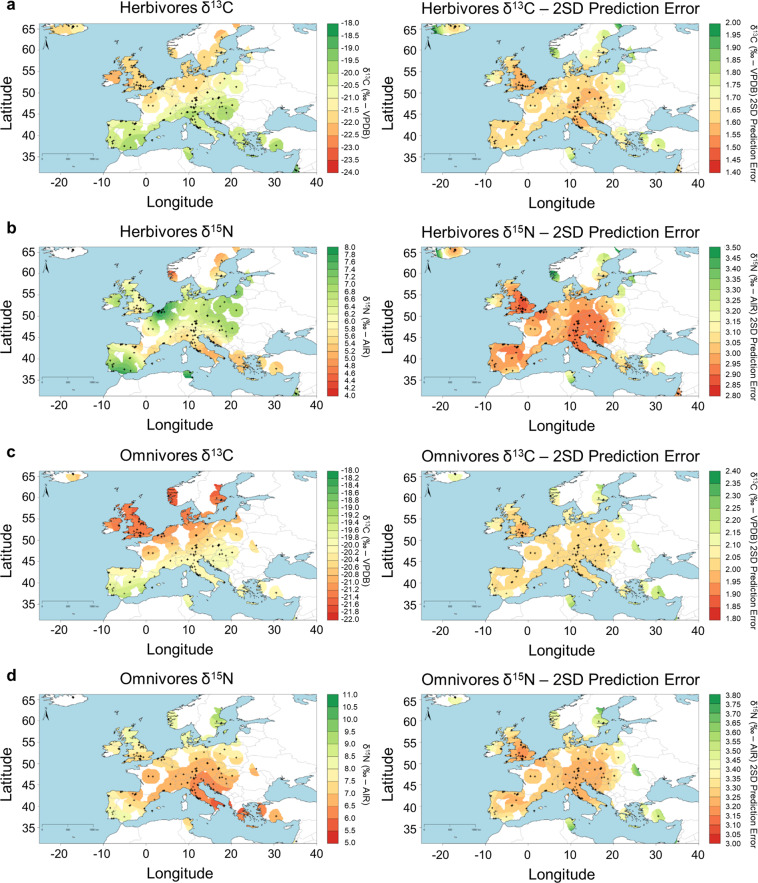
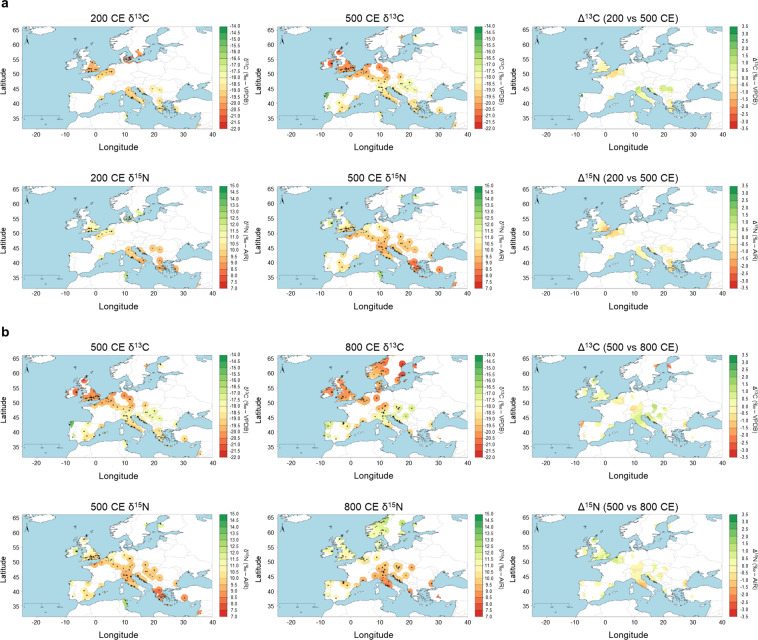
Here we present the Compendium Isotoporum Medii Aevi (CIMA), an open-access database gathering more than 50,000 isotopic measurements for bioarchaeological samples located within Europe and its margins, and dating between 500 and 1500 CE. This multi-isotope (δ13C, δ15N, δ34S, δ18O, and 87Sr/86Sr) archive of measurements on human, animal, and plant archaeological remains also includes a variety of supporting information that offer, for instance, a taxonomic characterization of the samples, their location, and chronology, in addition to data on social, religious, and political contexts. Such a dataset can be used to identify data gaps for future research and to address multiple research questions, including those related with studies on medieval human lifeways (i.e. human subsistence, spatial mobility), characterization of paleo-environmental and -climatic conditions, and on plant and animal agricultural management practices. Brief examples of such applications are given here and we also discuss how the integration of large volumes of isotopic data with other types of archaeological and historical data can improve our knowledge of medieval Europe.


Conflict of interest statement

The authors declare no competing interests.

Figures

Fig. 1
Fig. 1
Spatial distribution of human (a), animal (b), and plant (c) site locations for data compiled within CIMA.
Fig. 2
Fig. 2
Violin plots showing a temporal comparison of δ13C and δ15N bone collagen values from domesticated herbivores and omnivores in Italy, Iberia, and England.
Fig. 3
Fig. 3
Spatial comparison of predicted δ13C and δ15N mean and associated errors (double the square root of the sum of the standard error plus the square of the population standard deviation) for domesticated animals. (a) δ13C herbivores; (b) δ15N herbivores; (c) δ13C omnivores; (d) δ15N omnivores.
Fig. 4
Fig. 4
(a) Bayesian spatial estimates of δ13C and δ15N mean values for human bone collagen in 200 CE (left column) and 500 CE (middle column) and mapping of differences in isotopic values (Δ13C and Δ15N, right column). (b) Bayesian spatial estimates of δ13C and δ15N mean values for human bone collagen in 500 CE (left column) and 800 CE (middle column) and Bayesian mapping of differences in isotopic values (Δ13C and Δ15N, right column).
Fig. 5
Fig. 5
Temporal Bayesian plots for adult bone collagen δ13C and δ15N values for Rome. (a) both sexes δ13C and δ15N; (b) female versus male δ13C and δ15N.
Fig. 6
Fig. 6
200 CE (a), 500 CE (b), and 800 CE (c) dietary estimated models of main food sources caloric contribution for the city of Rome without (left) and with (right) added prior dietary information (d). Black circles within plots correspond to modern dietary estimates. See also Supplementary Information Files S4–S6 for modeling details.
Fig. 7
Fig. 7
Distribution of δ34S, δ15N, and δ13C measurements on bone collagen included in CIMA from terrestrial herbivores, freshwater fish, and marine fish that passed elemental quality criteria (atomic ratios of C:N, C:S, and N:S).
Fig. 8
Fig. 8
Kernel density plots for human osteological samples from London and York. Heights reflect relative temporal abundance of samples with δ13C and δ15N measurements (a -yellow and green plots), of 87Sr/86Sr or δ18O measurements (white plots), and of mobile (blue plots) and non-mobile (red plots) individuals.
Fig. 9
Fig. 9
Probability density maps for place of origin for individuals REP-295, REP-511, REP-529 and SK27.

References

    1. Backman, C. R. The worlds of medieval Europe. (Oxford University Press, 2003).
    1. Brown, P. The World of Late Antiquity. From Marcus Aurelius to Muhammad. (Thames & Hudson, 1971).
    1. Brown, P. The Making of Late Antiquity. (Harvard University Press, 1978).
    1. Holmes, G. The Oxford History of Medieval Europe. (Oxford University Press, 2002).
    1. Hoffmann, R. C. An environmental history of medieval Europe. (Cambridge University Press, 2014).