. 2022 Jun 21;13(1):3545.
doi: 10.1038/s41467-022-31317-0.

MicroRNA-21 promotes pancreatic β cell function through modulating glucose uptake

Affiliations

MicroRNA-21 promotes pancreatic β cell function through modulating glucose uptake

Ruiling Liu et al. Nat Commun. .

Abstract

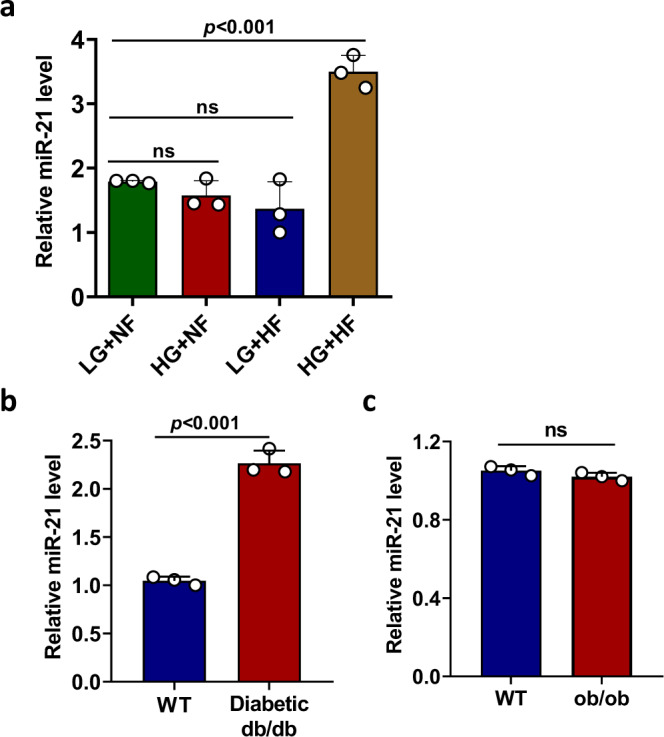
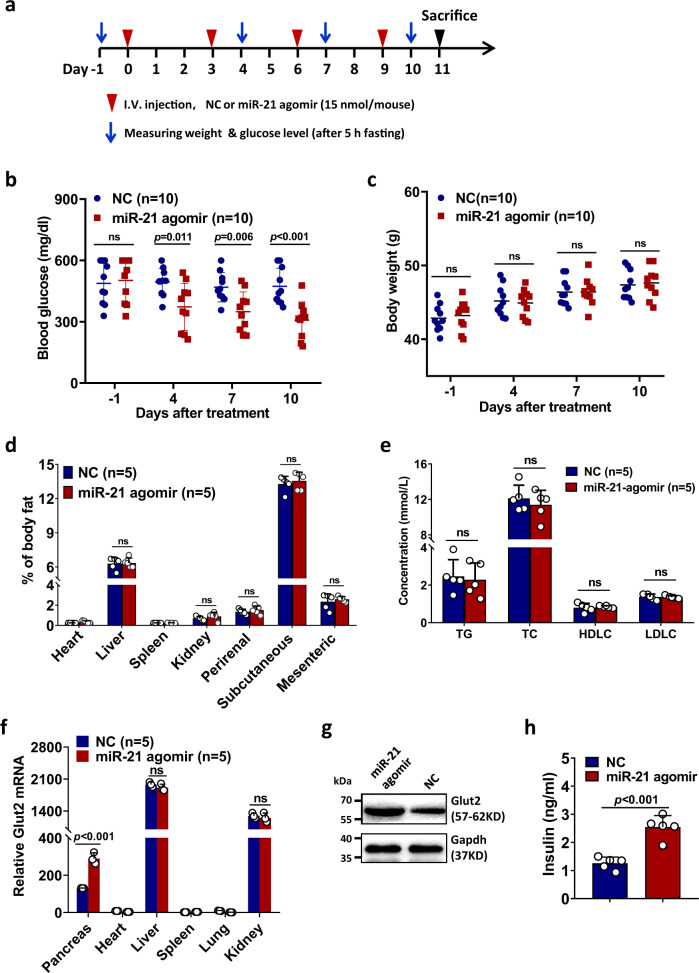
Pancreatic β cell dysfunction contributes to the pathogenesis of type 2 diabetes. MiR-21 has been shown to be induced in the islets of glucose intolerant patients and type 2 diabetic mice. However, the role of miR-21 in the regulation of pancreatic β cell function remains largely elusive. In the current study, we identify the pathway by which miR-21 regulates glucose-stimulated insulin secretion utilizing mice lacking miR-21 in their β cells (miR-21βKO). We find that miR-21βKO mice develop glucose intolerance due to impaired glucose-stimulated insulin secretion. Mechanistic studies reveal that miR-21 enhances glucose uptake and subsequently promotes insulin secretion by up-regulating Glut2 expression in a miR-21-Pdcd4-AP-1 dependent pathway. Over-expression of Glut2 in knockout islets results in rescue of the impaired glucose-stimulated insulin secretion. Furthermore, we demonstrate that delivery of miR-21 into the pancreas of type 2 diabetic db/db male mice is able to promote Glut2 expression and reduce blood glucose level. Taking together, our results reveal that miR-21 in islet β cell promotes insulin secretion and support a role for miR-21 in the regulation of pancreatic β cell function in type 2 diabetes.


Conflict of interest statement

The authors declare no competing interest.

Figures

Fig. 1
Fig. 1. Combined high glucose and high fat up-regulates islet miR-21 expression.
a Pancreatic islets were isolated from 8-week-old male C57BL/6 mice and treated with or without high glucose and high fat as indicated in the figure. After incubating for 24 h at 37 °C, total RNA was extracted and relative miR-21 expression level was determined by quantitative RT-PCR. Data are presented as means ± SD for n = 3 biologically independent samples. Statistical significance was analyzed using one-way ANOVA with Bonferroni correction. P values are indicated in the figures. ns not significant. LG low glucose (5.5 mM), HG high glucose (25 mM), NF no fat, HF high fat (0.4 mM sodium palmitate). b Pancreatic islets were isolated from 6-week-old male diabetic db/db mice and control BKS mice (n = 3). Total RNA was extracted and relative miR-21 expression level was determined by quantitative RT-PCR. Data are presented as means ± SD for n = 3 biologically independent samples. c Pancreatic islets were isolated from 20-week-old male ob/ob mice and control C57BL/6 mice (n = 3). Relative miR-21 expression level was determined as in (b). Data are presented as means ± SD for n = 3 biologically independent samples. For (b) and (c), statistical significance was analyzed using two-sided unpaired t test and P values are indicated in the figure. ns not significant. All data shown are representative of three independent experiments. Source data are provided as a Source Data file.
Fig. 2
Fig. 2. Mice with pancreatic β cell specific deletion of miR-21 display impaired blood glucose tolerance and insulin secretion.
a Pancreatic islets from 8-week-old WT and conventional miR-21KO mice (n = 3) were treated with 2.8 mM or 16.7 mM glucose. Insulin level in the culture supernatant was determined by ELISA. Data are presented as means ± SD for n = 3 biologically independent samples. b 3-, 7-, 10- and 27-week old wild type (WT) and conditional miR-21βKO mice were fasted for 4 h before treated with 2 g/kg body weight d-glucose. Blood glucose level was measured at the indicated time-points. Data are presented as means ± SD for multiple biologically independent mice (as indicated in the figure). Statistical significance was analyzed using two-way ANOVA and P values are indicated in the figure. c 7-week-old WT and miR-21βKO mice (n = 3) were treated as in (b) for 30 min. Serum was obtained from tail vein and insulin level was measured. Data are presented as means ± SD for n = 3 biologically independent samples. df Pancreatic islets from 7—8-week old WT and miR-21βKO mice (n = 3) were treated with 2.8 mM and 16.7 mM glucose. Insulin level in the supernatant was measured (d). Alternatively, total islet insulin content (e) and fractional insulin release (f) from islets treated with 2.8 mM and 16.7 mM glucose were determined by ELISA. Data are presented as means ± SD for n = 3 biologically independent samples. All statistical significance analysis except (b) was performed using two-sided unpaired t test and P values are indicated in the figure. All panels except (b) are representative of at least two independent experiments. Equal numbers of male and female mice were used in two genotypes. ns: not significant. Source data are provided as a Source Data file.
Fig. 3
Fig. 3. Transcriptomic analysis of islets from WT and miR-21βKO mice.
a Venn diagram displaying the number of statistically significant altered genes in the islets from miR-21βKO mice (n = 6). b A volcano plot of differentially expressed genes. The vertical lines represent 1.5-fold increased and decreased expression. The horizontal line shows P = 0.05. Blue and red dots indicate genes with statistically significant differential expression. c, d Representative biological processes up-regulated (c) and down-regulated (d) in the islets from miR-21βKO mice were characterized using GO enrichment analysis. e, f Representative genes up-regulated (e) and down-regulated (f) were illustrated using heatmap. Each column represents data from pooled islets of two mice. Equal numbers of male and female mice were used in two genotypes. Source data are provided as a Source Data file.
Fig. 4
Fig. 4. Islets from miR-21βKO mice exhibit impaired glucose uptake.
a Pancreatic islets isolated from 7–8-week-old WT and miR-21βKO mice (n = 4) were treated with indicated concentrations of glucose and KCl. Insulin level in the culture supernatant was determined by ELISA. Data are presented as means ± SD for n = 4 biologically independent samples. b Pancreatic islets isolated from 7–8-week-old WT and miR-21βKO mice (n = 3) were treated with indicated concentrations of glucose. Islets were then lysed and G6P level in the lysate was determined using G6P Assay Kit with WST-8. Data are presented as means ± SD for n = 3 biologically independent samples. c Oxygen consumption rate (OCR) of islets from 7–8-week-old WT and miR-21βKO mice (n = 3) was assessed as described in the Methods section. Data are presented as means ± SD for n = 3 biologically independent samples. Statistical significance was analyzed using two-way ANOVA with Bonferroni correction. P values are indicated in the figure. d Pancreatic islets from WT or miR-21βKO mice (n = 3) were cultured at 37 °C for 10 min in the presence or absence of 150 μg/ml NBD-glucose (2-NBDG). Glucose uptake was determined by calculating the mean fluorescence intensity (MFI) of 2-NBDG using flow cytometry. All statistical significance analysis except (c) was performed using two-sided unpaired t test and P values are indicated in the figure. ns not significant. Data shown are representative of at least two independent experiments. Equal numbers of male and female mice were used in two genotypes. Source data are provided as a Source Data file.
Fig. 5
Fig. 5. miR-21 improves insulin secretion through up-regulating Glut2 expression.
a Pancreatic islets were isolated from 7–8-week-old WT and miR-21βKO mice (n = 3). Total RNA was extracted and relative mRNA expression levels of indicated Gluts were determined by quantitative RT-PCR. b Pancreatic islets were isolated as in (a) and islet β cells were further purified by flow cytometry. Glut2 mRNA expression was then determined by quantitative RT-PCR. For both (a) and (b), data are presented as means ± SD for n = 3 biologically independent samples. c Representative images of pancreatic tissue sections from 7–8-week-old WT and miR-21βKO mice (n = 3) incubated with antibody against Glut2. Scale bar: 20 μm. d Pancreatic tissues were treated as in (c) and mean optical density (MOD) of Glut2 was calculated. Data shown are results combined from 31 islets (WT) or 21 islets (miR-21βKO) and presented using box and whisker plot. The line within the box represents the median value. The bottom line of the box represents the 1st quartile. The top line of the box represents the 3rd quartile. The whiskers extend from the ends of the box to the minimum value and maximum value. e Pancreatic islets were isolated from 7–8-week-old WT and miR-21βKO (n = 3) mice, and Glut2 expression was analyzed by western blotting. f Representative images of islets from 7–8-week-old WT and miR-21βKO mice (n = 3) infected with adenovirus expressing negative control (GFP) or murine Glut2 (Glut2). g Glut2 mRNA expression in the islets from 7–8-week-old WT and miR-21βKO mice (n = 3) was determined by quantitative RT-PCR. Data are presented as means ± SD for n = 3 biologically independent samples. h Adenovirally infected islets from 7–8-week-old WT and miR-21βKO mice (n = 4) were treated with glucose and insulin level in the culture supernatant was determined by ELISA. Data are presented as means ± SD for n = 4 biologically independent samples. All statistical significance was analyzed using two-sided unpaired t test and P values are indicated in the figure. ns not significant. Results are representative of at least two independent experiments. Equal numbers of male and female mice were used in two genotypes. Source data are provided as a Source Data file.
Fig. 6
Fig. 6. miR-21 promotes Glut2 expression through miR-21-Pdcd4-AP-1 pathway.
a Pancreatic islets were isolated from 7–8-week-old WT and miR-21βKO mice (n = 3). Pdcd4 mRNA expression was determined by quantitative RT-PCR. Data are presented as means ± SD for n = 3 biologically independent samples. b, c Pancreatic islets were isolated from 7–8-week-old WT or miR-21βKO mice (n = 3) and protein expression of Pdcd4 (b) and c-Jun (c) were determined by western blotting. d, e β–TC-6 cells were transfected with either universal negative control siRNA duplex (NC) or siRNA duplex targeting mouse Pdcd4 (siPdcd4). Protein levels of Pdcd4 (d) and Glut2 (e) were examined by western blotting. f β–TC-6 cells were transiently transfected with mouse Glut2 promoter luciferase reporter together with c-Jun expression vector (pRK5-c-Jun) or empty vector (pRK5). The luciferase activities of total cell lysates were measured using the Dual-Luciferase Reporter Assay system. Co-transfection of the Renilla luciferase expression vector pRL-TK was used as an internal control. g β-TC-6 cells were transfected with c-Jun expression vector (pRK5-c-Jun) or empty vector (pRK5). Alternatively, β-TC-6 cells were treated with DMSO or AP-1 inhibitor T-5224. Glut2 mRNA was determined by quantitative RT-PCR. For both (f) and (g), data are presented as means ± SD for n = 3 biologically independent samples. h β-TC-6 cells were transfected with c-Jun expression vector (pRK5-c-Jun) or empty vector (pRK5). Glut2 protein level was determined by western blotting. i Pancreatic islets were treated with DMSO or AP-1 inhibitor T-5524 and Glut2 protein level was determined by western blotting. j Schematic illustration of how miR-21 promotes Glut2 expression in islet β cells. All statistical significance was analyzed using two-sided unpaired t test and P values are indicated in the figure. All results are representative of at least two independent experiments. Equal numbers of male and female mice were used in two genotypes. Source data are provided as a Source Data file.
Fig. 7
Fig. 7. Increased expression of miR-21 in pancreatic islets promotes Glut2 expression and glucose-stimulated insulin secretion.
a, b Pancreatic islets were isolated from 7–8-week-old C57BL/6 male mice and infected with negative control virus (NC) or adenovirus over-expressing miR-21 (miR-21). Relative expression levels of miR-21 and Glut2 were determined by quantitative RT-PCR (a). Alternatively, virus infected islets were treated with 16.7 mM glucose and insulin level in the culture supernatant was determined by ELISA (b). Data are presented as means ± SD for n = 3 biologically independent samples. c, d Pancreatic islets were isolated from healthy donor and infected with negative control virus (NC) or adenovirus over-expressing miR-21 (miR-21). Expression of human miR-21 and Glut2 (c) and the level of glucose-stimulated secretion of insulin (d) were determined by quantitative RT-PCR and human insulin ELISA. Data are presented as means ± SD for n = 3 biologically independent samples. e, f Pancreatic islets were isolated from 7–8-week-old C57BL/6 male mice and infected with negative control virus (NC) or adenovirus over-expressing miR-21 under the control of mouse insulin promoter (Ins-miR-21). Expression of miR-21 and Glut2 (e) and the level of glucose-stimulated secretion of insulin (f) were determined by ELISA. Data are presented as means ± SD for n = 3 biologically independent samples. All statistical significance was analyzed using two-sided unpaired t test and P values are indicated in the figure. ns not significant. Data shown are representative results from at least two independent experiments. Source data are provided as a Source Data file.
Fig. 8
Fig. 8. Delivery of miR-21 into the pancreas of type 2 diabetic db/db mice reduces blood glucose level.
a Schematic illustration of the strategy used to treat db/db male mice with negative control agomir (NC) or miR-21 agomir. b, c 6-week-old db/db male mice were treated as in (a) (10 mice in each group). 5-hour fasting blood glucose level (b) and body weight (c) were monitored at day −1, 4, 7, and 10. The center line indicates the mean value. d-h 6-week-old male db/db mice were treated as in (a) (5 mice in each group) and sacrificed on day 11 and the percent of body fat of the indicated tissues (d), as well as the levels of TG, TC, HDLC and LDLC in the serum (e) were measured. Glut2 mRNA level was determined by quantitative RT-PCR (f). Data are presented as means ± SD for n = 5 biologically independent samples. Alternatively, Pancreatic islets from each group were isolated, mixed and the protein level of Glut2 was detected by western blotting. g Insulin concentration in the serum was determined by ELISA (h). All statistical significance was analyzed using two-sided unpaired t test and P values are indicated in the figures. ns not significant. TG triglycerides, TC total cholesterol, HDLC high-density lipoprotein cholesterol, LDLC low-density lipoprotein cholesterol. Results in (b) and (c) were combined from two independent experiments. All other panels are representative results from two independent experiments. Source data are provided as a Source Data file.

References

    1. Galicia-Garcia, U. et al. Pathophysiology of type 2 diabetes mellitus. Int. J. Mol. Sci.21, 6275 (2020). - PMC - PubMed
    1. Chakraborty C, Doss CG, Bandyopadhyay S, Agoramoorthy G. Influence of miRNA in insulin signaling pathway and insulin resistance: micro-molecules with a major role in type-2 diabetes. Wiley Interdiscip. Rev. RNA. 2014;5:697–712. doi: 10.1002/wrna.1240. - DOI - PubMed
    1. Vishnoi A, Rani S. MiRNA biogenesis and regulation of diseases: an overview. Methods Mol. Biol. (Clifton, NJ) 2017;1509:1–10. doi: 10.1007/978-1-4939-6524-3_1. - DOI - PubMed
    1. Poy MN, et al. A pancreatic islet-specific microRNA regulates insulin secretion. Nature. 2004;432:226–230. doi: 10.1038/nature03076. - DOI - PubMed
    1. Chen H, Lan HY, Roukos DH, Cho WC. Application of microRNAs in diabetes mellitus. J. Endocrinol. 2014;222:R1–R10. doi: 10.1530/JOE-13-0544. - DOI - PubMed

Publication types

MeSH terms