

Cochlea to categories: The spatiotemporal dynamics of semantic auditory representations
- PMID: 35729704
- PMCID: PMC10589059
- DOI: 10.1080/02643294.2022.2085085
Cochlea to categories: The spatiotemporal dynamics of semantic auditory representations
Abstract
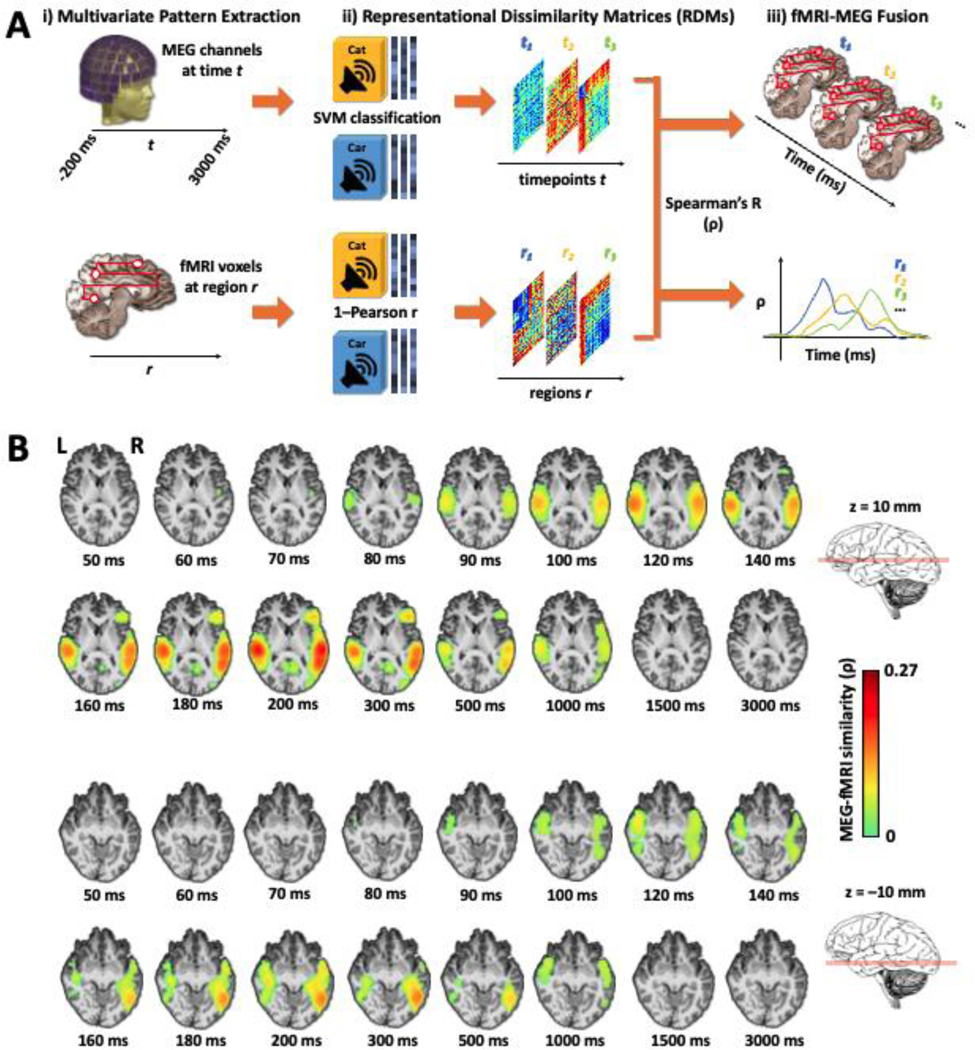
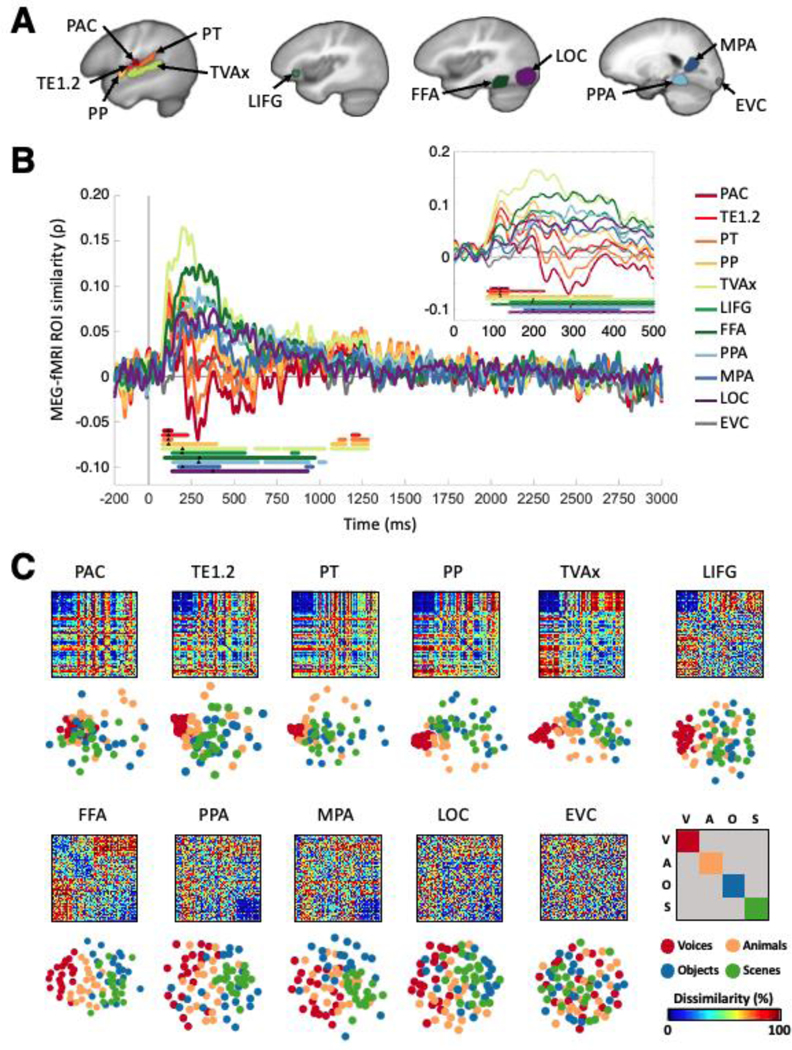
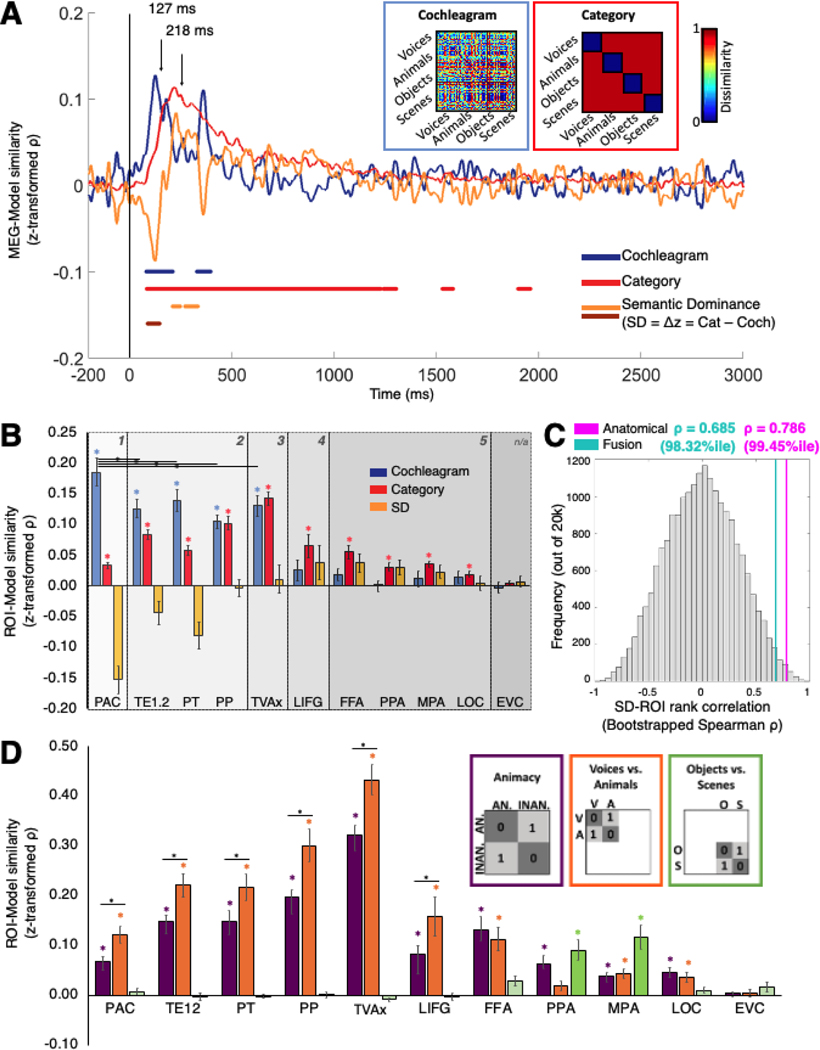
How does the auditory system categorize natural sounds? Here we apply multimodal neuroimaging to illustrate the progression from acoustic to semantically dominated representations. Combining magnetoencephalographic (MEG) and functional magnetic resonance imaging (fMRI) scans of observers listening to naturalistic sounds, we found superior temporal responses beginning ∼55 ms post-stimulus onset, spreading to extratemporal cortices by ∼100 ms. Early regions were distinguished less by onset/peak latency than by functional properties and overall temporal response profiles. Early acoustically-dominated representations trended systematically toward category dominance over time (after ∼200 ms) and space (beyond primary cortex). Semantic category representation was spatially specific: Vocalizations were preferentially distinguished in frontotemporal voice-selective regions and the fusiform; scenes and objects were distinguished in parahippocampal and medial place areas. Our results are consistent with real-world events coded via an extended auditory processing hierarchy, in which acoustic representations rapidly enter multiple streams specialized by category, including areas typically considered visual cortex.
Keywords: Audition; functional magnetic resonance imaging; magnetoencephalography; naturalistic sounds; representational similarity analysis.
Figures
Similar articles
-
Acoustic and higher-level representations of naturalistic auditory scenes in human auditory and frontal cortex.Neuroimage. 2018 Jun;173:472-483. doi: 10.1016/j.neuroimage.2018.02.065. Epub 2018 Mar 6. Neuroimage. 2018. PMID: 29518569
-
The co-occurrence of multisensory facilitation and cross-modal conflict in the human brain.J Neurophysiol. 2011 Dec;106(6):2896-909. doi: 10.1152/jn.00303.2011. Epub 2011 Aug 31. J Neurophysiol. 2011. PMID: 21880944
-
Intermediate acoustic-to-semantic representations link behavioral and neural responses to natural sounds.Nat Neurosci. 2023 Apr;26(4):664-672. doi: 10.1038/s41593-023-01285-9. Epub 2023 Mar 16. Nat Neurosci. 2023. PMID: 36928634 Free PMC article.
-
Stimulus-dependent activations and attention-related modulations in the auditory cortex: a meta-analysis of fMRI studies.Hear Res. 2014 Jan;307:29-41. doi: 10.1016/j.heares.2013.08.001. Epub 2013 Aug 11. Hear Res. 2014. PMID: 23938208 Review.
-
Resolving the neural dynamics of visual and auditory scene processing in the human brain: a methodological approach.Philos Trans R Soc Lond B Biol Sci. 2017 Feb 19;372(1714):20160108. doi: 10.1098/rstb.2016.0108. Epub 2017 Jan 2. Philos Trans R Soc Lond B Biol Sci. 2017. PMID: 28044019 Free PMC article. Review.
Cited by
-
The transformation of sensory to perceptual braille letter representations in the visually deprived brain.Elife. 2024 Dec 4;13:RP98148. doi: 10.7554/eLife.98148. Elife. 2024. PMID: 39630852 Free PMC article.
-
Neural processing of naturalistic audiovisual events in space and time.Commun Biol. 2025 Jan 22;8(1):110. doi: 10.1038/s42003-024-07434-5. Commun Biol. 2025. PMID: 39843939 Free PMC article.
-
Touch to text: Spatiotemporal evolution of braille letter representations in blind readers.bioRxiv [Preprint]. 2024 Oct 31:2024.10.30.620429. doi: 10.1101/2024.10.30.620429. bioRxiv. 2024. PMID: 39553970 Free PMC article. Preprint.
-
Sensory and Perceptual Decisional Processes Underlying the Perception of Reverberant Auditory Environments.eNeuro. 2024 Aug 20;11(8):ENEURO.0122-24.2024. doi: 10.1523/ENEURO.0122-24.2024. Print 2024 Aug. eNeuro. 2024. PMID: 39122554 Free PMC article.
-
Decoding the Spatiotemporal Dynamics of Neural Response Similarity in Auditory Processing: A Multivariate Analysis Based on OPM-MEG.Hum Brain Mapp. 2025 Mar;46(4):e70175. doi: 10.1002/hbm.70175. Hum Brain Mapp. 2025. PMID: 40016919 Free PMC article.
References
-
- Ahveninen J, Jaaskelainen IP, Raij T, Bonmassar G, Devore S, Hamalainen M, Levanen S, Lin F-H, Sams M, Shinn-Cunningham BG, Witzel T, Belliveau JW (2006) Task-modulated “what” and “where” pathways in human auditory cortex. Proceedings of the National Academy of Sciences 103:14608–14613 Available at: 10.1073/pnas.0510480103. - DOI - PMC - PubMed
-
- Belin P, Zatorre RJ, Lafaille P, Ahad P, Pike B (2000) Voice-selective areas in human auditory cortex. Nature 403:309–312. - PubMed
Publication types
MeSH terms
Grants and funding
LinkOut - more resources
Full Text Sources