

Biomarkers of caspofungin resistance in Candida albicans isolates: A proteomic approach
- PMID: 35730400
- PMCID: PMC9225221
- DOI: 10.1080/21505594.2022.2081291
Biomarkers of caspofungin resistance in Candida albicans isolates: A proteomic approach
Abstract
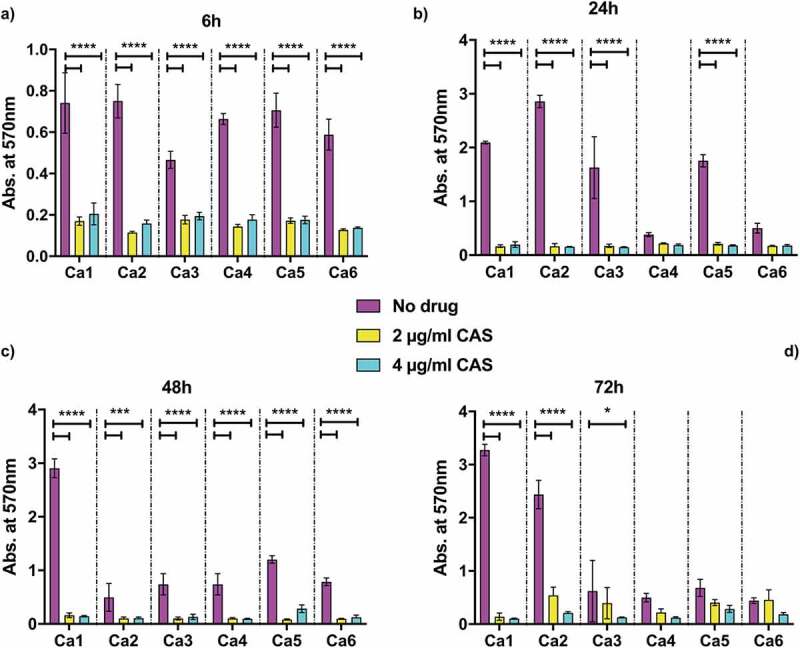
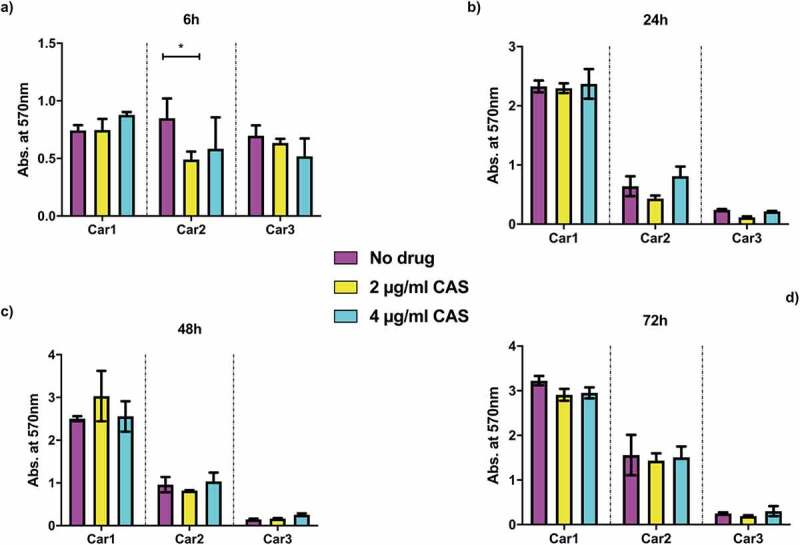
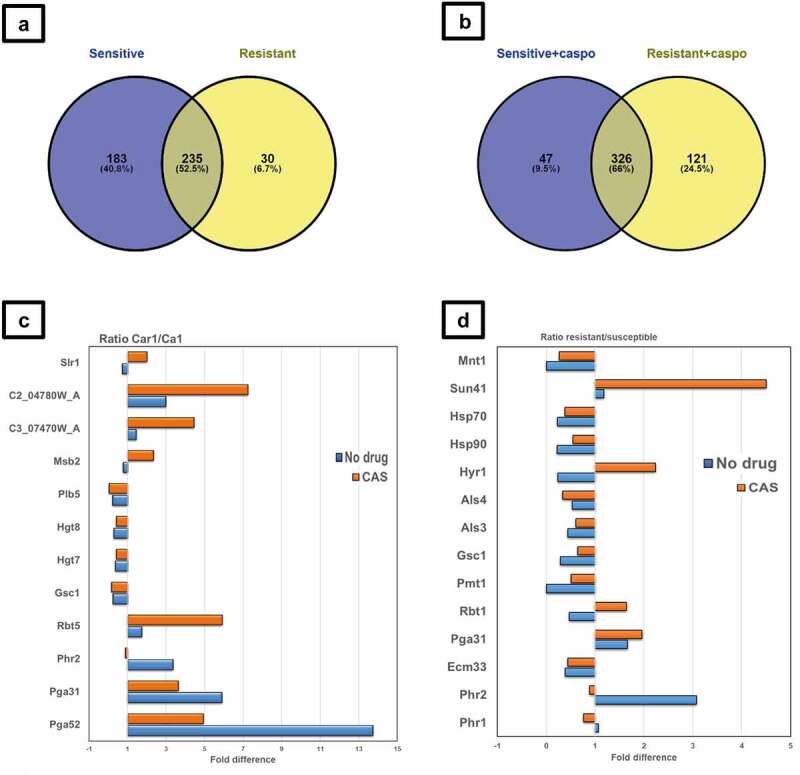
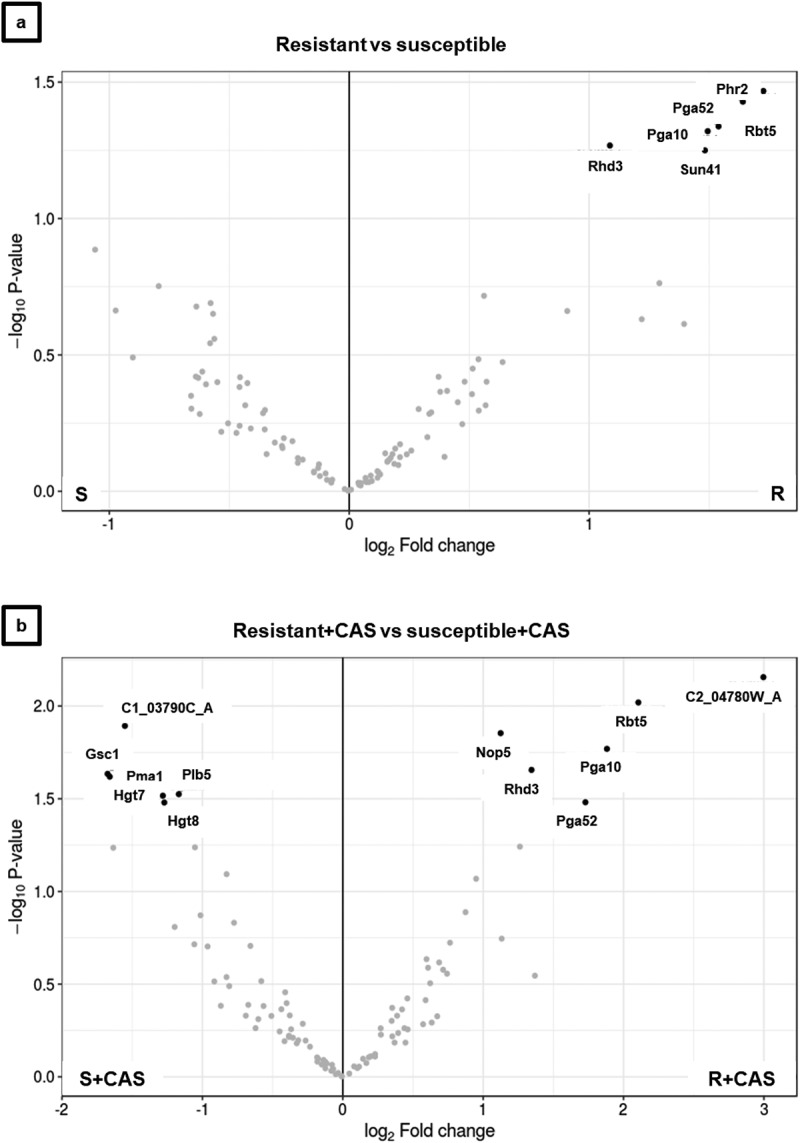
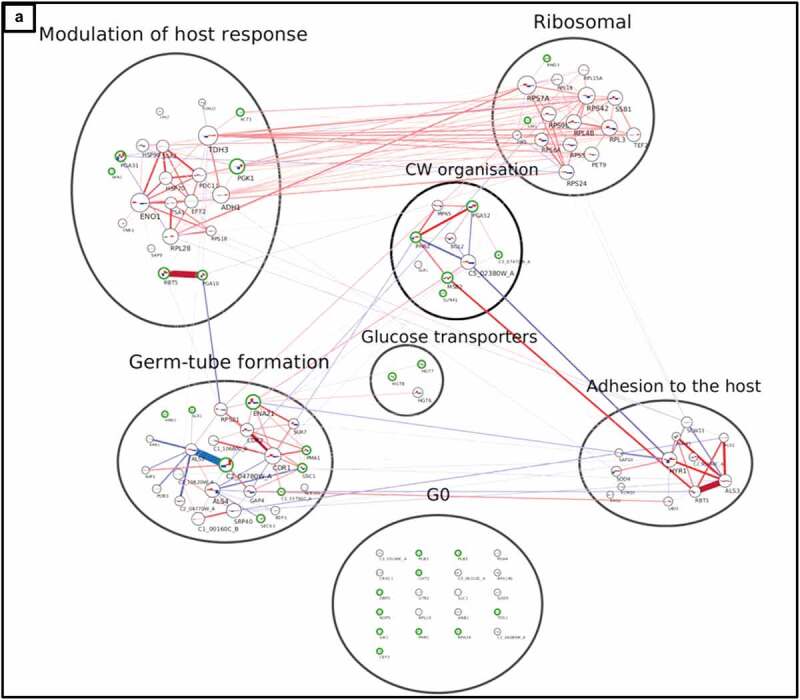
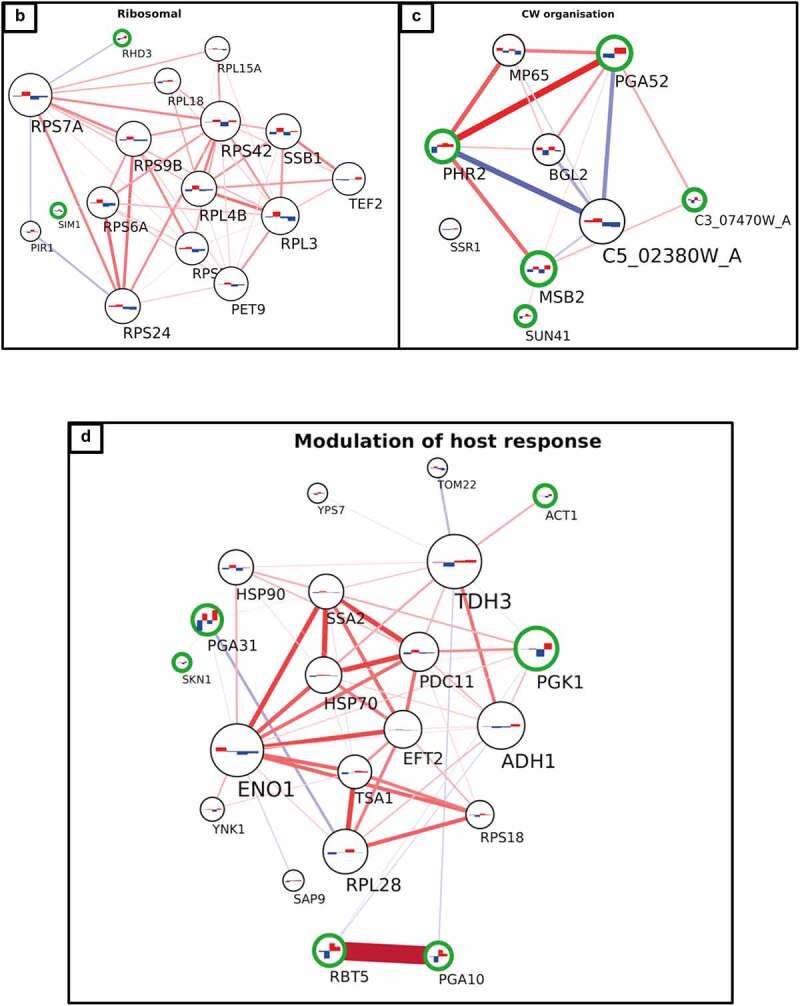
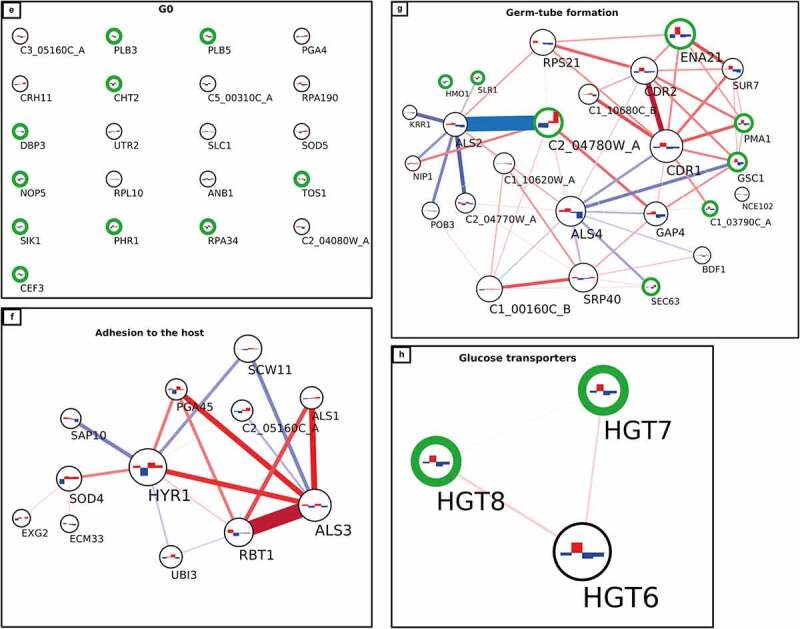
Candida albicans is a clinically important polymorphic fungal pathogen that causes life-threatening invasive infections in immunocompromised patients. Antifungal therapy failure is a substantial clinical problem, due to the emergence of an increasing number of drug-resistant isolates. Caspofungin is a common antifungal drug, often used as first-line therapy that inhibits cell wall β-(1,3)-glucan synthesis. In this work, the cell surface of different echinocandin-resistant C. albicans clinical isolates was compared with sensitive isolates and their responses to echinocandin treatment analyzed. Proteomic analysis detected changes in the repertoire of proteins involved in cell wall organization and maintenance, in drug-resistant strains compared to susceptible isolates and after incubation with caspofungin. Moreover, an interaction network was created from the differential expression results. Our findings suggest drug resistance may involve not only a different cell wall architecture, but also a different response to drugs.
Keywords: Candida albicans; caspofungin; drug resistance; interaction network; proteomics.
Conflict of interest statement
No potential conflict of interest was reported by the author(s).
Figures
Similar articles
-
Caspofungin resistance in Candida albicans: genetic factors and synergistic compounds for combination therapies.Braz J Microbiol. 2022 Sep;53(3):1101-1113. doi: 10.1007/s42770-022-00739-9. Epub 2022 Mar 29. Braz J Microbiol. 2022. PMID: 35352319 Free PMC article. Review.
-
Candida and candidaemia. Susceptibility and epidemiology.Dan Med J. 2013 Nov;60(11):B4698. Dan Med J. 2013. PMID: 24192246 Review.
-
Rapamycin and caspofungin show synergistic antifungal effects in caspofungin-susceptible and caspofungin-resistant Candida strains in vitro.J Antimicrob Chemother. 2024 Jan 3;79(1):151-156. doi: 10.1093/jac/dkad359. J Antimicrob Chemother. 2024. PMID: 37991226
-
Caspofungin dose escalation for invasive candidiasis due to resistant Candida albicans.Antimicrob Agents Chemother. 2011 Jul;55(7):3254-60. doi: 10.1128/AAC.01750-10. Epub 2011 Apr 18. Antimicrob Agents Chemother. 2011. PMID: 21502632 Free PMC article.
-
Genotypic and phenotypic characterization of Candida albicans Lebanese hospital isolates resistant and sensitive to caspofungin.Fungal Genet Biol. 2019 Jun;127:12-22. doi: 10.1016/j.fgb.2019.02.008. Epub 2019 Feb 20. Fungal Genet Biol. 2019. PMID: 30794951
Cited by
-
Caspofungin Affects Extracellular Vesicle Production and Cargo in Candida auris.J Fungi (Basel). 2022 Sep 21;8(10):990. doi: 10.3390/jof8100990. J Fungi (Basel). 2022. PMID: 36294557 Free PMC article.
-
The Effects of Holothurin and Caspofungin on the Vaginal Cell Inflammation Parameters of the Rattus norvegicus Strain Post Induction of Candida albicans.Infect Drug Resist. 2023 Apr 27;16:2501-2509. doi: 10.2147/IDR.S400314. eCollection 2023. Infect Drug Resist. 2023. PMID: 37138836 Free PMC article.
-
Molecular Mechanisms Associated with Antifungal Resistance in Pathogenic Candida Species.Cells. 2023 Nov 19;12(22):2655. doi: 10.3390/cells12222655. Cells. 2023. PMID: 37998390 Free PMC article. Review.
-
Development of a yeast cell based method for efficient screening of high yield tacrolimus production strain.3 Biotech. 2024 Jan;14(1):26. doi: 10.1007/s13205-023-03870-y. Epub 2023 Dec 31. 3 Biotech. 2024. PMID: 38169568 Free PMC article.
-
Tetraploidy accelerates adaptation under drug selection in a fungal pathogen.Front Fungal Biol. 2022 Nov 16;3:984377. doi: 10.3389/ffunb.2022.984377. eCollection 2022. Front Fungal Biol. 2022. PMID: 37746235 Free PMC article.
References
-
- Gow NAR, Hube B. Importance of the Candida albicans cell wall during commensalism and infection. Curr Opin Microbiol. 2012;15(4):406–412. - PubMed
Publication types
MeSH terms
Substances
LinkOut - more resources
Full Text Sources
Other Literature Sources