. 2022 Jul 4;19(7):2651-2661.
doi: 10.1021/acs.molpharmaceut.2c00357. Epub 2022 Jun 22.

Prediction and Preparation of Coamorphous Phases of a Bislactam

Affiliations

Prediction and Preparation of Coamorphous Phases of a Bislactam

Luke I Chambers et al. Mol Pharm. .

Abstract

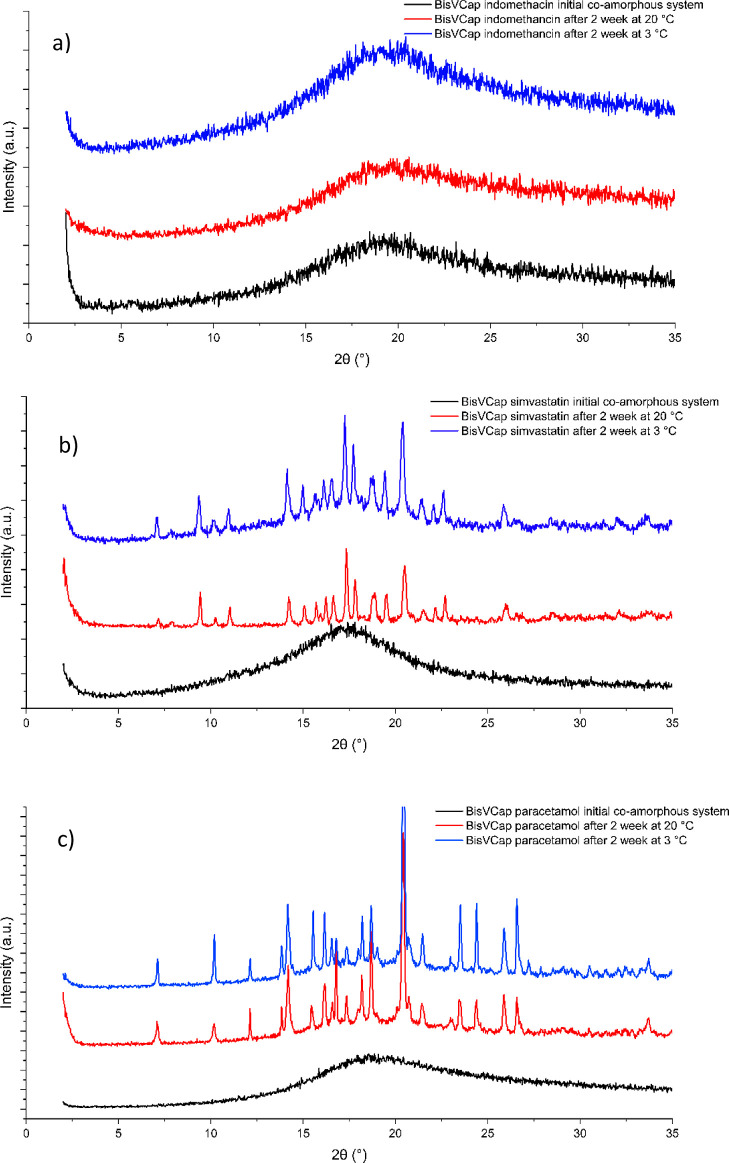
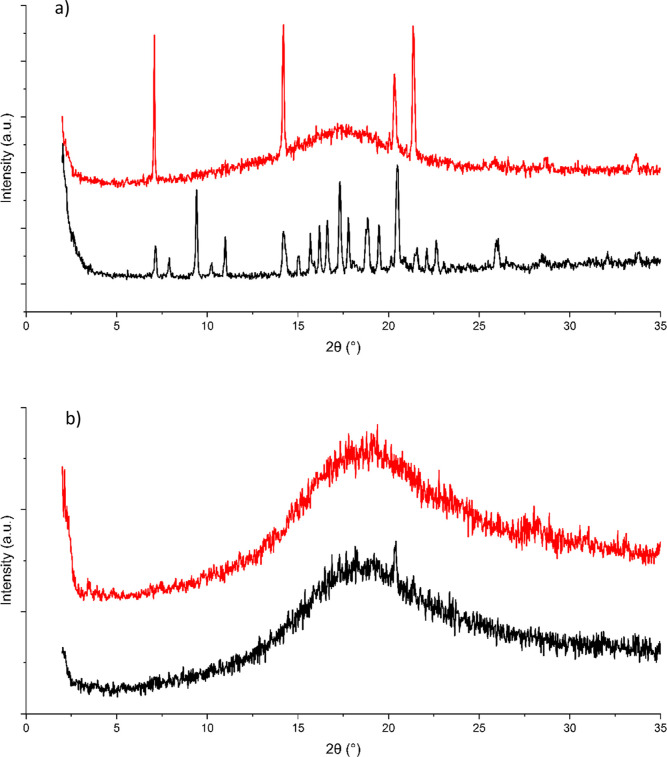
The effectiveness of a partial least squares-discriminant analysis coamorphous prediction model was tested using coamorphous screening data for a promising coamorphous former, the dimer of N-vinyl(caprolactam) (bisVCap) with a range of active pharmaceutical ingredients. The prediction model predicted 71% of the systems correctly. An experimental coamorphous screen was performed with this coformer with 13 different active pharmaceutical ingredients, and the results were compared to the predictions from the model. A total of 85% of the systems were correctly predicted. Stability assessments of three coamorphous systems showed that the prediction model score did not strongly correlate with the stability of the coamorphous material. The model performed well with small-molecule coformers, such as bisVCap, despite the difference in structure and properties compared to the amino-acid-based model training set.

Keywords: active pharmaceutical ingredients; bislactams; coamorphous; partial least squares-discriminant analysis; physical stability; predictive modeling.


Conflict of interest statement

The authors declare no competing financial interest.

Figures

Figure 1
Figure 1
PLS-DA score scatter plot of latent variables (LV) 1 and 2. The color of the markers displays the results of the previous experimental screen with red markers indicating not COAM systems and green markers indicating COAM systems. Samples incorrectly predicted by the prediction model are shown as hollow circles. The blue dashed line shows the predicted separation line between COAM and not COAM systems based on the PLS-DA calculation for visualization purposes.
Figure 2
Figure 2
PLS-DA score scatter plot of LV 1 and 2. The color of the markers displays the results of the experimental screen with red markers indicating not COAM systems and green markers indicating COAM systems. Samples incorrectly predicted by the prediction model are shown as hollow circles. The blue dashed line shows the predicted separation line systems based on the PLS-DA calculation for visualization purposes.
Figure 3
Figure 3
XRPD traces of COAM samples of bisVCap with (a) indomethacin, (b) simvastatin, and (c) paracetamol. The initial COAM samples made by RSE are shown in black. The XRPD traces are shown after 2 weeks when stored at both 20 °C (red) and 3 °C (blue).
Figure 4
Figure 4
XRPD traces of COAM samples of bisVCap with (a) simvastatin and (b) paracetamol. The XRPD traces are shown after 1 week when stored at ∼20 °C (black) and 3 °C (red).
Figure 5
Figure 5
XRPD diffractograms of bisVCap with furosemide after RSE in a 1:1 (black), 1:2 (red), 1:3 (blue), and 1:4 ratio (green). Pure form II furosemide after RSE is shown in purple.
Figure 6
Figure 6
FTIR spectra for the increased ratio study of bisVCap and furosemide showing the carbonyl and alcohol region. The spectra display pure bisVCap (black) and pure furosemide (red). The bisVCap furosemide systems were made by RSE at different ratios with 1:1 in blue, 1:2 in green, 1:3 in purple, and 1:4 in light brown. The furosemide systems which underwent RSE is also shown in cyan.
Figure 7
Figure 7
XRPD traces of a COAM bisVCap furosemide material made by RSE. The initial system is shown in black. The system was stored for 7 day at 0% RH (red), 11% RH (green), 33% RH (blue), 75% RH (cyan), and 100% RH (pink).
Figure 8
Figure 8
XRPD traces of a COAM bisVCap furosemide system made via RSE. The initial system is shown in black. The system was stored for 28 days at 0% RH (red), 11% RH (green), 33% RH (blue), 75% RH (cyan), and 100% RH (pink).

References

    1. Chieng N.; Aaltonen J.; Saville D.; Rades T. Physical characterization and stability of amorphous indomethacin and ranitidine hydrochloride binary systems prepared by mechanical activation. Eur. J. Pharm. Biopharm. 2009, 71, 47–54. 10.1016/j.ejpb.2008.06.022. - DOI - PubMed
    1. Kim D.-H.; Kim Y.; Tin Y.-Y.; Soe M.-T.-P.; Ko B.; Park S.; Lee J. Recent Technologies for Amorphization of Poorly Water-Soluble Drugs. Pharmaceutics 2021, 13, 1318.10.3390/pharmaceutics13081318. - DOI - PMC - PubMed
    1. Liu J.; Grohganz H.; Löbmann K.; Rades T.; Hempel N.-J. Co-Amorphous Drug Formulations in Numbers: Recent Advances in Co-Amorphous Drug Formulations with Focus on Co-Formability, Molar Ratio, Preparation Methods, Physical Stability, In Vitro and In Vivo Performance, and New Formulation Strategies. Pharmaceutics 2021, 13, 389.10.3390/pharmaceutics13030389. - DOI - PMC - PubMed
    1. Chavan R. B.; Thipparaboina R.; Kumar D.; Shastri N. R. Co amorphous systems: A product development perspective. Int. J. Pharm. 2016, 515, 403–415. 10.1016/j.ijpharm.2016.10.043. - DOI - PubMed
    1. Han J.; Wei Y.; Lu Y.; Wang R.; Zhang J.; Gao Y.; Qian S. Co-amorphous systems for the delivery of poorly water-soluble drugs: recent advances and an update. Expert Opin. Drug Delivery 2020, 17, 1411–1435. 10.1080/17425247.2020.1796631. - DOI - PubMed

Publication types