Review
. 2022 Oct 4;28(55):e202200407.
doi: 10.1002/chem.202200407. Epub 2022 Jul 21.

A Happy Get-Together - Probing Electrochemical Interfaces by Non-Linear Vibrational Spectroscopy

Affiliations
Review

A Happy Get-Together - Probing Electrochemical Interfaces by Non-Linear Vibrational Spectroscopy

Ratnadip De et al. Chemistry. .

Abstract

Electrochemical interfaces are key structures in energy storage and catalysis. Hence, a molecular understanding of the active sites at these interfaces, their solvation, the structure of adsorbates, and the formation of solid-electrolyte interfaces are crucial for an in-depth mechanistic understanding of their function. Vibrational sum-frequency generation (VSFG) spectroscopy has emerged as an operando spectroscopic technique to monitor complex electrochemical interfaces due to its intrinsic interface sensitivity and chemical specificity. Thus, this review discusses the happy get-together between VSFG spectroscopy and electrochemical interfaces. Methodological approaches for answering core issues associated with the behavior of adsorbates on electrodes, the structure of solvent adlayers, the transient formation of reaction intermediates, and the emergence of solid electrolyte interphase in battery research are assessed to provide a critical inventory of highly promising avenues to bring optical spectroscopy to use in modern material research in energy conversion and storage.

Keywords: Li-ion battery; electrochemical interface; interfacial electric field; surface reaction; vibrational sum frequency generation spectroscopy.


Conflict of interest statement

The authors declare no conflict of interest.

Figures
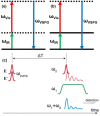
Figure 1
Figure 1
Energy and pulse diagram of (a) non‐resonant and (b) resonant VSFG. Dotted and solid lines represent virtual and real energy states respectively (c) Pulse sequence for conventional time‐resolved VSFG. (Adapted with permission from Ref. [90], Copyright 2017 American Chemical Society.)
Figure 2
Figure 2
Schematic representation of a spectroelectrochemical VSFGset‐up realizing the external reflection geometry. Key: BBIR: broad‐band mid‐infrared pulses. NBvis: narrow‐band visible (800 nm) pulses. SFG: Sum‐frequency generated signal. (Reproduced with permission from Ref. [87], Copyright 2015 American Chemical Society.)
Figure 3
Figure 3
Cross‐section of an electrochemical cell (a) an external reflection geometry with highly reflecting electrode (b) internal reflection geometry with optically transparent electrode.
Figure 4
Figure 4
(a) VSFG response from adsorbed CN on Pt electrode obtained after cycling between +0.5 V/SCE and −1 V/SCE. (b)Potential dependent VSFG spectrum of 1,4‐phenylene diisocyanide, potentials are given vs. Ag/AgCl, (c) potential dependent frequency shift of bound (black square) and free (red circle) NC group of 1,4‐phenylene diisocyanide. (Figure 4a is reproduced with permission from Ref. [59], Copyright 1990 Elsevier; Figure 4b–c are Adapted with permission from Ref. [50], Copyright 2017 American Chemical Society)
Figure 5
Figure 5
(a) VSFG spectra of CO/Pt in HClO4 (0.1 M) as a function of the CH3OH concentration. Spectra were recorded at 0.24 V vs. NHE showing two different adsorption modes. (b) Normalized SFG spectra of the Pt (1 0 0) surface in a solution of 0.01 M methanol in 0.1 M sulfuric acid as a function of the applied potential, a change in the SFG response between 20 mV and 100 mV indicates a different configuration for CO adsorption. (c) Corresponding voltammogram showing that current peak appears at the same region where the configurational change of CO adsorption happens. (Figure 5a is reproduced with permission from Ref. [67], Copyright 1995, Elsevier and Figure 5b–c are reproduced from Ref. [71], Copyright 2004 Elsevier)
Figure 6
Figure 6
Fitted SFG spectra of CO/Pt at −50 mV (a) and 800 mV (b) (signal multiplied by a factor of 4 for clarity) showing the change in the asymmetry of the peak. Potential dependent (c) amplitude and (d) relative phase of the non‐resonant response. Potential dependency of NR background inhibits direct co‐relation between surface coverage and SFG peak area/intensity for the potential dependent‐VSFG, but from the fitting results, a better analysis of NR and resonance signal is possible. (Reproduced with permission from Ref. [72], Copyright 2005 Elsevier.
Figure 7
Figure 7
(a) In In‐situ SFG spectra of the CH‐stretch region (2820 to 2940 cm−1) for the low‐density SAM of MHA exposed to air (green squares), d 3‐acetonitrile (red triangles), d 2‐water (blue diamonds), and d 8‐toluene (black circles). (b) Relative VSFG peak area of the methylene modes at wavelengths of 2855 cm−1 (solid symbols) and 2925 cm−1 (open symbols) for the low‐density SAM when a +25 mV (vs. SCE) potential was repeatedly applied. (Reproduced with permission from Ref. [82], Copyright 2003 AAAS)
Figure 8
Figure 8
VSFG response of the cation of [BMIM][PF6] at a Pt electrode recorded at different potentials (vs. Ag/AgPF6) with ssp and ppp polarization. (e) Structure of the cation (Reproduced with permission from Ref. [83], Copyright 2004 American Chemical Society)
Figure 9
Figure 9
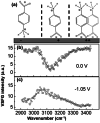
(a) Graphical representation of the potential‐induced orientation of p‐aminobenzoic acid. (b) SFG spectrum of aromatic CH stretches at Ag (1 1 1) in 20 mM PABA and 0.1 M KF at 0.0 V and (c) at −1.05 V (vs. Ag/AgCl). Transformation of spectral feature from a peak to dip at relatively positive potentials suggests flipping of the molecule as it goes through the pzc. (Adapted with permission from Ref. [84], Copyright 2005 American Chemical Society)
Figure 10
Figure 10
Potential (Ag/Ag+) dependent Im χ(2), Re χ(2) and |χ(2)|2 spectra of the acetonitrile/platinum interface with a 0.1 M LiCF3SO3 electrolyte in the CH stretch region. The red curve, black curve, and blue broken curve are Im χ(2), Re χ(2), and |χ(2)|2, respectively. |χ(2)|2 spectra were calculated from Im χ(2) and Re χ(2) spectra. At positive potentials the positive CH band in Im χ(2) spectrum indicates CH3 down orientation of acetonitrile, this band disappeared while going towards negative potentials. (Reproduced with permission from Ref. [42a], Copyright 2020 Royal Society of Chemistry)
Figure 11
Figure 11
(a) Potential dependent VSFG amplitude at 3500 cm−1(A3500) of asymmetrically hydrogen‐bonded relatively disordered water molecules on Au electrode in 10 mM sulfuric acid solution, showing a minimum near the point‐of‐zero charge. (b) VSFG spectra obtained from an Ag(1 0 0) surface in 0.1 M aqueous NaF solution at different potentials (vs. Ag/AgCl), positions of four different features are marked as 1–4 (c) Potential dependent change in intensity of those 4 peaks (d) Pictorial representation of the water orientation corresponding to four different peaks. (Figure 11a is reproduced with permission from Ref. [98], Copyright 2004 Elsevier; Figure 11b–d are reproduced with permission from Ref. [101], Copyright 2005 American Chemical Society)
Figure 12
Figure 12
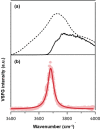
(a) VSFG spectrum from the Au/ aqueous HClO4 interface at zero delays between the VIS and IR lasers, IR wavelength below 3600 cm−1 was absorbed by bulk water (solid line), IR beam profile (dashed line). (b) VSFG spectrum from the Au/H2O interface with the 800 nm beam delayed 667 fs to the IR (suppression of NR background); Lorentzian fitting indicates a peak at 3680 cm−1 (Reproduced with permission from Ref. [106], Copyright 2017 Wiley).
Figure 13
Figure 13
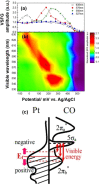
(a) Amplitude from the CO/Pt interface is plotted as a function of potential, visible light energy was different in each case. (b) Contour map of the VSFG amplitude as functions of the potential and wavelength of visible light. (c) Model of the electronic structure of the CO/Pt(1 1 1) electrode interface, showing the potential‐induced Fermi level shift and electronic coupling of visible energy to the electronic transition between the Fermi level and antibonding 5σ state of adsorbed CO. (Reproduced with permission from Ref. [111], Copyright 2015 American Chemical Society)
Figure 14
Figure 14
(a) Resonance amplitude from VSFG response of nitrile stretch from the Au‐4‐mercaptobenzonitrile surface in contact with a different solvent. (b) Variation of nitrile stretch peak as a function of the dielectric constant of the solvent. (c) Experimental data fitted to an Onsager‐like model taking asymmetry of the interface into account (d) Frequency change as a function of ionic concentration at a fixed applied potential. (Figure 14a–c are reproduced with permission from Ref. [112], Copyright 2017 American Chemical Society, Figure14d is reproduced from Ref. [113], Copyright 2017 American Chemical Society)
Figure 15
Figure 15
(a) Integrated and normalized VSFG intensities are plotted against number of voltammogram cycles. Evolution of VSFG response from pyridine ring vibration of SAMs of (4‐(4‐(4 pyridyl)phenyl)phenyl)methanethiol (PyPP1) on Au(1 1 1) during potential sweeps. (b) First two CV scans recorded in the SFG cell during the acquisition of spectra shown in (a). (c) Integrated SFG Intensity normalized to the maximum signal of the observed band from PyPP1/Au(1 1 1) (black circle) during ten CV cycles indicating an ordered structure, as compared to PyPP2 (red square) which shows disruption in ordered layer with increasing CV cycles (Reproduced with permission from Ref. [117], Copyright 2013 Elsevier)
Figure 16
Figure 16
Potentiodynamic VSFG spectra of atop and bridge bonded CO vibrational bands recorded during 0.5 M ethanol electrooxidation on a polycrystalline Pt electrode in (a) 0.1 M HClO4 and (b) 0.1 M H2SO4. (c) (Bi)sulfate and adsorbed acetate (at E>0.6 V vs. Ag/AgCl) vibrational bands (0.1 M H2SO4) appears above the NR background at potentials (Reproduced with permission from Ref. [120], Copyright 2011 Elsevier)
Figure 17
Figure 17
Solution phase FTIR (a) and in situ VSFG spectra (b–g) of [Mo(bpy)(CO)4] at an Au electrode in CH3CN and 0.1 M TBAPF6 under Ar. The FTIR spectrum is recorded at open circuit potential and the VSFG spectra at different potentials as indicated. The intensity of the NR background (dashed line, h) of the cell recorded with 0 ps time‐delay between the IR and 800 nm laser pulses provides an approximation of the spectrum of the broadband IR pulse. Spectra (b–g) are recorded with a 0.45 ps delay between the IR and asymmetric 800 nm laser pulses. Center: a pictorial representation of the proposed assignments. The assignments at −2.3 and −2.5 V are tentative due to the presence of a complex mixture of species (≥3) with spectral features at similar positions. The gray VSFG peak at ca. 2090 cm−1 is due to CO at the gold electrode, the purple peaks are assigned to [Mo(bpy‐H)(CO)4] Right: Scheme showing the proposed mechanisms for the formation of active catalytic form. (Reproduced with permission from Ref. [131], https://pubs.acs.org/doi/10.1021/jacs.7b06898, Copyright 2017 American Chemical Society, further permissions related to the material should be directed to the ACS)
Figure 18
Figure 18
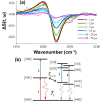
(a) Normalized TR‐VSFG difference spectra of ReC0‐Au recorded at different pump‐VSFG delays as indicated in the figure. (b) Vibrational energy level scheme of the coupled CO stretching modes of ReC0 A‐type complexes. (Reproduced with permission from Ref. [134], Copyright 2012 American Chemical Society)
Figure 19
Figure 19
(a) sps‐ and ssp‐VSFG spectra (circles) of LiCoO2 surface in contact with PC. VSFG spectra are offset for clarity. Red and blue dotted lines are simulated components corresponding to two orientations of the C=O group as shown in (b). (c) Schematic illustration of PC absorption on LiCoO2 surface. (Reproduced with permission from Ref. [139], Copyright 2009 American Chemical Society)
Figure 20
Figure 20
(a) VSFG intensity (divided by another SFG response during CV at the particular potential range or OCP) under reaction conditions from crystalline silicon Si(1 0 0)‐hydrogen‐terminated anode in contact with EC/DEC. At 1.1 V↔0.8 V (vs. Li/Li+) evolution of the peak near 2895 cm−1 corresponds to the s‐OCH2 group stretch associated with the Si‐ethoxy formation. Which is not seen in presence of only EC (b) (Reproduced with permission from Ref. [144], Copyright 2016 American Chemical Society)
Figure 21
Figure 21
(a) SFG spectra of EC/FEC mixtures at a different ratio at open circuit potential probed at ssp (open circles) and sps (open diamonds) polarization. In the top left panel “low” and “high” are assigned to vibration of EC carbonyl group with tight and loosely packed molecules respectively. (b) Top, an illustration showing the C=O vector and its angle (θ) from the normal to the surface. Bottom, the C=O bond angle to the surface normal as a function of FEC wt % content. (Reproduced with permission from Ref. [148], Copyright 2018 American Chemical Society)

Similar articles

References

    1. None
    1. Vayenas C. G., J. Solid State Electrochem. 2011, 15, 1425–1435;
    1. Santos E., Schmickler W., Catalysis in electrochemistry: from fundamental aspects to strategies for fuel cell development, Vol. 7, John Wiley & Sons, 2011.
    1. Hilt G., ChemElectroChem 2020, 7, 395–405.
    1. Janssen L., Koene L., Chem. Eng. J. 2002, 85, 137–146.

LinkOut - more resources