. 2022 Jun 22;7(12):e158791.
doi: 10.1172/jci.insight.158791.

Alu RNA induces NLRP3 expression through TLR7 activation in α-1-antitrypsin-deficient macrophages

Affiliations

Alu RNA induces NLRP3 expression through TLR7 activation in α-1-antitrypsin-deficient macrophages

Jungnam Lee et al. JCI Insight. .

Abstract

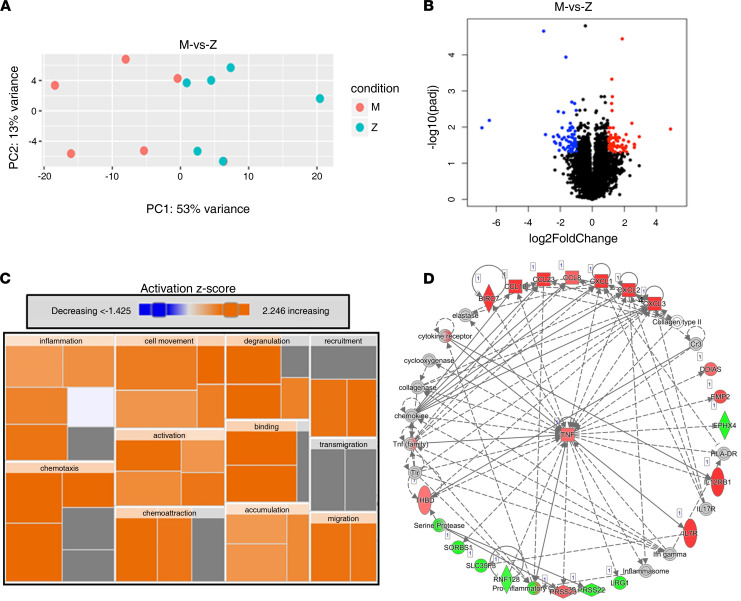
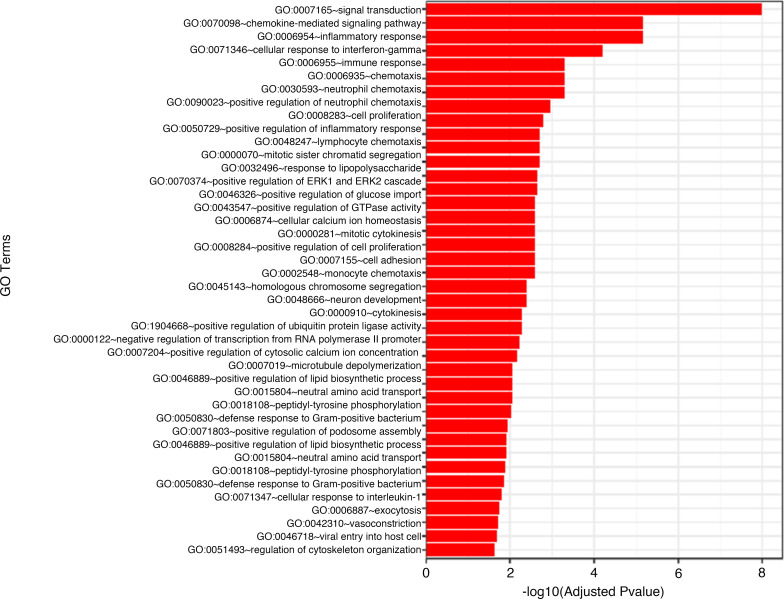
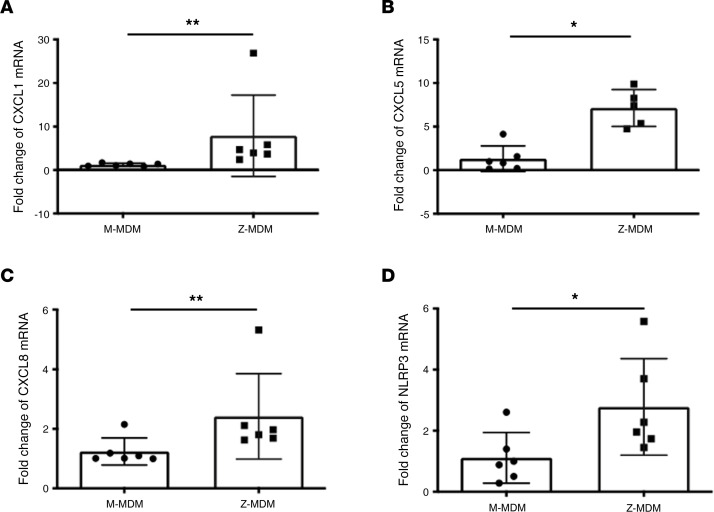
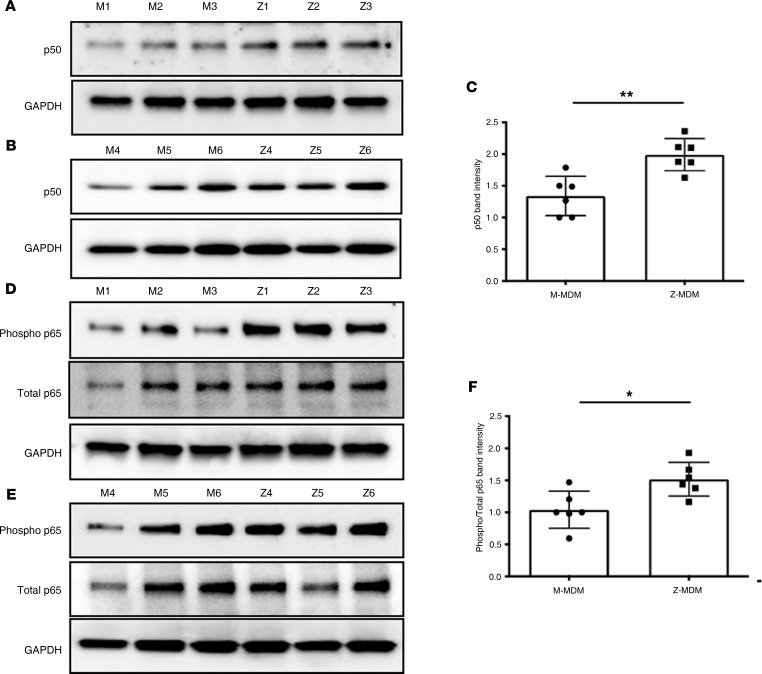
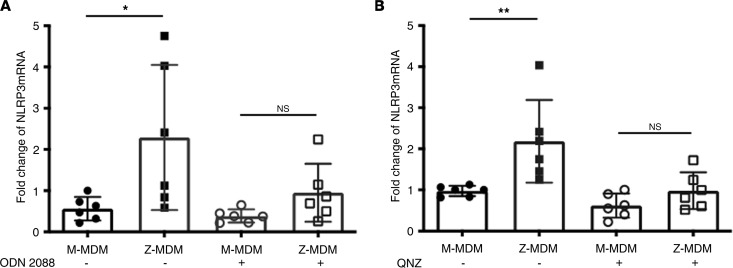
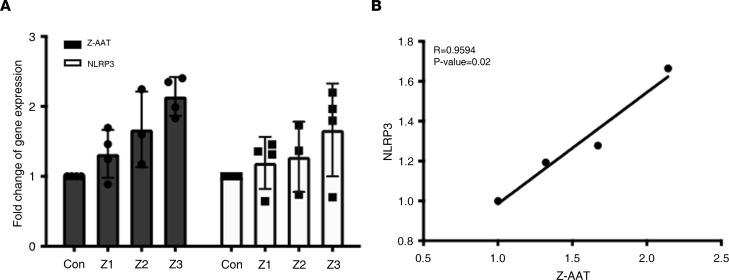
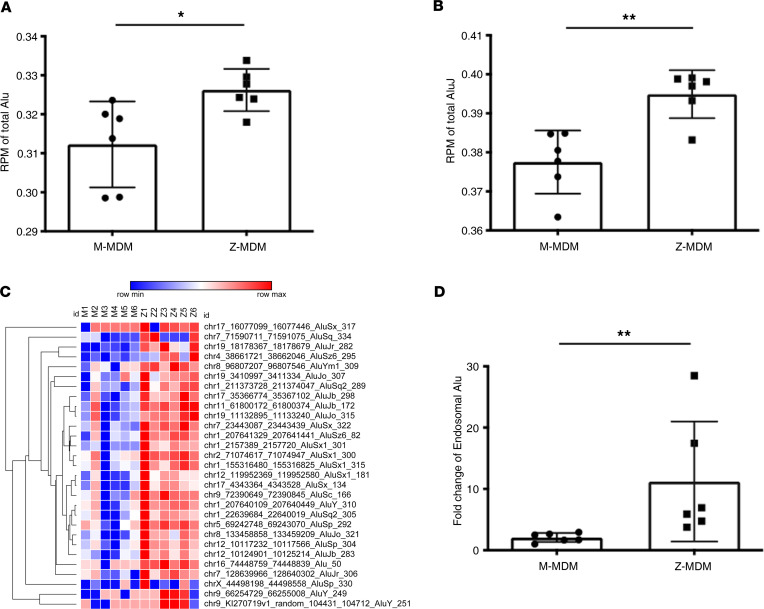
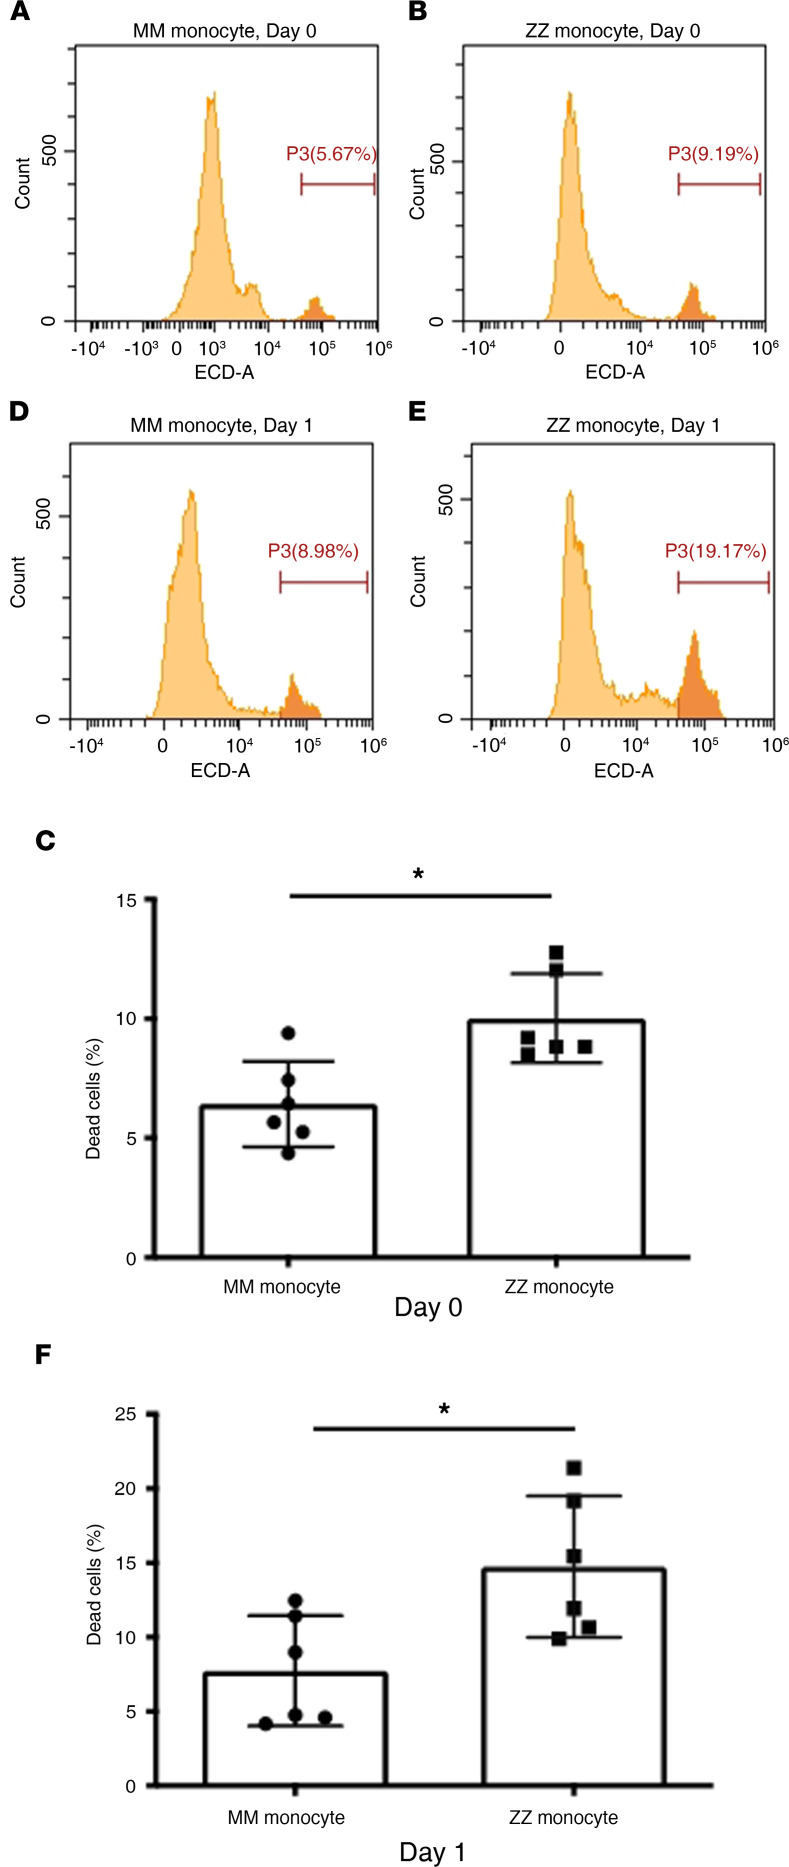
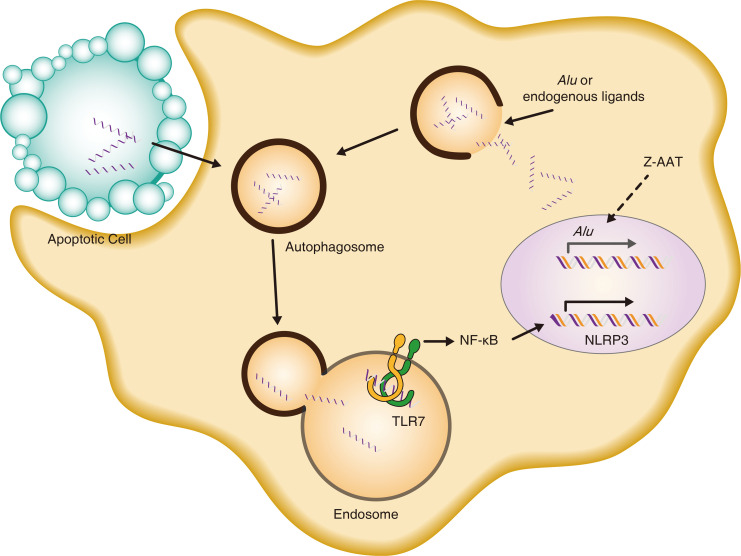
α-1 antitrypsin (AAT) is a serine protease inhibitor that plays a pivotal role in maintaining lung homeostasis. The most common AAT allele associated with AAT deficiency (AATD) is PiZ. Z-AAT accumulates in cells due to misfolding, causing severe AATD. The major function of AAT is to neutralize neutrophil elastase in the lung. It is generally accepted that loss of antiprotease function is a major cause of COPD in individuals with AATD. However, it is now being recognized that the toxic gain-of-function effect of Z-AAT in macrophage likely contributes to lung disease. In the present study, we determined that TLR7 signaling is activated in Z-MDMs, and the expression level of NLRP3, one of the targets of TLR7 signaling, is significantly higher in Z- compared with M-MDMs. We also determined that the level of endosomal Alu RNA is significantly higher in Z-compared with M-MDMs. Alu RNA is a known endogenous ligand that activates TLR7 signaling. Z-AAT likely induces the expression of Alu elements in MDMs and accelerates monocyte death, leading to the higher level of endosomal Alu RNA in Z-MDMs. Taken together,this study identifies a mechanism responsible for the toxic gain of function of Z-AAT macrophages.

Keywords: Cell Biology; Inflammation; Macrophages.


Conflict of interest statement

Conflict of interest: The authors have declared that no conflict of interest exists.

Figures

Figure 1
Figure 1. Transcriptome analysis of MDMs.
Total RNAs of M- and Z-MDMs were subjected to RNA-Seq, and the data were analyzed using DESeq2. (A) PCA plot depicts relative similarities between M-MDMs samples (red) and Z-MDMs samples (blue). (B) Volcano plot visualizes upregulated (red) or downregulated (blue) genes, which are statistically significant in Z-MDMs. The most statistically significant genes are toward the top. (C) Treemap presents hierarchical heat map of affected downstream functional categories based on DEGs in Z-MDMs. (D) A network of molecules that are related to the biological processes activated in Z-MDMs. Red and green indicate upregulated and downregulated genes in Z-MDMs, respectively.
Figure 2
Figure 2. Gene ontology analysis.
GO enrichment analysis of DEGs of Z-MDMs compared with M-MDMs was conducted. Significantly differentially expressed genes were clustered by their gene ontology, and top 40 GO terms of Z-MDMs are shown in the figure.
Figure 3
Figure 3. Verification of the DEGs by qPCR.
DEGs identified using RNA-Seq were validated using qPCR. (AC) Relative expression of neutrophil chemoattractant factors in Z-MDMs (n = 6, circles) versus M-MDMs (n = 6, squares) is represented by fold change. (D) Relative expression of NLRP3 in Z-MDMs (n = 6, circles) versus M-MDMs (n = 6, squares) is represented by fold change. Statistical analysis was conducted using the Mann-Whitney U test. Statistical significance is denoted by *P < 0.05 and **P < 0.01.
Figure 4
Figure 4. The activation of TLR7 in Z-MDMs.
MDMs were collected at day 7 of macrophage differentiation, and total proteins were isolated from the collected cells. (A and B) Equal amounts of total proteins of M- and Z-MDMs were analyzed via native-PAGE of cleaved and full-length TLR7, and protein band intensities of cleaved and full-length TLR7 were compared in M- and Z-MDMs (n = 6). (C) The protein band intensities were measured using NIH ImageJ software and presented as a ratio of cleaved to full-length TLR7. Statistical analysis was conducted using the Mann-Whitney U test. Statistical significance is denoted by **P < 0.01.
Figure 5
Figure 5. NF-κB signaling activated in Z-MDMs.
Total proteins were isolated from MDMs and subjected to SDS-PAGE to examine the activation of NF-κB signaling in Z-MDMs. (AC) p50 is an indicator for the activation of NF-κB signaling so the level of p50 was analyzed via SDS-PAGE (A and B) and compared using NIH ImageJ software (C). (D and E) The phosphorylated form of p65, another indicator for NF-κB activation, was also analyzed using western blotting. The protein band intensities of phosphorylated p65 and total p65 were quantified using NIH ImageJ software. (F) To examine the activation of NF-κB signaling, a ratio of phosphorylated p65 to total p65 was matured in MDM samples and compared between M-MDMs and Z-MDMs. Statistical analysis was conducted using the Mann-Whitney U test. Statistical significance is denoted by *P < 0.05 and **P < 0.01.
Figure 6
Figure 6. The expression of NLRP3 dependent on TLR7 and NF-κB signaling.
(A) MDMs were differentiated for 7 days and incubated with 1 μM of ODN 2088 overnight. MDM controls were incubated with 1 μM of ODN 2088 control overnight. Using qPCR, the expression levels of NLRP3 were compared between untreated M- and Z-MDMs. ODN 2088 inhibits the activation of TLR7 signaling. When the activation of TLR7 was inhibited by ODN 2088, the expression levels of NLRP3 were also compared between the 2 MDM groups. (B) MDMs were incubated with 25 nM of QNZ overnight. QNZ inhibits the activation of NLRP3 signaling. The expression levels of NLRP3 were compared between M- and Z-MDMs before and after QNZ treatment. Statistical analysis was conducted using the Mann-Whitney U test. Statistical significance is denoted by *P < 0.05 and **P < 0.01.
Figure 7
Figure 7. Positive correlation between the expression levels of Z-AAT and NLRP3 in Z-MDMs.
Z-MDMs were transfected with 3 different concentrations of Z-AAT gene-containing PCR3.1plasmids: Z1, 350 ng; Z2, 550 ng; and Z3, 750 ng. The MDM control was transfected with the PCR3.1 plasmid without the Z-AAT gene. Total RNAs were isolated from the transfected cells at 48 hours after transfection. (A) Using qPCR, the relative expression levels of AAT and NLRP3 were examined in untransfected controls and cells transfected with the Z-AAT gene-containing plasmid. (B) A Pearson’s correlation coefficient and P value between the expression levels of NLRP3 and AAT were calculated in Z-MDMs using GraphPad Prism.
Figure 8
Figure 8. Increased transcription rate of Alu elements in Z-MDMs.
(A) The transcription rates of Alu elements were normalized using RPM, and RPM of Alu elements was compared between M- and Z-MDMs. (B) RPM of AluJ, one of Alu subfamilies, was compared between M- and Z-MDMs. (C) Alu elements much more abundant in Z-MDMs than M-MDMs were identified, and their genomic locations were examined. (D) Endosomes were isolated from MDMs, and RNAs were retrieved from the isolated endosomes. Using qPCR, the level of endosomal Alu RNAs was compared between M- and Z-MDMs. Statistical analysis was conducted using the Mann-Whitney U test. Statistical significance is denoted by *P < 0.05 and **P < 0.01.
Figure 9
Figure 9. Accelerated death rate of monocytes homozygous for Z-AAT allele.
Monocytes were isolated from PBMC, and the percentage of dead monocytes was assessed by flow cytometric analysis. (AC) For day 0, MM monocytes (A) and ZZ monocytes (B) were labeled with EthD-1 immediately after their isolation from PBMC, and the percentage of dead cells were compared between the 2 monocyte groups (C). (D and E) For day 1, MM monocytes (D) and ZZ monocytes (E) were incubated in macrophage differentiation media for 24 hours and labeled with EthD-1. (F) The percentage of dead cells was analyzed and compared between MM and ZZ monocytes. Statistical analysis was conducted using the Mann-Whitney U test. Statistical significance is denoted by *P < 0.05.
Figure 10
Figure 10. Proposed model of Alu element as an endogenous ligand for TLR7 activation in Z-MDMs.

Similar articles

Cited by

References

    1. Korkmaz B, et al. Inhibition of neutrophil elastase by alpha1-protease inhibitor at the surface of human polymorphonuclear neutrophils. J Immunol. 2005;175(5):3329–3338. doi: 10.4049/jimmunol.175.5.3329. - DOI - PubMed
    1. Van‘t Wout EFA, et al. α1-Antitrypsin production by proinflammatory and antiinflammatory macrophages and dendritic cells. Am J Resp Cell Mol. 2012;46(5):607–613. doi: 10.1165/rcmb.2011-0231OC. - DOI - PubMed
    1. Jonigk D, et al. Anti-inflammatory and immunomodulatory properties of α1-antitrypsin without inhibition of elastase. Proc Natl Acad Sci U S A. 2013;110(37):15007–15012. doi: 10.1073/pnas.1309648110. - DOI - PMC - PubMed
    1. Zhou T, et al. Alpha-1 antitrypsin attenuates M1 microglia-mediated neuroinflammation in retinal degeneration. Front Immunol. 2018;9:1202. doi: 10.3389/fimmu.2018.01202. - DOI - PMC - PubMed
    1. Kueppers F, et al. Protein modeling to assess the pathogenicity of rare variants of SERPINA1 in patients suspected of having alpha 1 antitrypsin deficiency. BMC Med Genet. 2019;20(1):125. doi: 10.1186/s12881-019-0852-5. - DOI - PMC - PubMed

Publication types

MeSH terms