α‑lipoic acid inhibits cerulein/resistin‑induced expression of interleukin‑6 by activating peroxisome proliferator‑activated receptor‑γ in pancreatic acinar cells
- PMID: 35730599
- PMCID: PMC9260878
- DOI: 10.3892/mmr.2022.12780
α‑lipoic acid inhibits cerulein/resistin‑induced expression of interleukin‑6 by activating peroxisome proliferator‑activated receptor‑γ in pancreatic acinar cells
Abstract
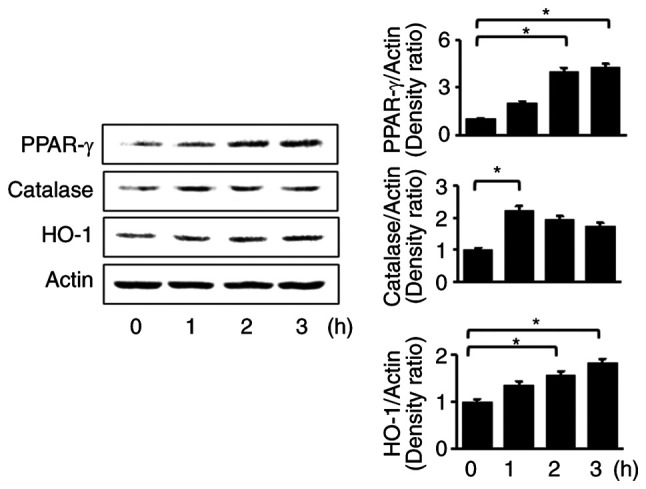
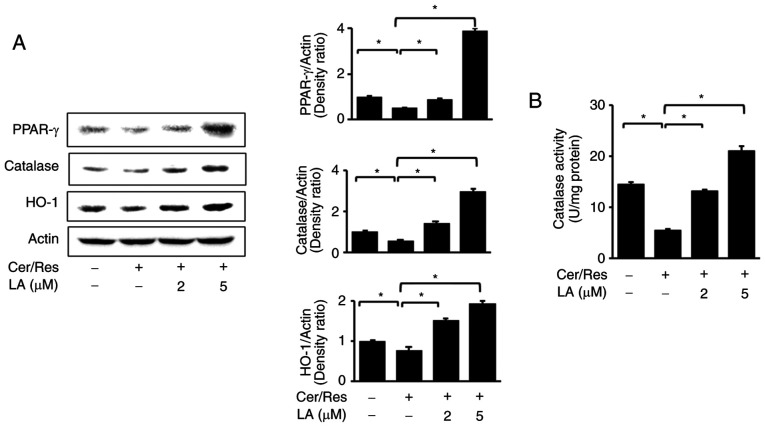
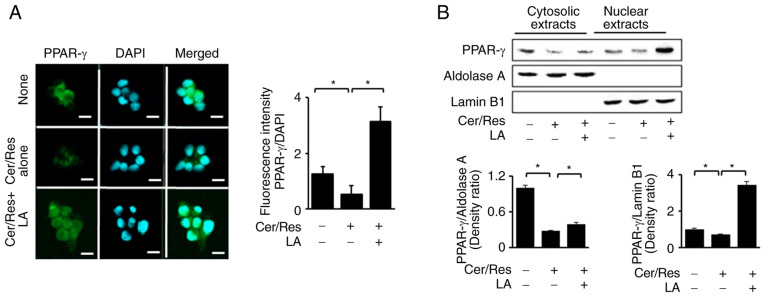
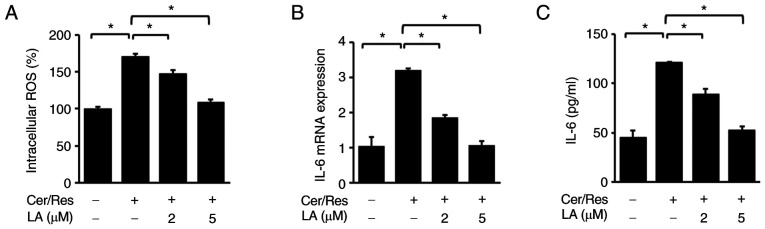
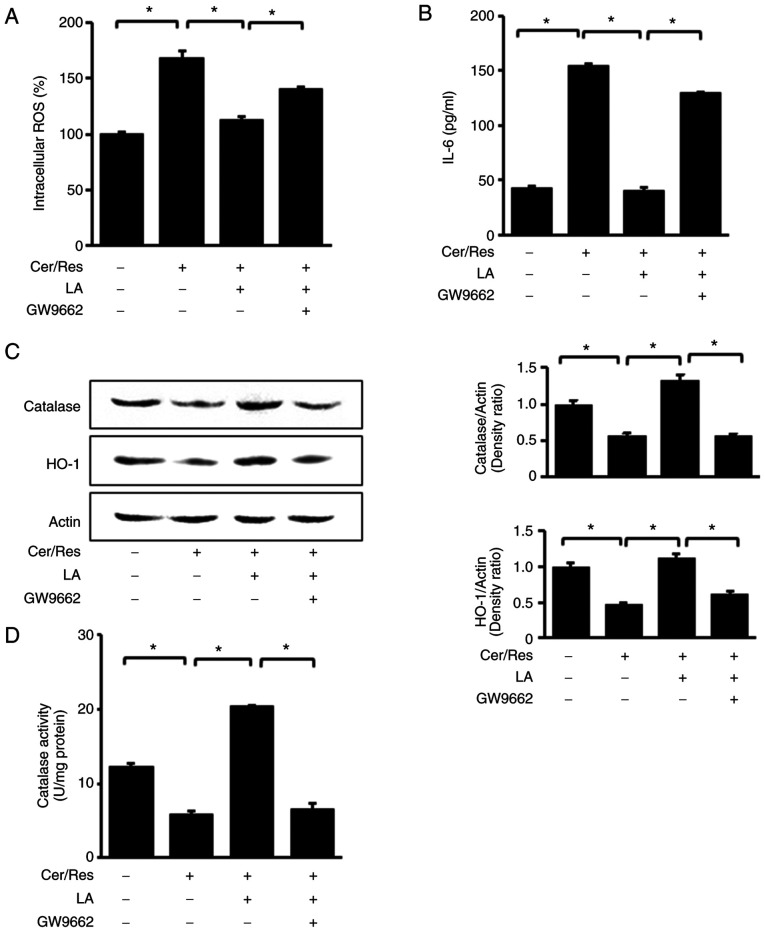
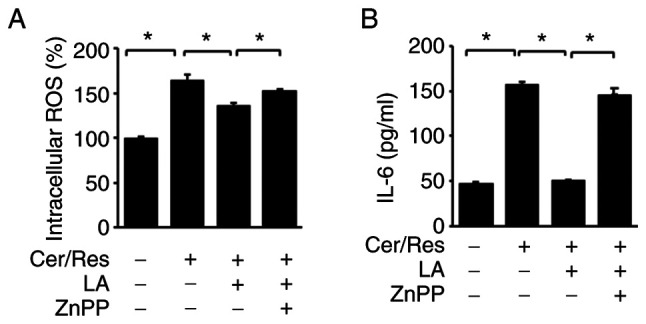
Cerulein‑induced pancreatitis resembles human acute pancreatitis in terms of pathological events, such as enzymatic activation and inflammatory cell infiltration in the pancreas. Cerulein is a cholecystokinin analog that increases levels of reactive oxygen species (ROS) and interleukin‑6 (IL‑6) expression level in pancreatic acinar cells. Serum levels of resistin, which is secreted from adipocytes, are reportedly higher in patients with acute pancreatitis than in healthy individuals. Previously, it was shown that the adipokine resistin can aggravate the cerulein‑induced increase in ROS levels and IL‑6 expression level in pancreatic acinar cells. Peroxisome proliferator‑activated receptor‑gamma (PPAR‑γ) is a key regulator of the transcription and expression of antioxidant enzymes, including heme oxygenase 1 (HO‑1) and catalase. α‑lipoic acid, a naturally occurring dithiol antioxidant, can prevent cerulein‑induced pancreatic damage in rats. In the present study, it was aimed to investigate whether α‑lipoic acid can attenuate the cerulein/resistin‑induced increase in IL‑6 expression and ROS levels via PPAR‑γ activation in pancreatic acinar AR42J cells. The anti‑inflammatory mechanism of α‑lipoic acid was determined using reverse transcription‑quantitative PCR, western blot analysis, enzyme‑linked immunosorbent assay, immunofluorescence staining and fluorometry. Treatment with cerulein and resistin increased ROS levels and IL‑6 expression level, which were inhibited by α‑lipoic acid in pancreatic acinar cells. α‑lipoic acid increased the nuclear translocation and expression level of PPAR‑γ and the expression levels of its target genes: HO‑1 and catalase. The PPAR‑γ antagonist GW9662 and HO‑1 inhibitor zinc protoporphyrin reversed the inhibitory effect of α‑lipoic acid on cerulein/resistin‑induced increase in ROS and IL‑6 levels. In conclusion, α‑lipoic acid inhibits the cerulein/resistin‑induced increase in ROS production and IL‑6 expression levels by activating PPAR‑γ and inducing the expression of HO‑1 and catalase in pancreatic acinar cells.
Keywords: acute pancreatitis; interleukin‑6; peroxisome proliferator‑activated receptor‑gamma; reactive oxygen species; α‑lipoic acid.
Conflict of interest statement
The authors declare that they have no competing interests.
Figures
Similar articles
-
Lutein inhibits IL‑6 expression by inducing PPAR‑γ activation and SOCS3 expression in cerulein‑stimulated pancreatic acinar cells.Mol Med Rep. 2022 Oct;26(4):302. doi: 10.3892/mmr.2022.12818. Epub 2022 Aug 10. Mol Med Rep. 2022. PMID: 35946453 Free PMC article.
-
Docosahexaenoic acid inhibits IL-6 expression via PPARγ-mediated expression of catalase in cerulein-stimulated pancreatic acinar cells.Int J Biochem Cell Biol. 2017 Jul;88:60-68. doi: 10.1016/j.biocel.2017.05.011. Epub 2017 May 5. Int J Biochem Cell Biol. 2017. PMID: 28483666
-
Astaxanthin Inhibits Interleukin-6 Expression in Cerulein/Resistin-Stimulated Pancreatic Acinar Cells.Mediators Inflamm. 2021 Jul 24;2021:5587297. doi: 10.1155/2021/5587297. eCollection 2021. Mediators Inflamm. 2021. PMID: 34349610 Free PMC article.
-
A Mini-Review on the Effect of Docosahexaenoic Acid (DHA) on Cerulein-Induced and Hypertriglyceridemic Acute Pancreatitis.Int J Mol Sci. 2017 Oct 25;18(11):2239. doi: 10.3390/ijms18112239. Int J Mol Sci. 2017. PMID: 29068376 Free PMC article. Review.
-
Inhibitory mechanism of lycopene on cytokine expression in experimental pancreatitis.Ann N Y Acad Sci. 2011 Jul;1229:99-102. doi: 10.1111/j.1749-6632.2011.06107.x. Ann N Y Acad Sci. 2011. PMID: 21793844 Review.
Cited by
-
Natural product-based nano-antioxidant for the treatment of acute pancreatitis.Regen Biomater. 2025 Apr 21;12:rbaf012. doi: 10.1093/rb/rbaf012. eCollection 2025. Regen Biomater. 2025. PMID: 40405869 Free PMC article.
-
Lipoamide Attenuates Hypertensive Myocardial Hypertrophy Through PI3K/Akt-Mediated Nrf2 Signaling Pathway.J Cardiovasc Transl Res. 2024 Aug;17(4):910-922. doi: 10.1007/s12265-024-10488-9. Epub 2024 Feb 9. J Cardiovasc Transl Res. 2024. PMID: 38334841 Free PMC article.
-
Predictive value of adipokines for the severity of acute pancreatitis: a meta-analysis.BMC Gastroenterol. 2024 Jan 13;24(1):32. doi: 10.1186/s12876-024-03126-w. BMC Gastroenterol. 2024. PMID: 38218787 Free PMC article.
-
Therapeutic Potential of Alpha-Lipoic Acid: Unraveling Its Role in Oxidative Stress and Inflammatory Conditions.Curr Issues Mol Biol. 2025 Apr 30;47(5):322. doi: 10.3390/cimb47050322. Curr Issues Mol Biol. 2025. PMID: 40699721 Free PMC article. Review.
References
-
- Dellinger E, Forsmark C, Layer P, Lévy P, Maraví-Poma E, Petrov MS, Shimosegawa T, Siriwardena AK, Uomo G, Whitcomb DC, et al. Determinant-based classification of acute pancreatitis severity: An international multidisciplinary consultation. Ann Surg. 2012;256:875–880. doi: 10.1097/SLA.0b013e318256f778. - DOI - PubMed
MeSH terms
Substances
LinkOut - more resources
Full Text Sources
Medical