. 2022 Jun;8(6):mgen000811.
doi: 10.1099/mgen.0.000811.

The niche-specialist and age-related oral microbial ecosystem: crosstalk with host immune cells in homeostasis

Affiliations

The niche-specialist and age-related oral microbial ecosystem: crosstalk with host immune cells in homeostasis

Dongjia Lin et al. Microb Genom. 2022 Jun.

Abstract

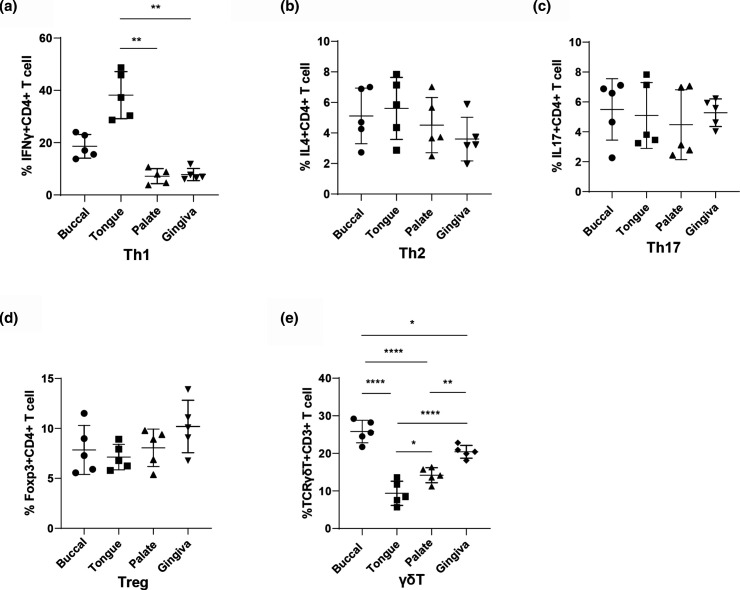
Although characterization of the baseline oral microbiota has been discussed, the current literature seems insufficient to draw a definitive conclusion on the interactions between the microbes themselves or with the host. This study focuses on the spatial and temporal characteristics of the oral microbial ecosystem in a mouse model and its crosstalk with host immune cells in homeostasis. The V3V4 regions of the 16S rRNA gene of 20 samples from four niches (tongue, buccal mucosa, keratinized gingiva and hard palate) and 10 samples from two life stages (adult and old) were analysed. Flow cytometry (FCM) was used to investigate the resident immune cells. The niche-specialist and age-related communities, characterized based on the microbiota structure, interspecies communications, microbial functions and interactions with immune cells, were addressed. The phylum Firmicutes was the major component in the oral community. The microbial community profiles at the genus level showed that the relative abundances of the genera Bacteroides, Lactobacillus and Porphyromonas were enriched in the gingiva. The abundance of the genera Streptococcus, Faecalibaculum and Veillonella was increased in palatal samples, while the abundance of Neisseria and Bradyrhizobium was enriched in buccal samples. The genera Corynebacterium, Stenotrophomonas, Streptococcus and Fusobacterium were proportionally enriched in old samples, while Prevotella and Lacobacillus were enriched in adult samples. Network analysis showed that the genus Lactobacillus performed as a central node in the buccal module, while in the gingiva module, the central nodes were Nesterenkonia and Hydrogenophilus. FCM showed that the proportion of Th1 cells in the tongue samples (38.18 % [27.03-49.34 %]) (mean [range]) was the highest. The proportion of γδT cells in the buccal mucosa (25.82 % [22.1-29.54 %]) and gingiva (20.42 % [18.31-22.53 %]) samples was higher (P<0.01) than those in the palate (14.18 % [11.69-16.67 %]) and tongue (9.38 % [5.38-13.37 %] samples. The proportion of Th2 (31.3 % [16.16-46.44 %]), Th17 (27.06 % [15.76-38.36 %]) and Treg (29.74 % [15.71-43.77 %]) cells in the old samples was higher than that in the adult samples (P<0.01). Further analysis of the interplays between the microbiomes and immune cells indicated that Th1 cells in the adult group, nd Th2, Th17 and Treg cells in the old group were the main immune factors strongly associated with the oral microbiota. For example, Th2, Th17 and Treg cells showed a significantly positive correlation with age-related microorganisms such as Sphingomonas, Streptococcus and Acinetobacter, while Th1 cells showed a negative correlation. Another positive correlation occurred between Th1 cells and several commensal microbiomes such as Lactobacillus, Jeotgalicoccus and Sporosarcina. Th2, Th17 and Treg cells showed the opposite trend. Together, our findings identify the niche-specialist and age-related characteristics of the oral microbial ecosystem and the potential associations between the microbiomes and the mucosal immune cells, providing critical insights into mucosal microbiology.

Keywords: age-related microbiota; mucosal microbiology; niche-specialist microbiome; oral homeostasis; oral microbial ecosystem.


Conflict of interest statement

The authors declare that there are no conflicts of interest.

Figures

Fig. 1.
Fig. 1.
Niche sharing among oral bacteria and distinct core taxa at different sites. (a–d) Comparative alpha diversity (a–c) and beta diversity (d) principal coordinate analysis (PCoA) of the oral microbiome in different oral sites. (a) Box plot of community richness analysis (Chao1 index). (b) Box plot of community diversity analysis (Simpson index). (c) Box plot of community evenness analysis (Equitability index). Following the normal distribution and homogeneity of variance, significant changes in Chao1 indices and Equitability indices between the different site groups were verified by one-way ANOVA. Since the Simpson indices of each sample did not follow the homogeneity of variance, significant changes were verified by the Kruskal–Wallis rank-sum test. P≤0.05 was used as a threshold. (d) Bray–Curtis PCoA plot (ANOSIM, R=0.987, P<0.05). (e) Bar graph representing the relative community composition of the top 12 orders of the oral microbiota at each oral site. (f) Richness heatmap of the microbiota composition of the top 15 genera within each sample (horizontal axis). Dendrogram of sample sites based on the community similarity along the left axis. The colour of the spots represents the relative abundance of each genus. The taxonomic assignment is shown on the right. Each column represents one subject. (g–k) Differences in relative abundance at the genus level among groups according to LEfSe analysis.
Fig. 2.
Fig. 2.
Genus–genus relationship and functional analysis of different communities. (a–d) Overview of modular structures of sample groups. Network analysis was performed at the level of the top 60 genera. Each node represents a genus, size represents the number of its connections, different colours represent different classifications, the line between the nodes represents the correlation between the two genera, the solid line represents a positive correlation, the dashed line represents a negative correlation, and the thickness of the line represents the absolute value of the correlation coefficient. (a) Network analysis for the tongue samples. (b) Network analysis for the buccal samples. (c) Network analysis for the gingival samples. (d) Network analysis for the palatal samples. (e) COG functional pathway abundance analysis of the oral microbiota in different habitats. G, G1–5: gingiva, T, T1–5: tongue, B, B1–5: buccal mucosa, P, P1–5: palate.
Fig. 3.
Fig. 3.
Boxplots of the abundance of CD4+ Th cells and γδT cells distributed at different oral sites. (a) Boxplots for Th1 cells. (b) Boxplots for Th2 cells. (c) Boxplots for Th17 cells. (d) Boxplots for Treg cells. (e) Boxplots for γδT cells. Significant differences in Th2, Treg and γδT cells between groups were analysed with one-way ANOVA. Significant differences in Th1 and Th17 cells between groups were analysed with the Kruskal–Wallis rank sum test. Continuous variables are presented as means±sd. *P<0.05, **P<0.01, ***P<0.001 and ****P<0.0001. More details of the statistical analysis can be found in the supplementary text.
Fig. 4.
Fig. 4.
Correlation analysis between immune cells and the niche-specific oral microbiota. (a) Spearman correlation heatmap showing the correlation between microbial classification (10 dominant genera at the average level) and immune cells. Significant differences between the four groups at: *P<0.05 and **P<0.01. (b) RDA showing the correlation of immune factors and dominant microbial taxa. Arrows represent different environmental factors. The direction of the coloured arrow indicates the correlation between immune cells and dominant microbial taxa (at the OTU level). Angles between arrows represent their correlation: acute angles indicate that the environmental factors represented are positively correlated, and obtuse angles represent negative correlations. The length of the arrow represents the degree of correlation: the longer the arrow, the greater the influence on the oral microbial communities. (c–g) LRA of the relationship between the immune cells and the oral microbial taxa (at the OTU level), Th1 (c), Th2 (d), Th17 (e), Treg (f) and γδT (g) cells. R 2 indicates the squared correlation coefficient, the x-axis represents the oral microbial communities, and the y-axis represents immune cells.
Fig. 5.
Fig. 5.
The oral microbiota community was age-related. (a–d) Comparative alpha diversity (a–c) and beta diversity (d) PCoA of the saliva microbiome between adult mice and old mice. (a) Community richness analysis (Chao1 index). (b) Community diversity analysis (Simpson index). (c) Community evenness analysis (Equitability index). Following the normal distribution and homogeneity of variance, significant changes in Chao1 between the different age groups were verified by Student’s t-test. Since Simpson indices and Equitability indices of each sample did not follow the homogeneity of variance, significant changes were verified by the Wilcoxon rank-sum test. P≤0.05 was used as a threshold. (d) Bray–Curtis PCoA plot (ANOSIM, R=0.62, P<0.05). (e) Bar graph representing the relative community composition of the top 10 orders in saliva samples of adult mice and old mice. (f) Richness heatmap of the microbiota composition of the top 10 genera within each sample (horizontal axis). Dendrogram of sample sites based on community similarity along the left axis. The colour of the spots represents the relative abundance of the OTUs. The taxonomic assignment is shown on the right. Each column represents one subject. (g–k) Differences in relative abundance at the genus level among groups according to LEfSe analysis.
Fig. 6.
Fig. 6.
Taxon–taxon relationship and functional analysis of the oral microbiomes at different stages. (a) Network analysis for the adult samples. (b) Network analysis for the old samples. Network analysis was performed at the level of the top 50 genera. The OTU nodes under each genus were merged into single-genus nodes, which were colour-coded by phyla. The size of the node correlates with the number of links of the node. A solid line indicates a positive correlation. A dotted line shows a negative correlation. (c) COG functional pathway abundance analysis.
Fig. 7.
Fig. 7.
Boxplots of the abundance of CD4+ T cell subsets distributed at different life stages. (a) Boxplots for Th1 cells. (b) Boxplots for Th2 cells. (c) Boxplots for Th17 cells. (d) Boxplots for Treg cells. (e) Boxplots for γδT cells. Significant differences in Th1 cells between groups were analysed with Student’s t-test. Significant differences in Th2, Th17, Treg and γδT cells between groups were analysed with the Wilcoxon rank sum test. Continuous variables are presented as means±sd. **P<0.01, ***P<0.001. More details of the statistical analysis can be found in the supplementary text.
Fig. 8.
Fig. 8.
Correlation analysis between the immune cells and the relative abundance of oral microbiota at different life stages. (a) Spearman correlation heatmap showing the correlation between microbial classification (20 dominant genera at the average level) and immune cells. Asterisks indicate significant differences between the two groups: *P<0.05, **P<0.01. (b) RDA showing the correlation of immune factors and dominant microbial taxa. Arrows represent different immune factors. The direction of the colour arrow indicates the correlation between immune cells and dominant microbial taxa (at the OTU level). Angles between arrows represent their correlation; acute angles indicate that the environmental factors represented are positively correlated, and obtuse angles indicate negative correlations. The length of the arrow represents the degree of correlation; the longer arrow, the greater the influence on the oral microbial communities. (c–g) LRA of the relationship between the immune cells and the oral microbial taxa (at the OTU level), Th1 (c), Th2 (d), Th17 (e), Treg (f) and γδT (g) cells. R 2 indicates the squared correlation coefficient, the x-axis represents the oral microbial communities, and the y-axis represents immune cells.

Similar articles

Cited by

References

    1. Zubeidat K, Hovav AH. Shaped by the epithelium - postnatal immune mechanisms of oral homeostasis. Trends Immunol. 2021;42:622–634. doi: 10.1016/j.it.2021.05.006. - DOI - PubMed
    1. Lin D, Yang L, Wen L, Lu H, Chen Q, et al. Crosstalk between the oral microbiota, mucosal immunity, and the epithelial barrier regulates oral mucosal disease pathogenesis. Mucosal Immunol. 2021;14:1247–1258. doi: 10.1038/s41385-021-00413-7. - DOI - PubMed
    1. Bergmeier LA. Oral Mucosa in Health and Disease. 1st edn. Cham: Springer; 2018. - DOI
    1. Koren N, Zubeidat K, Saba Y, Horev Y, Barel O, et al. Maturation of the neonatal oral mucosa involves unique epithelium-microbiota interactions. Cell Host Microbe. 2021;29:197–209. doi: 10.1016/j.chom.2020.12.006. - DOI - PubMed
    1. Belibasakis GN. Microbiological changes of the ageing oral cavity. Arch Oral Biol. 2018;96:230–232. doi: 10.1016/j.archoralbio.2018.10.001. - DOI - PubMed

Publication types

Substances

LinkOut - more resources