. 2022 Aug 2;38(15):3785-3793.
doi: 10.1093/bioinformatics/btac406.

Functional characterization of co-phosphorylation networks

Affiliations

Functional characterization of co-phosphorylation networks

Marzieh Ayati et al. Bioinformatics. .

Abstract

Motivation: Protein phosphorylation is a ubiquitous regulatory mechanism that plays a central role in cellular signaling. According to recent estimates, up to 70% of human proteins can be phosphorylated. Therefore, the characterization of phosphorylation dynamics is critical for understanding a broad range of biological and biochemical processes. Technologies based on mass spectrometry are rapidly advancing to meet the needs for high-throughput screening of phosphorylation. These technologies enable untargeted quantification of thousands of phosphorylation sites in a given sample. Many labs are already utilizing these technologies to comprehensively characterize signaling landscapes by examining perturbations with drugs and knockdown approaches, or by assessing diverse phenotypes in cancers, neuro-degerenational diseases, infectious diseases and normal development.

Results: We comprehensively investigate the concept of 'co-phosphorylation' (Co-P), defined as the correlated phosphorylation of a pair of phosphosites across various biological states. We integrate nine publicly available phosphoproteomics datasets for various diseases (including breast cancer, ovarian cancer and Alzheimer's disease) and utilize functional data related to sequence, evolutionary histories, kinase annotations and pathway annotations to investigate the functional relevance of Co-P. Our results across a broad range of studies consistently show that functionally associated sites tend to exhibit significant positive or negative Co-P. Specifically, we show that Co-P can be used to predict with high precision the sites that are on the same pathway or that are targeted by the same kinase. Overall, these results establish Co-P as a useful resource for analyzing phosphoproteins in a network context, which can help extend our knowledge on cellular signaling and its dysregulation.

Availability and implementation: github.com/msayati/Cophosphorylation. This research used the publicly available datasets published by other researchers as cited in the manuscript.

Supplementary information: Supplementary data are available at Bioinformatics online.


Figures

Fig. 1.
Fig. 1.
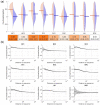
Statistical significance of co-phosphorylation. Each panel compares the distribution of co-phosphorylation computed on a specific dataset against that computed on randomly permuted data for each dataset. The blue histogram shows the distribution of co-phosphorylation (the correlation between the phosphorylation levels) of all pairs of phosphosites identified in the corresponding study, the pink histogram in each panel shows the average distribution of co-phosphorylation of all pairs of phosphosites across 100 permutation tests. The permutation tests are performed by randomly permuting all entries in the phosphorylation matrix. The difference between the means of each pair of distributions is given on the colored boxes below. The 95% confidence intervals for the difference are provided in brackets (A color version of this figure appears in the online version of this article.)
Fig. 2.
Fig. 2.
Co-phosphorylation of phosphorylation sites on the same protein. (a) Comparison of the distribution of Co-P for all site pairs that are on the same protein (left histogram) versus Co-P for all pairs of sites on different proteins (right histogram). Each violin plot represents a different dataset. Colored boxes below indicate the mean difference between the intra-protein pairs and inter-protein pairs. Within brackets, 95% confidence intervals for the mean Co-P difference are provided. (b) The relationship between Co-P and sequence proximity for pairs of sites that reside on the same protein. Each panel shows a different dataset, the x-axis in each panel shows the distance between sites on the protein sequence (in terms of number of residues) and the y-axis shows the co-phosphorylation between pairs of sites in close proximity (up to the corresponding distance in x-axis). The curve and shaded area respectively show the mean Co-P and its 95% confidence interval (A color version of this figure appears in the online version of this article.)
Fig. 3.
Fig. 3.
The relationship between co-phosphorylation and functional association between pairs of phosphorylation sites. In each panel, the violin plots compare the distribution of Co-P for phosphosite pairs with an edge in the respective functional association network (colored histograms) against all phosphosite pairs (gray-colored histograms), across the nine datasets that are considered. For each dataset, the left/right violin plots respectively show intra-/inter-protein pairs. The black horizontal lines show the mean Co-P for all (intra- or inter-protein) phosphosite pairs, the colored horizontal lines show the mean Co-P for functionally associated pairs. The four type of functional association networks that are considered are illustrated on the right side of the corresponding violin plot. On the rightmost side, the colored tables show the mean difference between functionally associated pairs and all phosphosite pairs (corresponding to the gap between colored and black horizontal lines in the violin plots) for nine datasets and four functional networks. In each cell, the 95% confidence intervals for the mean difference are given within brackets (A color version of this figure appears in the online version of this article.)
Fig. 4.
Fig. 4.
The utility of Co-P in predicting the functional association of phosphorylation sites. (Left) Precision-recall curve showing the functional predictivity of the Co-P network obtained by integrating nine different phosphoproteomic datasets. The shaded gray area shows the 95% confidence interval for the mean precision-recall curve for permutation tests obtained by randomly ranking pairs of phosphosites (across 20 runs). (Right) Comparison of the predictive performance of the integrated Co-P network against the nine individual Co-P networks obtained using each dataset separately. The x-axis shows the number of pairs that are included in the Co-P network, the y-axis shows the odds ratio of being connected in the respective functional network given that the sites are connected in the Co-P network. (Top) Predicting shared-kinase associations. (Bottom) Predicting shared-pathway associations

References

    1. Abe Y. et al. (2017) Deep phospho-and phosphotyrosine proteomics identified active kinases and phosphorylation networks in colorectal cancer cell lines resistant to cetuximab. Sci. Rep., 7, 1–12. - PMC - PubMed
    1. Arshad O.A. et al. (2019) An integrative analysis of tumor proteomic and phosphoproteomic profiles to examine the relationships between kinase activity and phosphorylation. Mol. Cell. Proteomics, 18(8 suppl 1), S26–S36. - PMC - PubMed
    1. Aya, ti M. et al. (2020) Co-phosphorylation networks reveal subtype-specific signaling modules in breast cancer. Bioinformatics, 37, 221–228. - PMC - PubMed
    1. Ayati M. et al. (2019) Cophosk: a method for comprehensive kinase substrate annotation using co-phosphorylation analysis. PLoS Comput. Biol., 15, e1006678. - PMC - PubMed
    1. Babur O. et al. (2021) Causal interactions from proteomic profiles: molecular data meet pathway knowledge. Patterns, 2, 100257. - PMC - PubMed

Publication types