. 2022 Sep 15;33(11):ar99.
doi: 10.1091/mbc.E21-11-0585. Epub 2022 Jun 22.

MotiQ: an open-source toolbox to quantify the cell motility and morphology of microglia

Affiliations

MotiQ: an open-source toolbox to quantify the cell motility and morphology of microglia

Jan N Hansen et al. Mol Biol Cell. .

Abstract

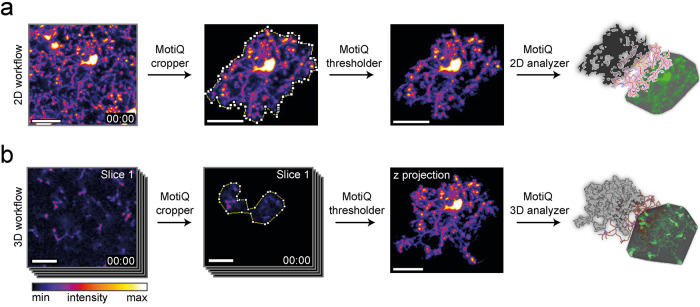
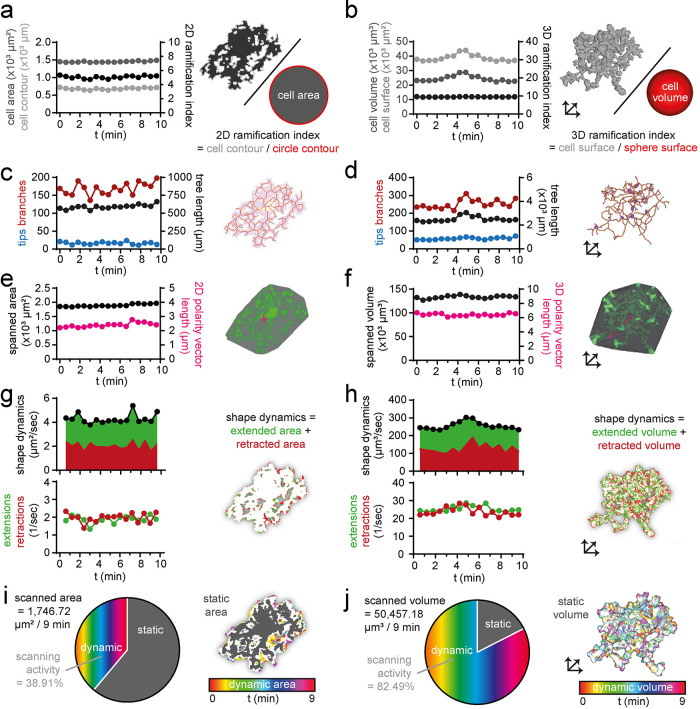
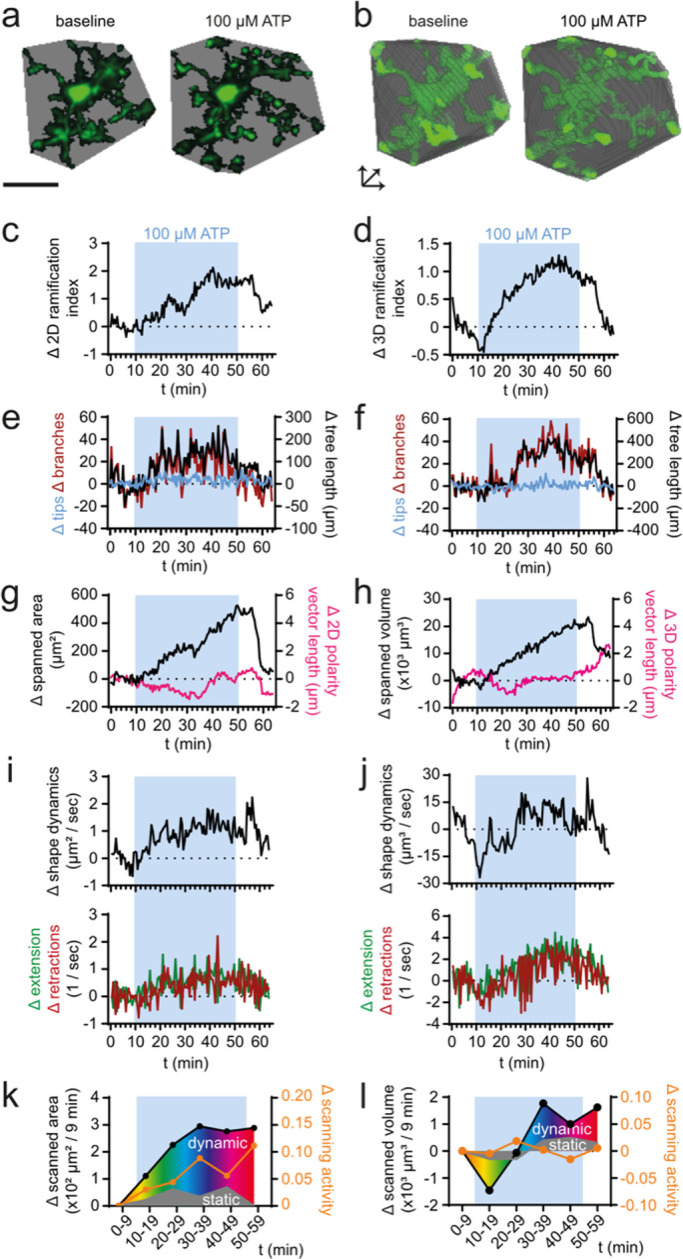
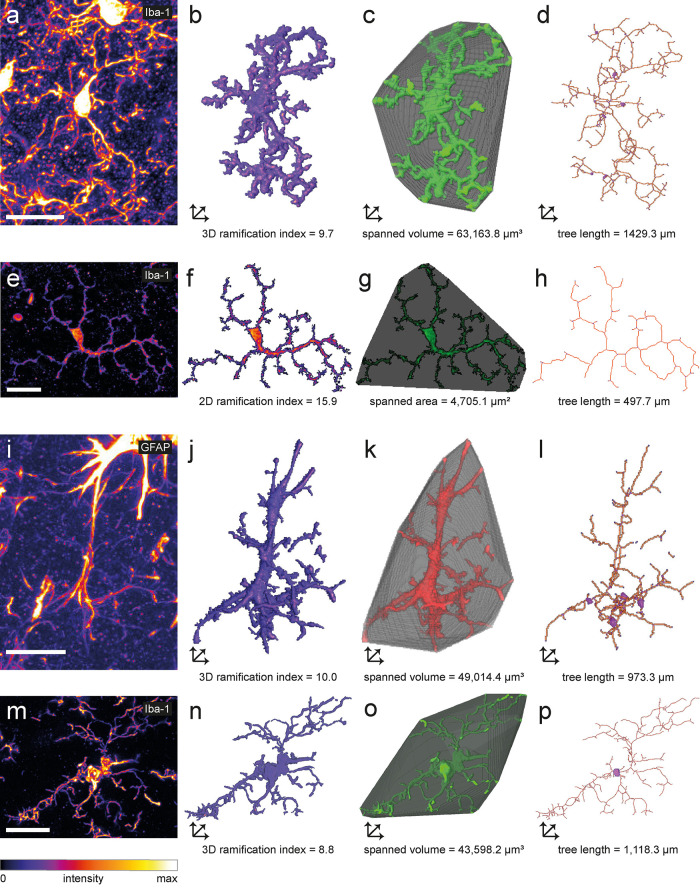
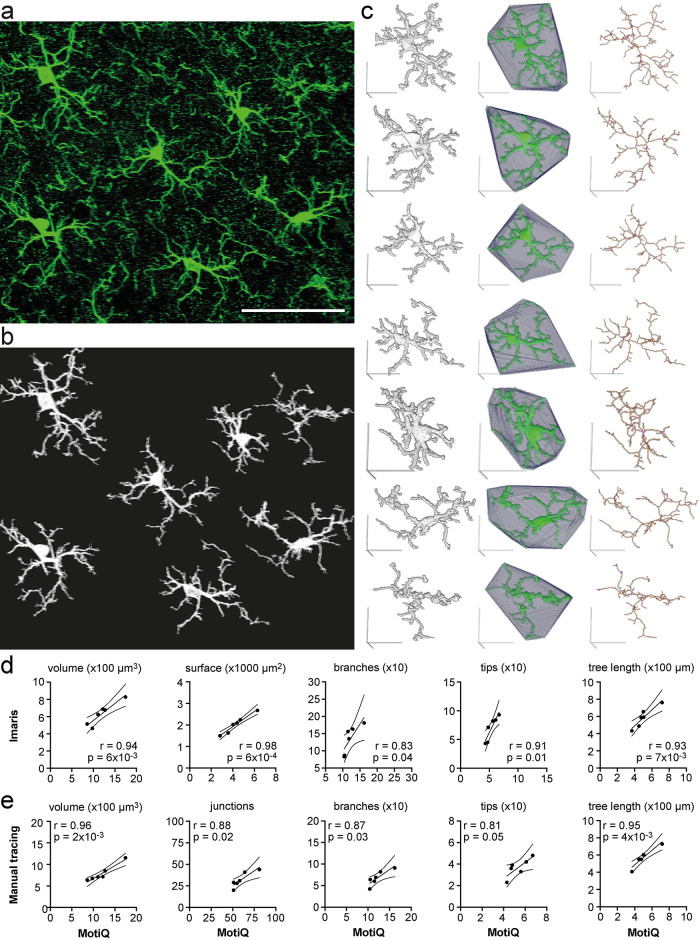
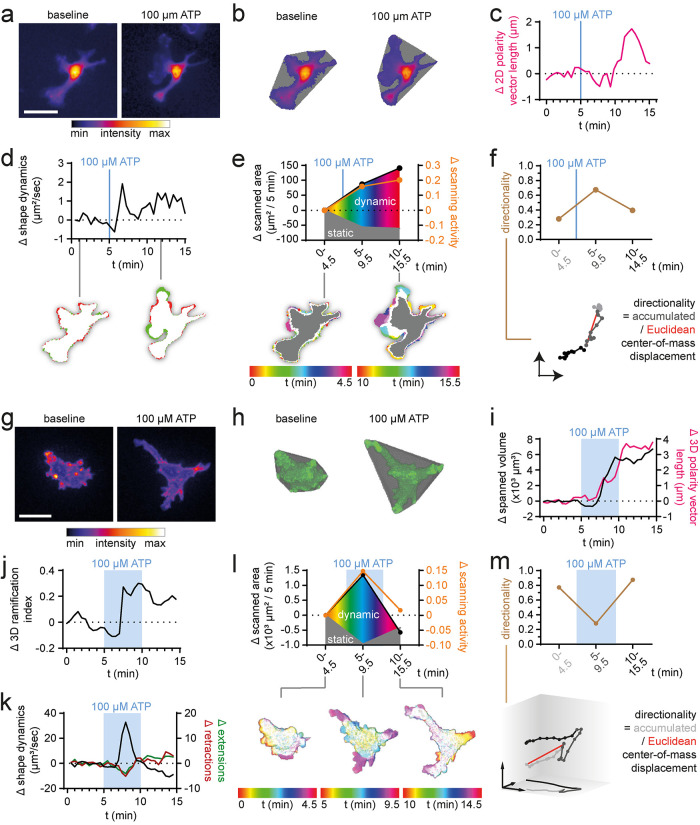
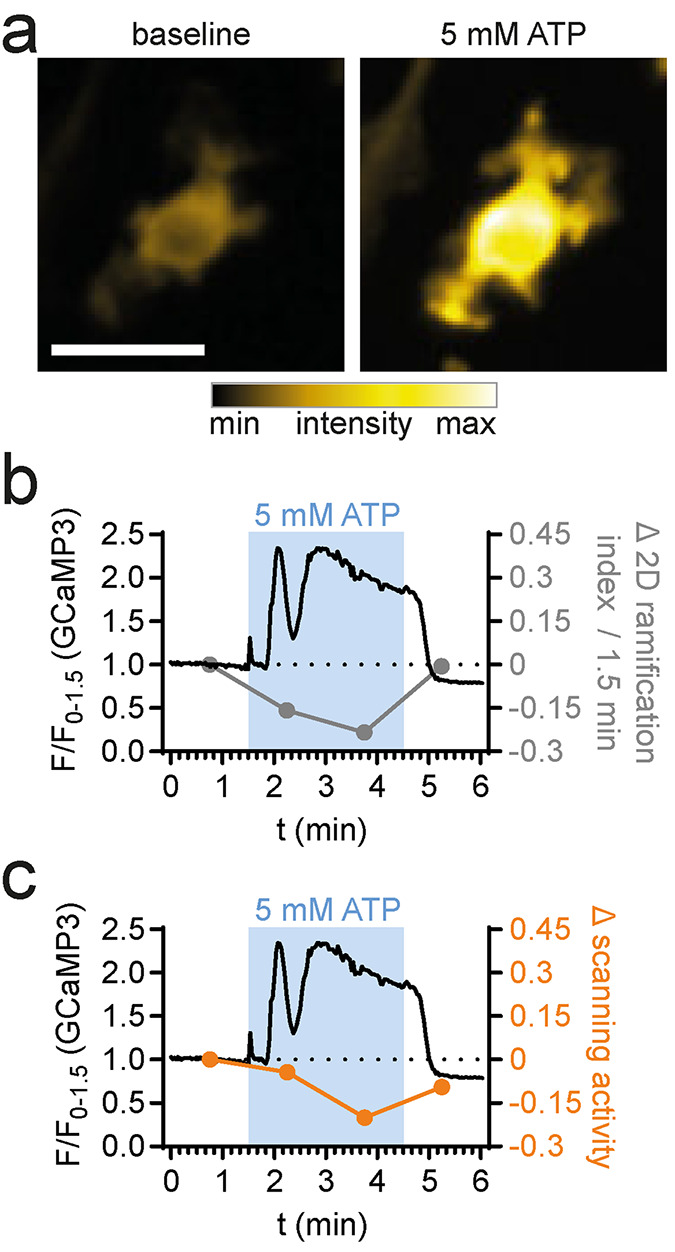
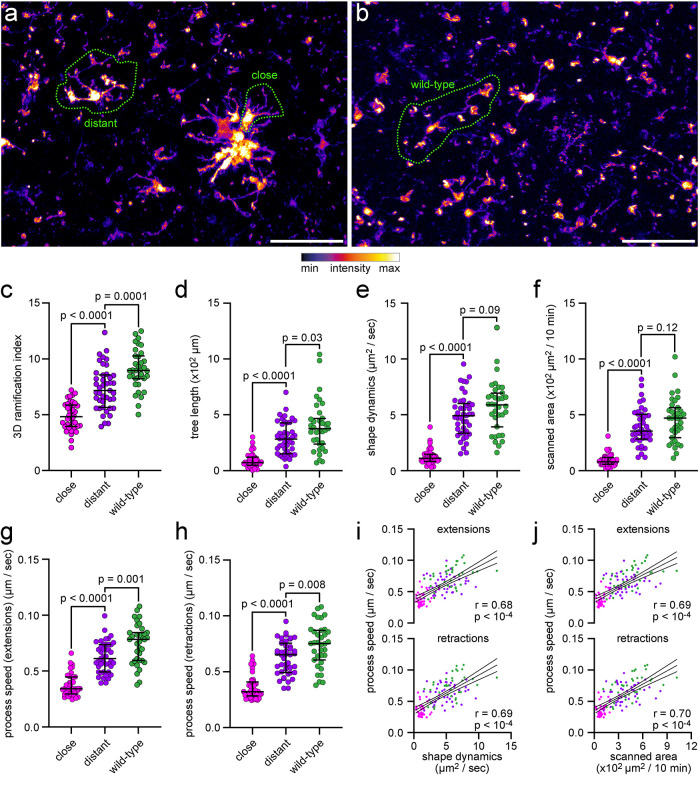
Microglia are the primary resident innate immune cells of the CNS. They possess branched, motile cell processes that are important for their cellular functions. To study the pathways that control microglial morphology and motility under physiological and disease conditions, it is necessary to quantify microglial morphology and motility precisely and reliably. Several image analysis approaches are available for the quantification of microglial morphology and motility. However, they are either not automated, not freely accessible, and/or limited in the number of morphology and motility parameters that can be assessed. Thus, we have developed MotiQ, an open-source, freely accessible software for automated quantification of microglial motility and morphology. MotiQ allows quantification of a diverse set of cellular motility and morphology parameters, including the parameters that have become the gold standard in the microglia field. We demonstrate that MotiQ can be applied to in vivo, ex vivo, and in vitro data from confocal, epifluorescence, or two-photon microscopy, and we compare its results to other analysis approaches. We suggest MotiQ as a versatile and customizable tool to study microglia.


Figures

FIGURE 1:
FIGURE 1:
MotiQ workflow. MotiQ offers two main approaches for microglial cell analysis: (a) 2D time-lapse image analysis and (b) analysis of 3D time-lapse image stacks. Both workflows are composed of three steps: single-cell selection with MotiQ cropper, image segmentation with MotiQ thresholder, and cell quantification using (a) MotiQ 2D analyzer or (b) MotiQ 3D analyzer. Cell volume, cell surface, cell skeleton, and the convex hull of the cell are reconstructed and analyzed and serve as a basis for the calculation of more than 60 parameters of microglial morphology, dynamics, and fluorescence kinetics. MotiQ automatically generates 3D image visualizations by implementing Volume Viewer (ImageJ plug-in by Kai Uwe Barthel, Internationale Medieninformatik, HTW Berlin, Berlin, Germany). Scale bars, 20 µm.
FIGURE 2:
FIGURE 2:
Analysis of in vivo two-photon microscopy data. Selected morphological and dynamic parameters of a representative cortical microglial cell in CX3CR1GFP/wt mice imaged with in vivo two-photon microscopy and analyzed with MotiQ: (a) 2D ramification index, (b) 3D ramification index, (c, d) number of tips, number of branches, and process tree length, (e, f) spanned area or spanned volume and cell polarity vector length (5× magnified for better visualization), (g, h) shape dynamics and number of extensions and retractions as parameter for cell shape alteration, and (i, j) scanned area or scanned volume represent the brain area or brain volume that has been occupied by a microglial cell over a selected time span (here 9 min).
FIGURE 3:
FIGURE 3:
Analysis of ex vivo two-photon microscopy data. 2D and 3D analysis of microglial morphology and dynamics in ex vivo two-photon microscopy data of a representative microglial cell in acute cerebral slices of CX3CR1EGFP/wt mice before and after perfusion with 100 µM ATP (blue boxes). (a, b) Spanned area (2D) or volume (3D) before (t = 5 min) and during (t = 45 min) ATP perfusion. (c, d) Ramifi­cation index, (e, f) tree length, number of tips, and number of branches, (g, h) spanned area (2D) or volume (3D), cell polarity vector length, (i, j) shape dynamics, number of extensions and retractions, and (k, l) scanned area (2D) or volume (3D) during ATP perfusion. Scale bar, 20 µm.
FIGURE 4:
FIGURE 4:
Analysis of cellular morphology in tissue sections. Maximum-intensity projections of confocal z stacks of an (a) Iba1-labeled murine cortical microglial cell, (e) Iba1-labeled murine retinal microglial cell, (i) hippocampal GFAP-labeled murine astrocyte, and (m) Iba1-labeled human microglial cell. 2D or 3D images of (b, f, j, n) reconstructed cell, (c, g, k, o) spanned volume (3D) or spanned area (2D), and (d, h, l, p) cell skeleton illustrating selected morphology parameters of a, e, i, and m analyzed with MotiQ. Scale bars, 20 µm.
FIGURE 5:
FIGURE 5:
Fully automated analysis of cellular morphology in tissue sections. (a) Maximum-intensity projection of a confocal z stack of Iba1-labeled murine cortical microglia. Scale bar, 50 µm. (b) Maximum-intensity projection of automatically detected cells after analyzing (a) with MotiQ 3D analyzer (using a high size threshold [of 10,000 voxels] to reconstruct cells that are moreover complete in the stack). (c) MotiQ visualizations of each cell: reconstructed cell (left), spanned volume (middle), and cell skeleton (right). Scale bars, 20 µm. (d, e) Direct comparison of the results obtained with MotiQ (c) to results obtained using (d) an alternative automated approach based on the commercial software Imaris or (e) a manual approach using the Fiji plug-in Simple Neurite Tracer (Arshadi et al., 2021). Each data point represents one cell. MotiQ results are indicated on the x-axis. Imaris (d) or manual tracing (e) results are indicated on the y-axis. Lines show mean and 95% confidence interval of a linear regression. r and p values for a Pearson correlation are indicated. Note: Imaris and the manual approach did not allow detection of the top right cell in the image (a), as the cell body is not completely within the stack. Thus, this cell is missing in the correlations.
FIGURE 6:
FIGURE 6:
Analysis of 2D- and 3D-cultured microglia. (a–f) MotiQ 2D analysis of epifluorescence time-lapse images of a representative primary microglial cell from CX3CR1eGFP/+ mice, cultured in a 2D culture system. (a) False-colored fluorescence intensity images and (b) spanned area before (t = 0 min) and after (t = 11 min 30 s) addition of ATP (100 μM). (c) Cell polarity, (d) shape dynamics, (e) scanned area, scanning activity, and (f) directionality (=accumulated/Euclidean center of mass displacement) of a selected microglial cell after addition of ATP. (g–m) MotiQ 3D analysis of spinning-disk confocal time-lapse images of a representative primary murine microglial cell from Lifeact–GFP+/− mice, cultured in a 3D Matrigel culture system. (g) Maximum-intensity projection images during baseline recording (t = 0 min) and ATP (t = 9 min 30 s) perfusion. (h, i) Spanned volume, (i) polarity vector, (j) 3D ramification index, (k) shape dynamics, (l) scanned area and scanning activity, and (m) directionality. Insets visualize selected measurements. Scale bar, 20 µm.
FIGURE 7:
FIGURE 7:
Correlative analysis of morphology, dynamics, and fluorescence kinetics in cultured macrophages. MotiQ 2D analysis of epifluorescent time-lapse images of a 2D-cultured bone marrow–derived macrophage, expressing the genetically encoded calcium sensor GCaMP3. (a) False-colored fluorescence intensity images before and during perfusion with ATP (5 mM). Calcium signals were recorded for 90 s before perfusion with ATP (180 s) and washout. (b, c) Upon ATP perfusion, a calcium signal was detected and temporally correlated to changes in the cell’s (b) 2D ramification index and (c) scanned area. Scale bar, 20 µm.
FIGURE 8:
FIGURE 8:
Analysis of microglial morphology and dynamics in a cerebral amyloidosis mouse model of AD. Analysis of microglial morphology and dynamics in ex vivo two-photon microscopy data of microglia in acute cerebral slices of APP/PS1 CX3CR1EGFP/wt mice or wild-type CX3CR1EGFP/wt. (a, b) Maximum-intensity projection of images from (a) APP/PS1 CX3CR1EGFP/wt mice or (b) wild-type CX3CR1EGFP/wt mice. Scale bar, 50 µm. (c) Ramification index and (d) tree length, determined by MotiQ 3D analysis. (e) Shape dynamics and (f) scanned area, determined by MotiQ 2D analysis. (g–j) To verify the parameter results for shape dynamics and scanned area, for each analyzed cell, all visible processes were also manually tracked in 2D. Based on this tracking, for each cell, the average process speed of (g) process extensions or (h) retractions was determined. (i, j) Correlation of the manually determined process speeds with the MotiQ results shape dynamics (i, shape dynamics plotted alone in e) and scanned area (j, scanned area plotted alone in f). Bar plots (c–h) show the median ± interquartile range; individual data points represent individual cells (n = 3 animals per group; close: 9–14 cells per animal, distant: 14–17 cells per animal, wild type: 10–13 cells per animal); p values for a two-sided Mann–Whitney test are indicated. Data points in (i) and (j) also represent individual cells and are colored as in (c–h). Magenta: plaque-close cells. Purple: plaque-distant cells. Dark green: wild-type cells. Lines show mean and 95% confidence interval of a linear regression. r and p values for a Pearson correlation are indicated.

References

    1. Abdolhoseini M, Walker F, Johnson S (2016). Automated tracing of microglia using multilevel thresholding and minimum spanning trees. Annu Int Conf IEEE Eng Med Biol Soc 2016, 1208–1211. - PubMed
    1. Arganda-Carreras I, Fernández-González R, Muñoz-Barrutia A, Ortiz-De-Solorzano C (2010). 3D reconstruction of histological sections: application to mammary gland tissue. Microsc Res Tech 73, 1019–1029. - PubMed
    1. Arshadi C, Günther U, Eddison M, Harrington KIS, Ferreira TA (2021). SNT: a unifying toolbox for quantification of neuronal anatomy. Nat Methods 18, 374–377. - PubMed
    1. Badimon A, Strasburger HJ, Ayata P, Chen X, Nair A, Ikegami A, Hwang P, Chan AT, Graves SM, Uweru JO (2020). Negative feedback control of neuronal activity by microglia. Nature 586, 417–423. - PMC - PubMed
    1. Baron R, Babcock AA, Nemirovsky A, Finsen B, Monsonego A (2014). Accelerated microglial pathology is associated with Aβ plaques in mouse models of Alzheimer’s disease. Aging Cell 13, 584–595. - PMC - PubMed

Publication types

MeSH terms

LinkOut - more resources