

An open-access database of infectious disease transmission trees to explore superspreader epidemiology
- PMID: 35731837
- PMCID: PMC9255728
- DOI: 10.1371/journal.pbio.3001685
An open-access database of infectious disease transmission trees to explore superspreader epidemiology
Abstract
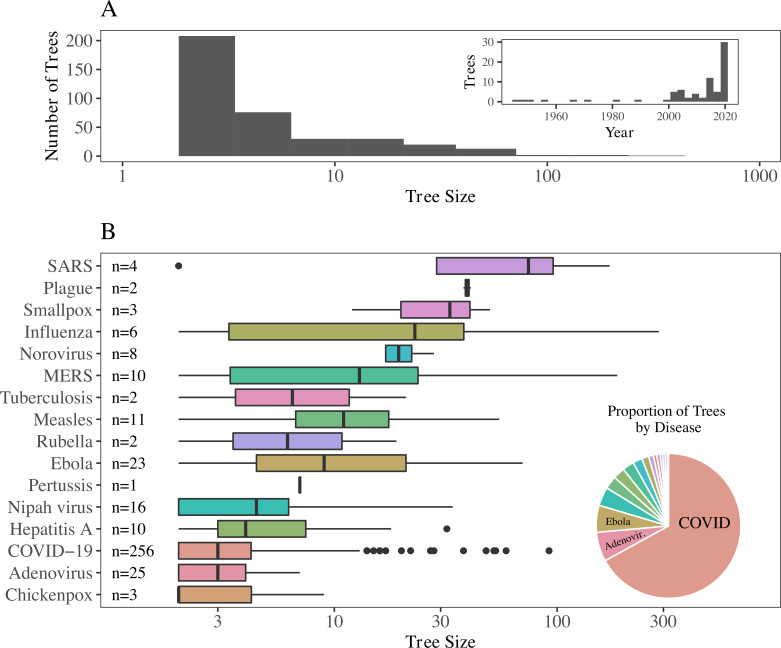
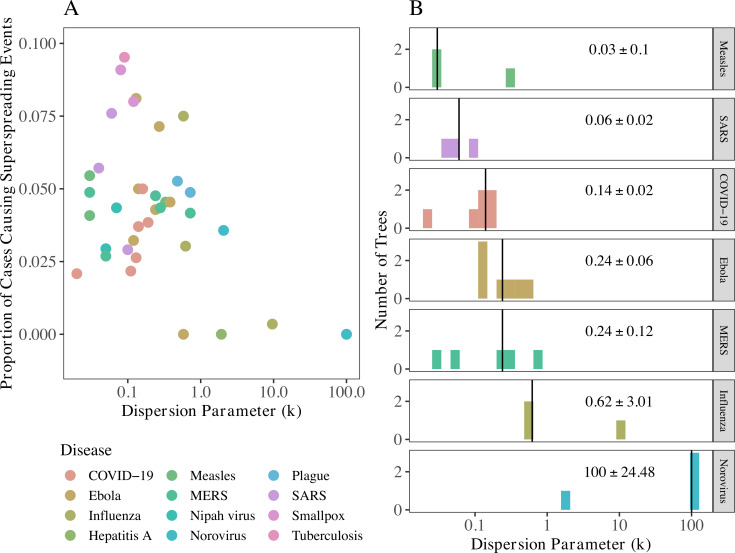
Historically, emerging and reemerging infectious diseases have caused large, deadly, and expensive multinational outbreaks. Often outbreak investigations aim to identify who infected whom by reconstructing the outbreak transmission tree, which visualizes transmission between individuals as a network with nodes representing individuals and branches representing transmission from person to person. We compiled a database, called OutbreakTrees, of 382 published, standardized transmission trees consisting of 16 directly transmitted diseases ranging in size from 2 to 286 cases. For each tree and disease, we calculated several key statistics, such as tree size, average number of secondary infections, the dispersion parameter, and the proportion of cases considered superspreaders, and examined how these statistics varied over the course of each outbreak and under different assumptions about the completeness of outbreak investigations. We demonstrated the potential utility of the database through 2 short analyses addressing questions about superspreader epidemiology for a variety of diseases, including Coronavirus Disease 2019 (COVID-19). First, we found that our transmission trees were consistent with theory predicting that intermediate dispersion parameters give rise to the highest proportion of cases causing superspreading events. Additionally, we investigated patterns in how superspreaders are infected. Across trees with more than 1 superspreader, we found preliminary support for the theory that superspreaders generate other superspreaders. In sum, our findings put the role of superspreading in COVID-19 transmission in perspective with that of other diseases and suggest an approach to further research regarding the generation of superspreaders. These data have been made openly available to encourage reuse and further scientific inquiry.
Conflict of interest statement
The authors have declared that no competing interests exist.
Figures


Similar articles
-
Positive feedback loops exacerbate the influence of superspreaders in disease transmission.iScience. 2023 Apr 11;26(5):106618. doi: 10.1016/j.isci.2023.106618. eCollection 2023 May 19. iScience. 2023. PMID: 37250299 Free PMC article.
-
Evidence that coronavirus superspreading is fat-tailed.Proc Natl Acad Sci U S A. 2020 Nov 24;117(47):29416-29418. doi: 10.1073/pnas.2018490117. Epub 2020 Nov 2. Proc Natl Acad Sci U S A. 2020. PMID: 33139561 Free PMC article.
-
Superspreaders: A Lurking Danger in the Community.J Prim Care Community Health. 2021 Jan-Dec;12:2150132720987432. doi: 10.1177/2150132720987432. J Prim Care Community Health. 2021. PMID: 33448254 Free PMC article.
-
Review: Evaluation of Foot-and-Mouth Disease Control Using Fault Tree Analysis.Transbound Emerg Dis. 2015 Jun;62(3):233-44. doi: 10.1111/tbed.12116. Epub 2013 Jun 28. Transbound Emerg Dis. 2015. PMID: 23809890 Review.
-
On the nature of the superspreaders.Adv Colloid Interface Sci. 2019 Jan;263:1-18. doi: 10.1016/j.cis.2018.10.006. Epub 2018 Nov 15. Adv Colloid Interface Sci. 2019. PMID: 30471569 Review.
Cited by
-
Exact calculation of end-of-outbreak probabilities using contact tracing data.J R Soc Interface. 2023 Dec;20(209):20230374. doi: 10.1098/rsif.2023.0374. Epub 2023 Dec 13. J R Soc Interface. 2023. PMID: 38086402 Free PMC article.
-
Impact of cross-border-associated cases on the SARS-CoV-2 epidemic in Switzerland during summer 2020 and 2021.Epidemics. 2022 Dec;41:100654. doi: 10.1016/j.epidem.2022.100654. Epub 2022 Nov 17. Epidemics. 2022. PMID: 36444785 Free PMC article.
-
Population genetic models for the spatial spread of adaptive variants: A review in light of SARS-CoV-2 evolution.PLoS Genet. 2022 Sep 22;18(9):e1010391. doi: 10.1371/journal.pgen.1010391. eCollection 2022 Sep. PLoS Genet. 2022. PMID: 36137003 Free PMC article. Review.
-
Positive feedback loops exacerbate the influence of superspreaders in disease transmission.iScience. 2023 Apr 11;26(5):106618. doi: 10.1016/j.isci.2023.106618. eCollection 2023 May 19. iScience. 2023. PMID: 37250299 Free PMC article.
-
Quantifying the value of viral genomics when inferring who infected whom in the 2014-16 Ebola virus outbreak in Guinea.Virus Evol. 2023 Mar 7;9(1):vead007. doi: 10.1093/ve/vead007. eCollection 2023. Virus Evol. 2023. PMID: 36926449 Free PMC article.
References
Publication types
MeSH terms
Associated data
LinkOut - more resources
Full Text Sources
Other Literature Sources
Medical
