. 2022 Jun 24;8(25):eabn5803.
doi: 10.1126/sciadv.abn5803. Epub 2022 Jun 22.

Cortical-subcortical structural connections support transcranial magnetic stimulation engagement of the amygdala

Affiliations

Cortical-subcortical structural connections support transcranial magnetic stimulation engagement of the amygdala

Valerie J Sydnor et al. Sci Adv. .

Abstract

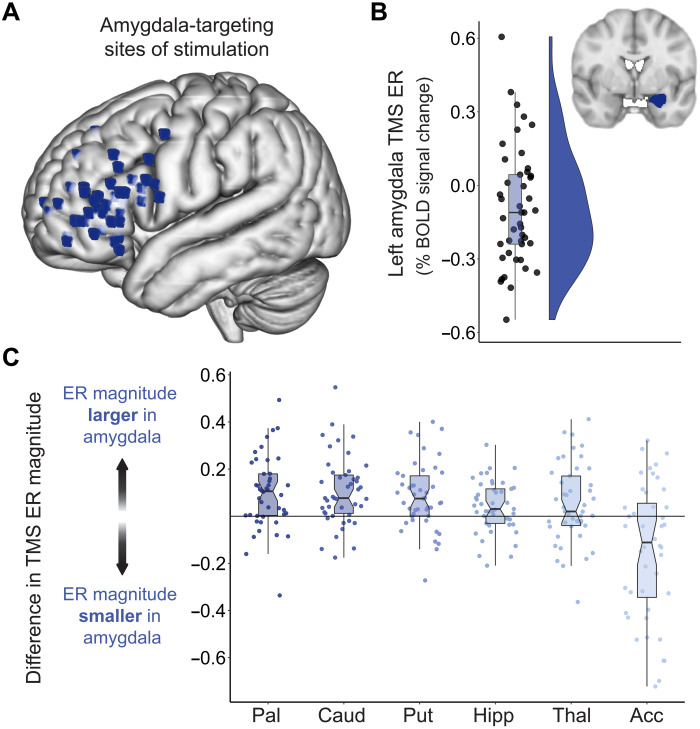
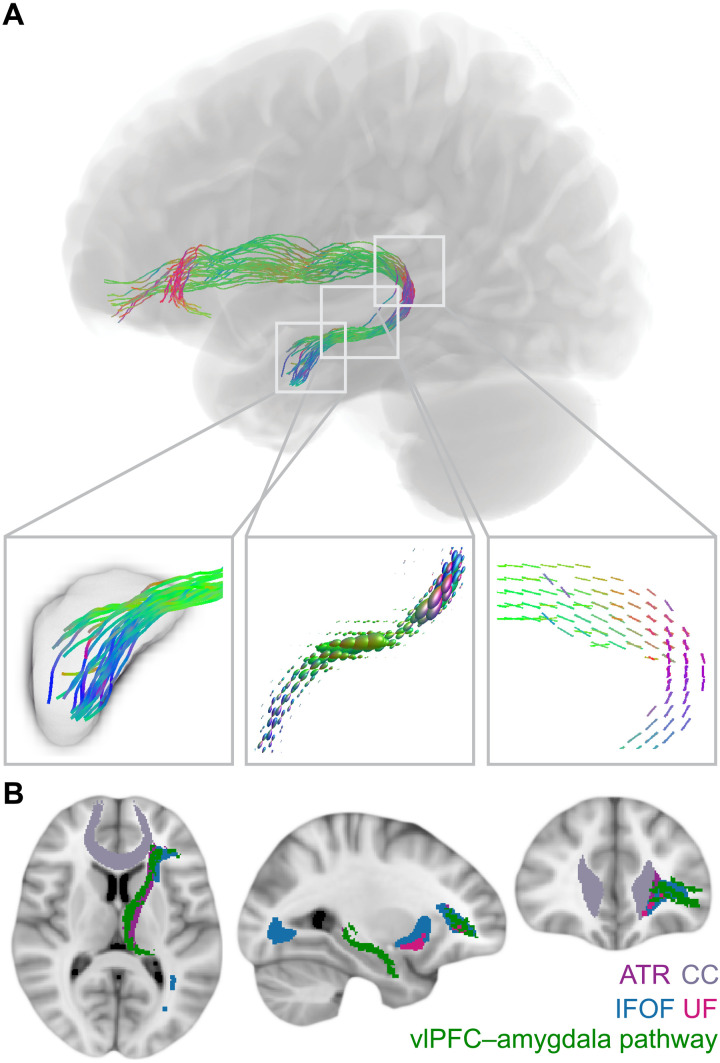
The amygdala processes valenced stimuli, influences emotion, and exhibits aberrant activity across anxiety disorders, depression, and PTSD. Interventions modulating amygdala activity hold promise as transdiagnostic psychiatric treatments. In 45 healthy participants, we investigated whether transcranial magnetic stimulation (TMS) elicits indirect changes in amygdala activity when applied to ventrolateral prefrontal cortex (vlPFC), a region important for emotion regulation. Harnessing in-scanner interleaved TMS/functional MRI (fMRI), we reveal that vlPFC neurostimulation evoked acute and focal modulations of amygdala fMRI BOLD signal. Larger TMS-evoked changes in the amygdala were associated with higher fiber density in a vlPFC-amygdala white matter pathway when stimulating vlPFC but not an anatomical control, suggesting this pathway facilitated stimulation-induced communication between cortex and subcortex. This work provides evidence of amygdala engagement by TMS, highlighting stimulation of vlPFC-amygdala circuits as a candidate treatment for transdiagnostic psychopathology. More broadly, it indicates that targeting cortical-subcortical structural connections may enhance the impact of TMS on subcortical neural activity and, by extension, subcortex-subserved behaviors.


Figures

Fig. 1.
Fig. 1.. Multimodal analysis workflows.
spTMS/fMRI: Single pulses of TMS was administered in between fMRI volume acquisitions. TMS pulses were delivered to fMRI-guided, personalized left prefrontal sites of stimulation. Functional time series were analyzed with the FMRI Expert Analysis Tool (FEAT) via eXtensible Connectivity Pipeline (XCP) Engine’s task module; each TMS pulse was modeled as an instantaneous event. TMS evoked responses were quantified in the left amygdala for each participant by averaging event-related BOLD signal changes induced by stimulation. Diffusion MRI: Diffusion data were preprocessed with QSIPrep. Preprocessed images were reconstructed with MRtrix’s single-shell three-tissue constrained spherical deconvolution pipeline to generate FOD images. A whole-brain tractogram was then generated with FOD tractography. A structural pathway connecting the left amygdala to the prefrontal area of TMS stimulation was isolated, and pathway fiber density was quantified.
Fig. 2.
Fig. 2.. Amygdala BOLD signal change following TMS administered to vlPFC connectivity peaks.
(A) Each participant’s amygdala-targeting TMS stimulation site visualized in standard (MNI) space. Individual-specific stimulation sites were localized to a left prefrontal area that was strongly functionally connected to the left amygdala and that was located directly within the vlPFC, or in closest proximity to the vlPFC of all connectivity peaks. (B) TMS elicited a sizable fMRI response in the ipsilateral amygdala. The signed TMS evoked response (TMS ER) in the left amygdala is plotted for all participants, along with corresponding box and violin plots. TMS pulses delivered to connectivity-informed stimulation sites decreased BOLD signal in the amygdala for most participants, as indicated by negative TMS ERs. (C) To assess whether amygdala-targeted TMS elicited larger functional responses in the left amygdala than in non-targeted subcortical structures, the magnitude of the TMS ER was compared between the amygdala and the left pallidum (Pal), caudate (Caud), putamen (Put), hippocampus (Hipp), thalamus (Thal), and nucleus accumbens (Acc). For each participant, the absolute valued TMS ER in these six control structures was subtracted from the absolute valued TMS ER in the amygdala, and the difference in TMS ER magnitude was plotted. Data points falling above the y = 0 line indicate that a participant had a larger amplitude TMS ER in the amygdala than in the indicated subcortical region.
Fig. 3.
Fig. 3.. vlPFC–amygdala white matter pathway anatomy.
(A) A white matter pathway connecting the left vlPFC stimulation area to the left amygdala could provide a structural scaffold for downstream modulation of the amygdala. This pathway was identified from FOD tractography, and pathway streamlines were mapped to individual fiber bundle elements (fixels) for the calculation of fiber density. The left box displays pathway streamlines terminating in the amygdala. The center box displays pathway FODs scaled by fiber density. The right box displays pathway fixels. Colors represent the fiber direction. (B) vlPFC–amygdala white matter pathway trajectory. The identified vlPFC–amygdala pathway is depicted in green overlaid on four major white matter tracts from the JHU ICBM tract atlas including the anterior thalamic radiation (ATR), the corpus callosum (CC), the inferior fronto-occipital fasciculus (IFOF), and the uncinate fasciculus (UF).
Fig. 4.
Fig. 4.. White matter pathway fiber density affects amygdala TMS evoked responses.
(A) Across all participants, higher vlPFC–amygdala white matter pathway fiber density was associated with greater absolute valued TMS evoked response (TMS ER) magnitude in the left amygdala. Dark purple circles represent participants that exhibited a negative TMS ER; lighter purple circles represent those that exhibited a positive TMS ER. (B) Higher vlPFC–amygdala pathway fiber density was associated with a greater decrease in BOLD signal in individuals that exhibited a negative TMS ER (dark purple) and a greater increase in BOLD signal in individuals that exhibited a positive TMS ER (light purple). (C) In addition to the primary spTMS/fMRI scan during which TMS was applied to amygdala-targeting sites near the vlPFC, each participant received an additional spTMS/fMRI scan during which TMS pulses were applied to a secondary active site used in a pathway control analysis. The intensity-weighted center of gravity of all personalized stimulation sites is shown for vlPFC sites (purple) and active control sites (green). (D) The strength of the association (rho) between vlPFC–amygdala pathway fiber density and left amygdala TMS ER magnitude was substantially smaller when TMS was applied to active control sites located distant from pathway end points.

References

    1. Gründemann J., Bitterman Y., Lu T., Krabbe S., Grewe B. F., Schnitzer M. J., Lüthi A., Amygdala ensembles encode behavioral states. Science 364, eaav8736 (2019). - PubMed
    1. Janak P. H., Tye K. M., From circuits to behaviour in the amygdala. Nature 517, 284–292 (2015). - PMC - PubMed
    1. Pignatelli M., Beyeler A., Valence coding in amygdala circuits. Curr. Opin. Behav. Sci. 26, 97–106 (2019). - PMC - PubMed
    1. Adhikari A., Lerner T. N., Finkelstein J., Pak S., Jennings J. H., Davidson T. J., Ferenczi E., Gunaydin L. A., Mirzabekov J. J., Ye L., Kim S.-Y., Lei A., Deisseroth K., Basomedial amygdala mediates top–down control of anxiety and fear. Nature 527, 179–185 (2015). - PMC - PubMed
    1. Agustín-Pavón C., Braesicke K., Shiba Y., Santangelo A. M., Mikheenko Y., Cockroft G., Asma F., Clarke H., Man M.-S., Roberts A. C., Lesions of ventrolateral prefrontal or anterior orbitofrontal cortex in primates heighten negative emotion. Biol. Psychiatry 72, 266–272 (2012). - PubMed