. 2022 Jun 24;8(25):eabm6385.
doi: 10.1126/sciadv.abm6385. Epub 2022 Jun 22.

Subcritical escape waves in schooling fish

Affiliations

Subcritical escape waves in schooling fish

Winnie Poel et al. Sci Adv. .

Abstract

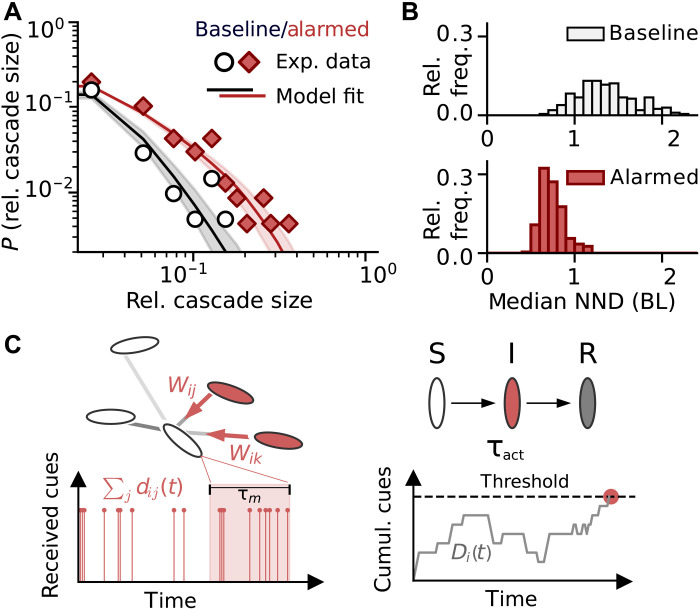
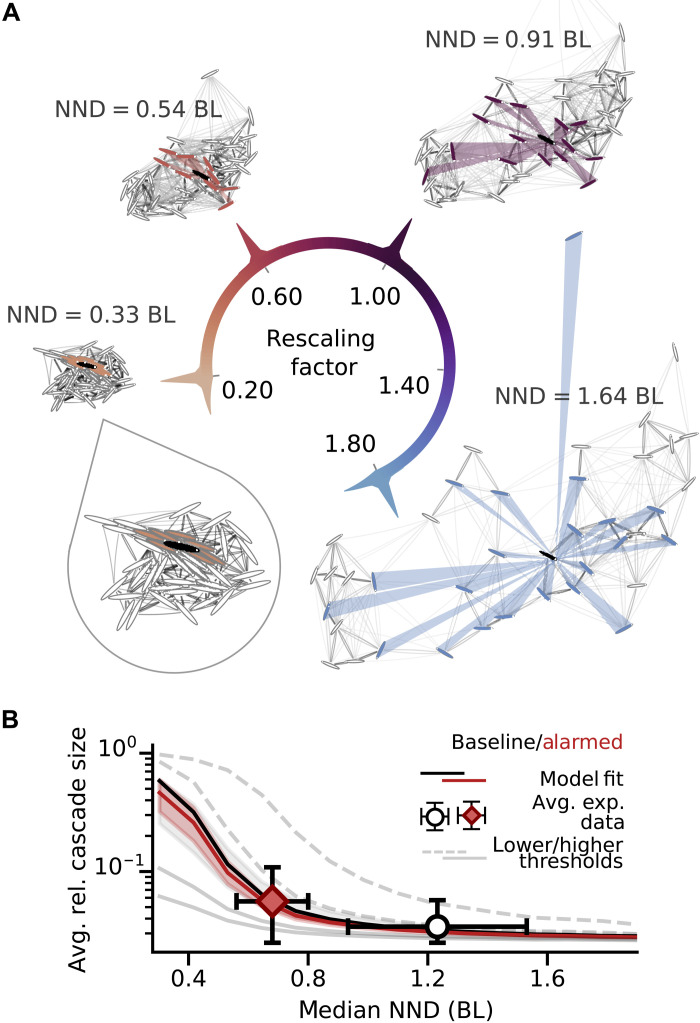
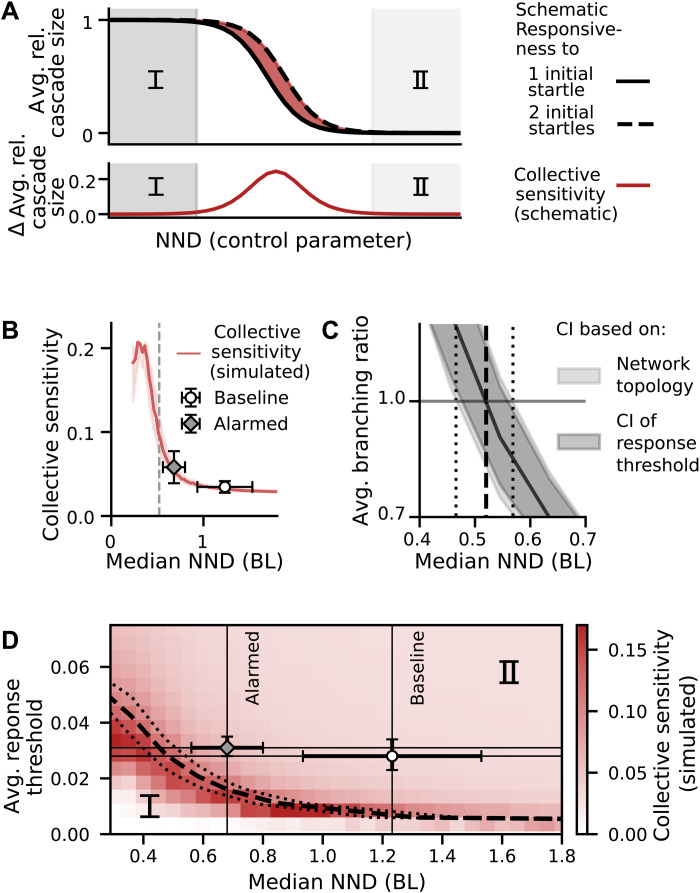
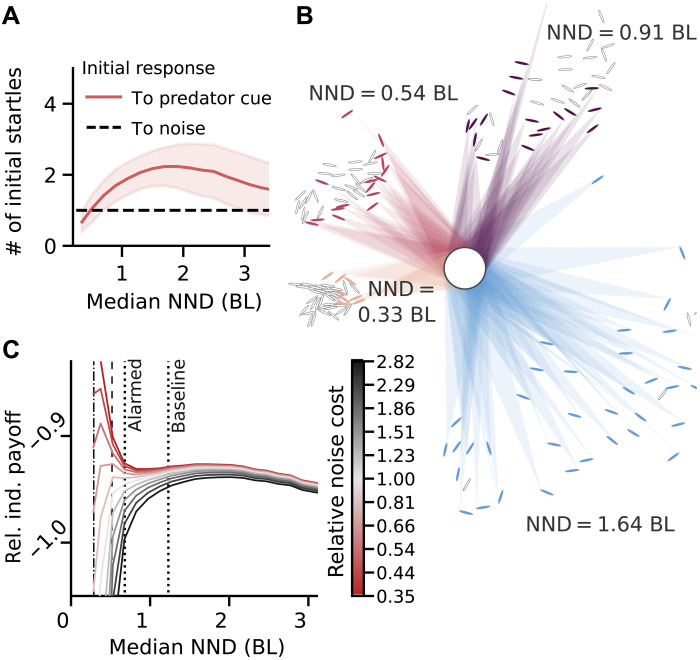
Theoretical physics predicts optimal information processing in living systems near transitions (or pseudo-critical points) in their collective dynamics. However, focusing on potential benefits of proximity to a critical point, such as maximal sensitivity to perturbations and fast dissemination of information, commonly disregards possible costs of criticality in the noisy, dynamic environmental contexts of biological systems. Here, we find that startle cascades in fish schools are subcritical (not maximally responsive to environmental cues) and that distance to criticality decreases when perceived risk increases. Considering individuals' costs related to two detection error types, associated to both true and false alarms, we argue that being subcritical, and modulating distance to criticality, can be understood as managing a trade-off between sensitivity and robustness according to the riskiness and noisiness of the environment. Our work emphasizes the need for an individual-based and context-dependent perspective on criticality and collective information processing and motivates future questions about the evolutionary forces that brought about a particular trade-off.


Figures

Fig. 1.
Fig. 1.. Experimental data and computational model.
Key aspects of the baseline and alarmed experimental datasets from (28) (differing in group members’ perceived environmental risk) and model calibration via fitting of the cascade size distribution: (A) Observed cascade size distributions (data points). For increased perceived risk (alarmed, red diamonds), a larger average cascade size is observed. Distributions are summarizing n = 206 (baseline) and n = 232 (alarmed) observations of startle cascades. Our model (solid line) is calibrated on observed cascade sizes via a log-likelihood approach. Solid lines show distributions of relative cascade size obtained from 10,000 model runs with shaded areas indicating the credible interval of the model fit. For more details on the model, refer to Materials and Methods, Fig. 2, and section S2. (B) Histograms characterizing school densities in the datasets via median nearest neighbor distance (NND). For the alarmed condition (red, higher perceived risk), fish are closer to one another. (C) Scheme of SIR-type model dynamics: Observation of social cues over time triggers individual startling response mediated by strength of network links (wij) and individual responsiveness (threshold).
Fig. 2.
Fig. 2.. Predicting cascade sizes across densities via a data-driven computational approach.
(A) Examples of interaction networks obtained from rescaled position data for one experimental startle event with rescaling factors λ ∈ (0.2,0.6,1.0,1.8). The corresponding median NND is noted next to each network. The darkness of lines between individuals represent link strength (>0.01 only, to keep the figure comprehensible). An example visual field [rays originating from a focal individual (black) hitting visible neighbors (colored)] illustrates decrease in number of visible neighbors with increasing density due to occlusions. (B) Model predictions of average relative cascade size (lines) for different response thresholds [high values (solid lines) to low values (dashed lines)] show transition from local to global cascades with decreasing NND. Experimental observations from Fig. 1, summarized here as averages ± 1 SD (error bars, truncated below at 1/N = 0.025 because we use one initial startler and cascades cannot be smaller than this), are best predicted by the black and red curves, respectively, corresponding to the threshold value obtained via fitting the full cascade size distribution (Fig. 1A). Shaded areas are credible intervals of the model fit (gray, baseline; red, alarmed).
Fig. 3.
Fig. 3.. Estimating criticality via maximum sensitivity.
(A) Schematic sketch of transition to illustrate the concept behind (B) and (C). Top: Group responsiveness (average relative cascade size) to one and two initial startlers only differs around the transition (white background), which may enable different collective responses to noise and relevant cues. In both gray areas (I marks the supercritical regime, and II marks the subcritical regime), any cue triggers the same response, making distinction impossible. Bottom: Collective sensitivity, defined as the difference between the group responsiveness to two and one initial startles, shows a peak at the transition. (B) Collective sensitivity as a function of median NND, model predictions averaged over all networks. Shaded areas mark the credible interval of the model fit (see fig. S6). Lines end at low NND where physical bodies limit density. The observed spreading is subcritical with the alarmed condition closer to criticality than the baseline condition as shown by markers with error bars representing simulation result averages over original scale networks (error bars indicate 1 SD). (C) Average branching ratio of fitted model from averaging over networks in bins of median NND (shaded light gray area: ±1 SD, capturing variance in network topology). The confidence interval (CI) of the branching ratio due to uncertainty in the model fit (CI of the response threshold) is indicated in dark gray and comparable to the CI based on the variance in network topology (light gray). Dashed vertical line indicates where b = 1 [also included in (B)]; dotted line indicates uncertainty due to variance in network topology). (D) Collective sensitivity as a function of median NND and average individual response threshold shows a peak close to the analytically estimated critical line [b = 1, line styles as in (C)], separating the subcritical (I) and supercritical (II) regimes. Markers with error bars show averages over simulations on original scale networks and represent the observed schools’ average behavior.
Fig. 4.
Fig. 4.. Hypothetical predator detection model reveals distance to criticality can manage trade-off between two types of errors.
(A) Initial response to predator and noise cue as function of school’s median NND. Initial predator response is given by a fixed fraction of the average number of individuals that can see the predator. (B) Visual predator detection for schools adjusted to have different median NND (stated next to each school). Colored individuals are able to see the predator (white circle). Shaded areas illustrate the visual field similar to Fig. 2A. (C) Relative payoff for an individual in a school in different environments (characterized by relative noise cost) as function of school’s median NND. Averages of experimentally observed school densities are indicated (dotted vertical lines) as well as the estimates of the critical point [b = 1 (dashed line) and maximum sensitivity (black dash-dotted vertical line)]. Depending on the environment, different values of NND (i.e., different distances from criticality) maximize payoff. In risky environments (red), being highly responsive is more important than filtering, while in very noisy low-risk environments, being critical is detrimental to the payoff (black curves). For intermediate values of relative noise cost (light gray/red), there are two maxima: one based on maximum sensitivity at criticality (left) and one based on maximum personal visual access to the predator (right). Parameters: pdetect = 0.1, dpred = 10 BL, and dmax = 40 BL.

References

    1. Karlebach G., Shamir R., Modelling and analysis of gene regulatory networks. Nat. Rev. Mol. Cell Biol. 9, 770–780 (2008). - PubMed
    1. Bassett D. S., Bullmore E., Small-world brain networks. Neuroscientist 12, 512–523 (2006). - PubMed
    1. Mora T., Bialek W., Are biological systems poised at criticality? J. Stat. Phys. 144, 268–302 (2011).
    1. J. Krause, G. D. Ruxton, Living in Groups (Oxford Univ. Press, 2002).
    1. A. Ward, M. Webster, Sociality: The Behavior of Group-Living Animals (Springer Nature, 2016).