

Variation in the Substitution Rates among the Human Mitochondrial Haplogroup U Sublineages
- PMID: 35731946
- PMCID: PMC9250076
- DOI: 10.1093/gbe/evac097
Variation in the Substitution Rates among the Human Mitochondrial Haplogroup U Sublineages
Abstract
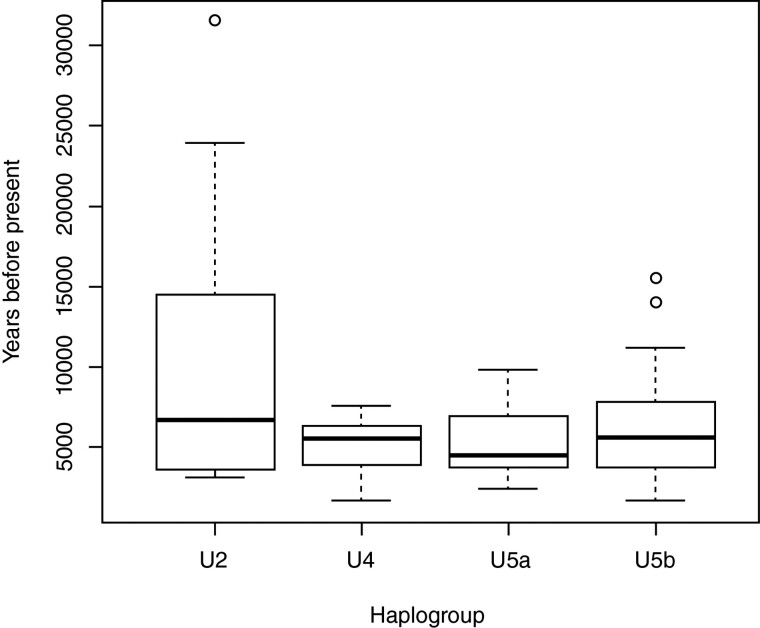
Resolving the absolute timescale of phylogenetic trees stipulates reliable estimates for the rate of DNA sequence evolution. For this end, various calibration methods have been developed and studied intensively. Intraspecific rate variation among distinct genetic lineages, however, has gained less attention. Here, we have assessed lineage-specific molecular rates of human mitochondrial DNA (mtDNA) by performing tip-calibrated Bayesian phylogenetic analyses. Tip-calibration, as opposed to traditional nodal time stamps from dated fossil evidence or geological events, is based on sample ages and becoming ever more feasible as ancient DNA data from radiocarbon-dated samples accumulate. We focus on subhaplogroups U2, U4, U5a, and U5b, the data including ancient mtDNA genomes from 14C-dated samples (n = 234), contemporary genomes (n = 301), and two outgroup sequences from haplogroup R. The obtained molecular rates depended on the data sets (with or without contemporary sequences), suggesting time-dependency. More notable was the rate variation between haplogroups: U4 and U5a stand out having a substantially higher rate than U5b. This is also reflected in the divergence times obtained (U5a: 17,700 years and U5b: 29,700 years), a disparity not reported previously. After ruling out various alternative causes (e.g., selection, sampling, and sequence quality), we propose that the substitution rates have been influenced by demographic histories, widely different among populations where U4/U5a or U5b are frequent. As with the Y-chromosomal subhaplogroup R1b, the mitochondrial U4 and U5a have been associated with remarkable range extensions of the Yamnaya culture in the Bronze Age.
Keywords: ancient DNA; demography; haplogroup U; mitochondrial DNA; substitution rate variation; time-dependence; tip-calibration.
© The Author(s) 2022. Published by Oxford University Press on behalf of Society for Molecular Biology and Evolution.
Figures


Similar articles
-
Genetic diversity among ancient Nordic populations.PLoS One. 2010 Jul 30;5(7):e11898. doi: 10.1371/journal.pone.0011898. PLoS One. 2010. PMID: 20689597 Free PMC article.
-
Whole-mtDNA genome sequence analysis of ancient African lineages.Mol Biol Evol. 2007 Mar;24(3):757-68. doi: 10.1093/molbev/msl209. Epub 2006 Dec 28. Mol Biol Evol. 2007. PMID: 17194802
-
A revised timescale for human evolution based on ancient mitochondrial genomes.Curr Biol. 2013 Apr 8;23(7):553-559. doi: 10.1016/j.cub.2013.02.044. Epub 2013 Mar 21. Curr Biol. 2013. PMID: 23523248 Free PMC article.
-
Inferences from tip-calibrated phylogenies: a review and a practical guide.Mol Ecol. 2016 May;25(9):1911-24. doi: 10.1111/mec.13586. Epub 2016 Apr 20. Mol Ecol. 2016. PMID: 26880113 Free PMC article. Review.
-
Problems and Cautions With Sequence Mismatch Analysis and Bayesian Skyline Plots to Infer Historical Demography.J Hered. 2015 Jul-Aug;106(4):333-46. doi: 10.1093/jhered/esv020. Epub 2015 Apr 29. J Hered. 2015. PMID: 25926628 Review.
Cited by
-
Mitochondrial DNA in Human Diversity and Health: From the Golden Age to the Omics Era.Genes (Basel). 2023 Jul 27;14(8):1534. doi: 10.3390/genes14081534. Genes (Basel). 2023. PMID: 37628587 Free PMC article. Review.
-
The maternal ancestry of the Kavaratti islanders and the last glacial maximum aftermath.Mol Genet Genomics. 2023 Nov;298(6):1467-1477. doi: 10.1007/s00438-023-02072-8. Epub 2023 Oct 12. Mol Genet Genomics. 2023. PMID: 37823939
References
MeSH terms
Substances
LinkOut - more resources
Full Text Sources
Research Materials
