. 2022 Jul 5;94(26):9261-9269.
doi: 10.1021/acs.analchem.2c00413. Epub 2022 Jun 22.

Single-Cell Chemical Proteomics (SCCP) Interrogates the Timing and Heterogeneity of Cancer Cell Commitment to Death

Affiliations

Single-Cell Chemical Proteomics (SCCP) Interrogates the Timing and Heterogeneity of Cancer Cell Commitment to Death

Ákos Végvári et al. Anal Chem. .

Abstract

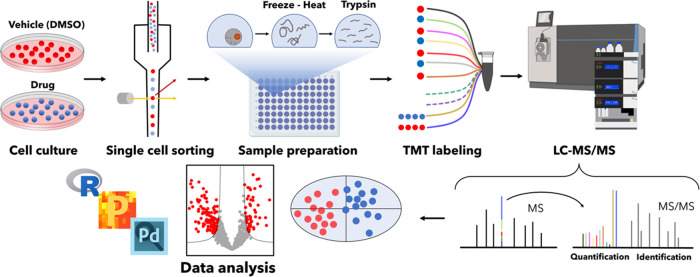
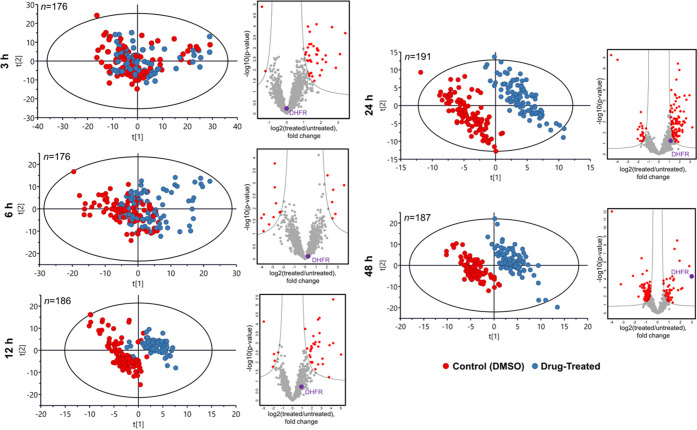
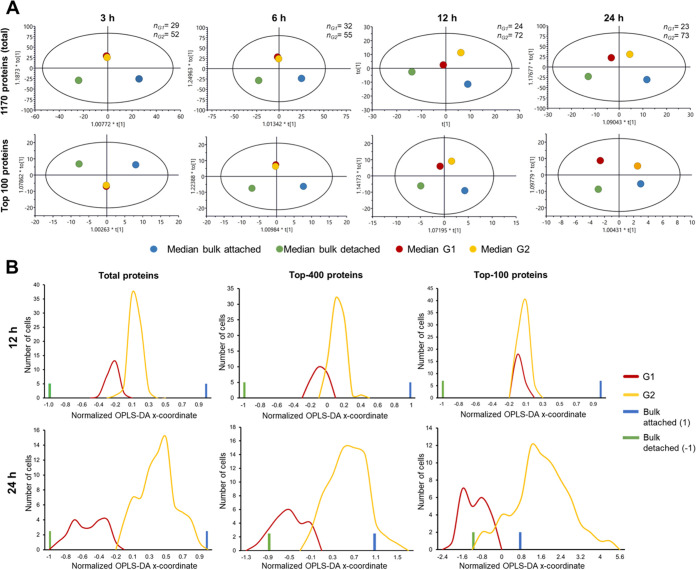
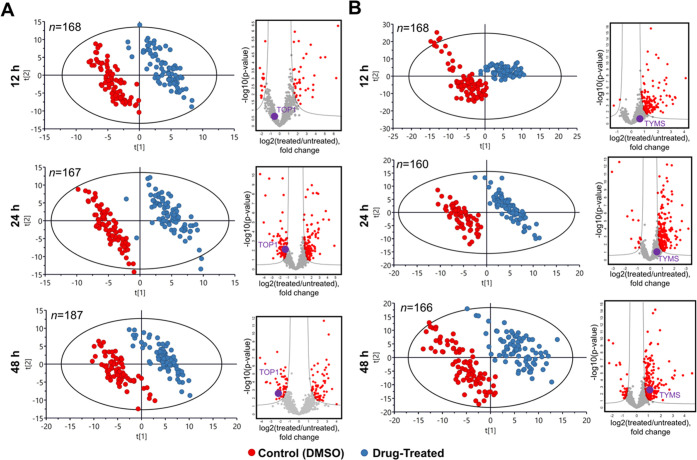
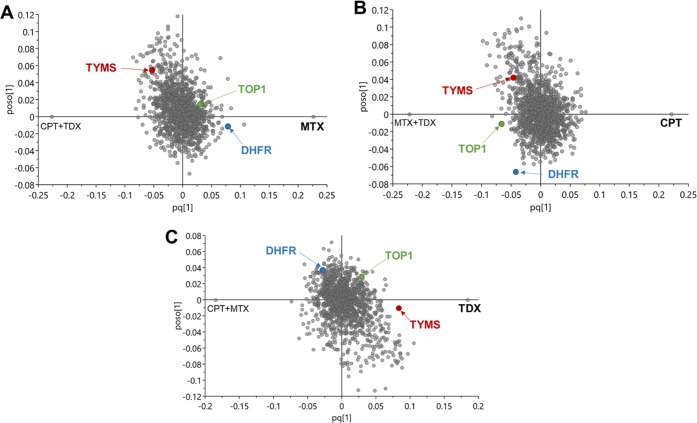
Chemical proteomics studies the effects of drugs upon a cellular proteome. Due to the complexity and diversity of tumors, the response of cancer cells to drugs is also heterogeneous, and thus, proteome analysis at the single-cell level is needed. Here, we demonstrate that single-cell proteomics techniques have become quantitative enough to tackle the drug effects on target proteins, enabling single-cell chemical proteomics (SCCP). Using SCCP, we studied here the time-resolved response of individual adenocarcinoma A549 cells to anticancer drugs methotrexate, camptothecin, and tomudex, revealing the early emergence of cellular subpopulations committed and uncommitted to death. As a novel and useful approach to exploring the heterogeneous response to drugs of cancer cells, SCCP may prove to be a breakthrough application for single-cell proteomics.


Conflict of interest statement

The authors declare no competing financial interest.

Figures

Figure 1
Figure 1
SCCP workflow. The workflow developed for SCCP included cell culturing and treatment with drugs, isolation of individual cells by FACS, protein extraction and digestion, TMT labeling of thus obtained tryptic peptides followed by multiplexing, LC-MS/MS, and statistical data analysis. All steps are optimized for achieving the desired proteome depth and quantitative correlation with bulk analysis. In the figure, the split carrier proteome occupies two channels (131N and 131C) in a TMT11plex set, with two other channels (130N and 130C) remaining empty (dotted lines). Identification of peptides is achieved via matching masses of sequence-specific fragments, and quantification is performed by the abundances of the low-mass TMT reporter ions.
Figure 2
Figure 2
Time-course results upon treatment with methotrexate. PCA plots of single-cell data as a time course demonstrating the emergence of separation between the MTX-treated and untreated attached cells with incubation time, and the corresponding volcano plots of regulated proteins showing the emergence of dihydrofolate reductase (as indicated with a purple dot and DHFR) among the top regulated proteins.
Figure 3
Figure 3
Statistical analysis of single cells treated with methotrexate. (A) OPLS-DA analysis of SCCP data on median protein abundances in G1 and G2 cell groups from MTX-treated single cells at different time points together with bulk abundances for the total proteome (1170 proteins) and top 100 most abundant proteins. The numbers of single cells belonging to G1 and G2 are given at the right top of each plot. (B) Distribution of the main OPLS-DA coordinates of G1 and G2 groups of MTX-treated attached cells at 12 and 24 h past treatment for the total proteome, top 400, and top 100 proteins. The x-coordinates were normalized such that the coordinates of the attached and detached cells’ bulk-analyzed proteomes after 48 h treatment are +1 and −1, respectively.
Figure 4
Figure 4
Time-course results upon treatment with camptothecin and tomudex. PCA plots of SCCP data as a time course demonstrating the emergence separation between the untreated cells and the attached cells treated with (A) camptothecin and (B) tomudex with incubation time and the corresponding volcano plots of regulated proteins (as indicated with a purple dot and TOP1 or TYMS, respectively) showing the emergence of the known drug target among the top regulated proteins.
Figure 5
Figure 5
OPLS-DA analysis. OPLS-DA analysis contrasting the effect of one drug, (A) methotrexate, (B) camptothecin, and (C) tomudex, against the other two drugs, indicating the positions of their target proteins, DHFR, TOP1, and TYMS, respectively.

Similar articles

Cited by

References

    1. Saei A. A.; Sabatier P.; Tokat Ü. G.; Chernobrovkin A.; Pirmoradian M.; Zubarev R. A. Comparative Proteomics of Dying and Surviving Cancer Cells Improves the Identification of Drug Targets and Sheds Light on Cell Life/Death Decisions. Mol. Cell. Proteomics 2018, 17, 1144–1155. 10.1074/mcp.RA118.000610. - DOI - PMC - PubMed
    1. Saei A. A.; Beusch C. M.; Chernobrovkin A.; Sabatier P.; Zhang B.; Tokat Ü. G.; Stergiou E.; Gaetani M.; Végvári Á.; Zubarev R. A. ProTargetMiner as a Proteome Signature Library of Anticancer Molecules for Functional Discovery. Nat. Commun. 2019, 10, 571510.1038/s41467-019-13582-8. - DOI - PMC - PubMed
    1. Gaetani M.; Zubarev R.. New Promises of Chemical Proteomics for Drug Development. In Novel Approaches in Drug Designing & Development, Juniper Publishers Inc., 2017; Vol. 2, pp 12–14.
    1. Moffat J. G.; Vincent F.; Lee J. A.; Eder J.; Prunotto M. Opportunities and Challenges in Phenotypic Drug Discovery: An Industry Perspective. Nat. Rev. Drug Discovery 2017, 16, 531–543. 10.1038/nrd.2017.111. - DOI - PubMed
    1. Ye C.; Ho D. J.; Neri M.; Yang C.; Kulkarni T.; Randhawa R.; Henault M.; Mostacci N.; Farmer P.; Renner S.; Ihry R.; Mansur L.; Keller C. G.; McAllister G.; Hild M.; Jenkins J.; Kaykas A. DRUG-Seq for Miniaturized High-Throughput Transcriptome Profiling in Drug Discovery. Nat. Commun. 2018, 9, 430710.1038/s41467-018-06500-x. - DOI - PMC - PubMed

Publication types