. 2022 Jun 21;39(12):110983.
doi: 10.1016/j.celrep.2022.110983.

Mycobacterium tuberculosis infection drives a type I IFN signature in lung lymphocytes

Affiliations

Mycobacterium tuberculosis infection drives a type I IFN signature in lung lymphocytes

Sadia Akter et al. Cell Rep. .

Abstract

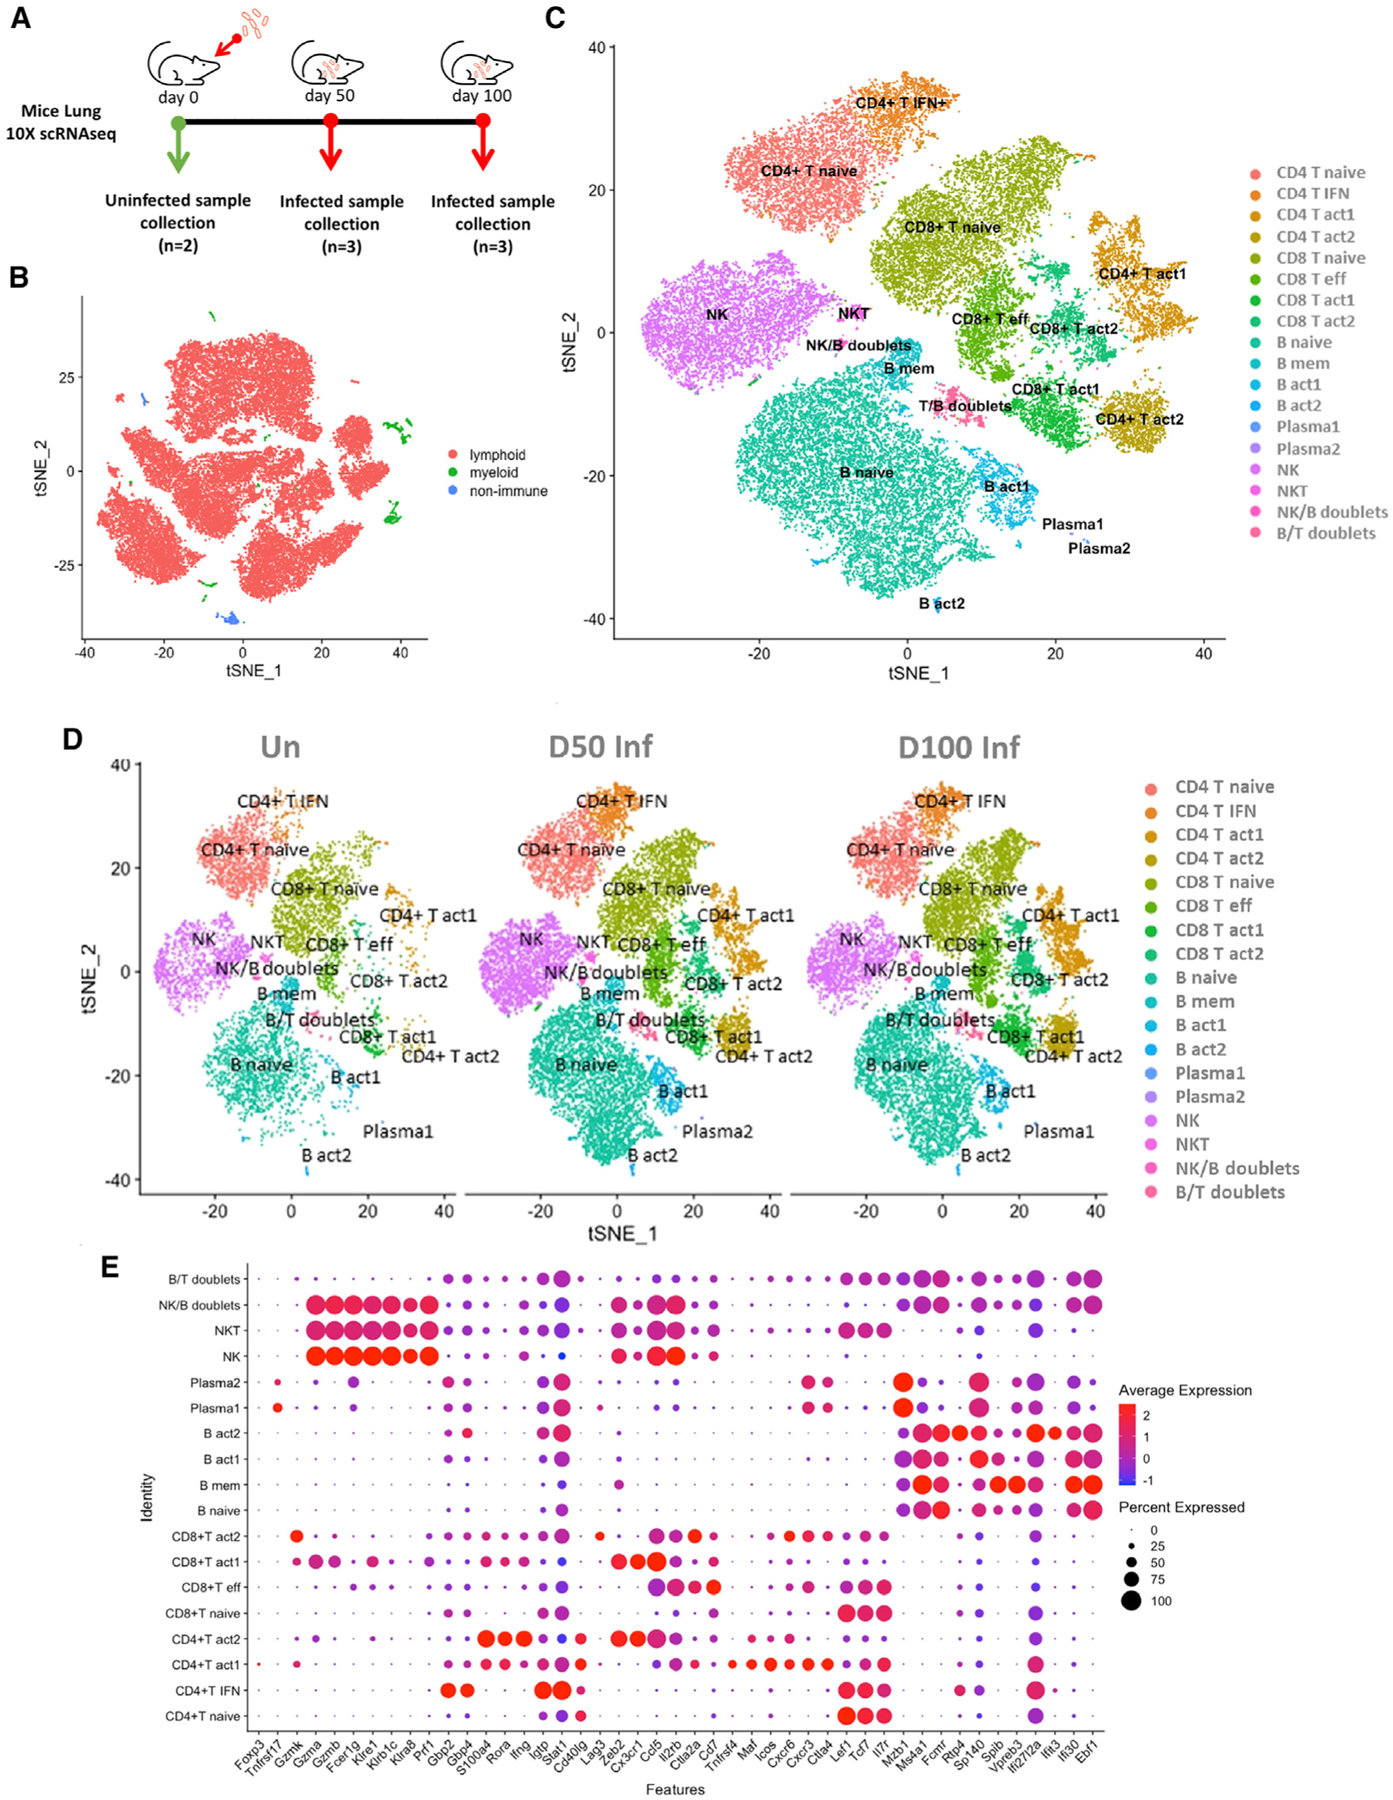
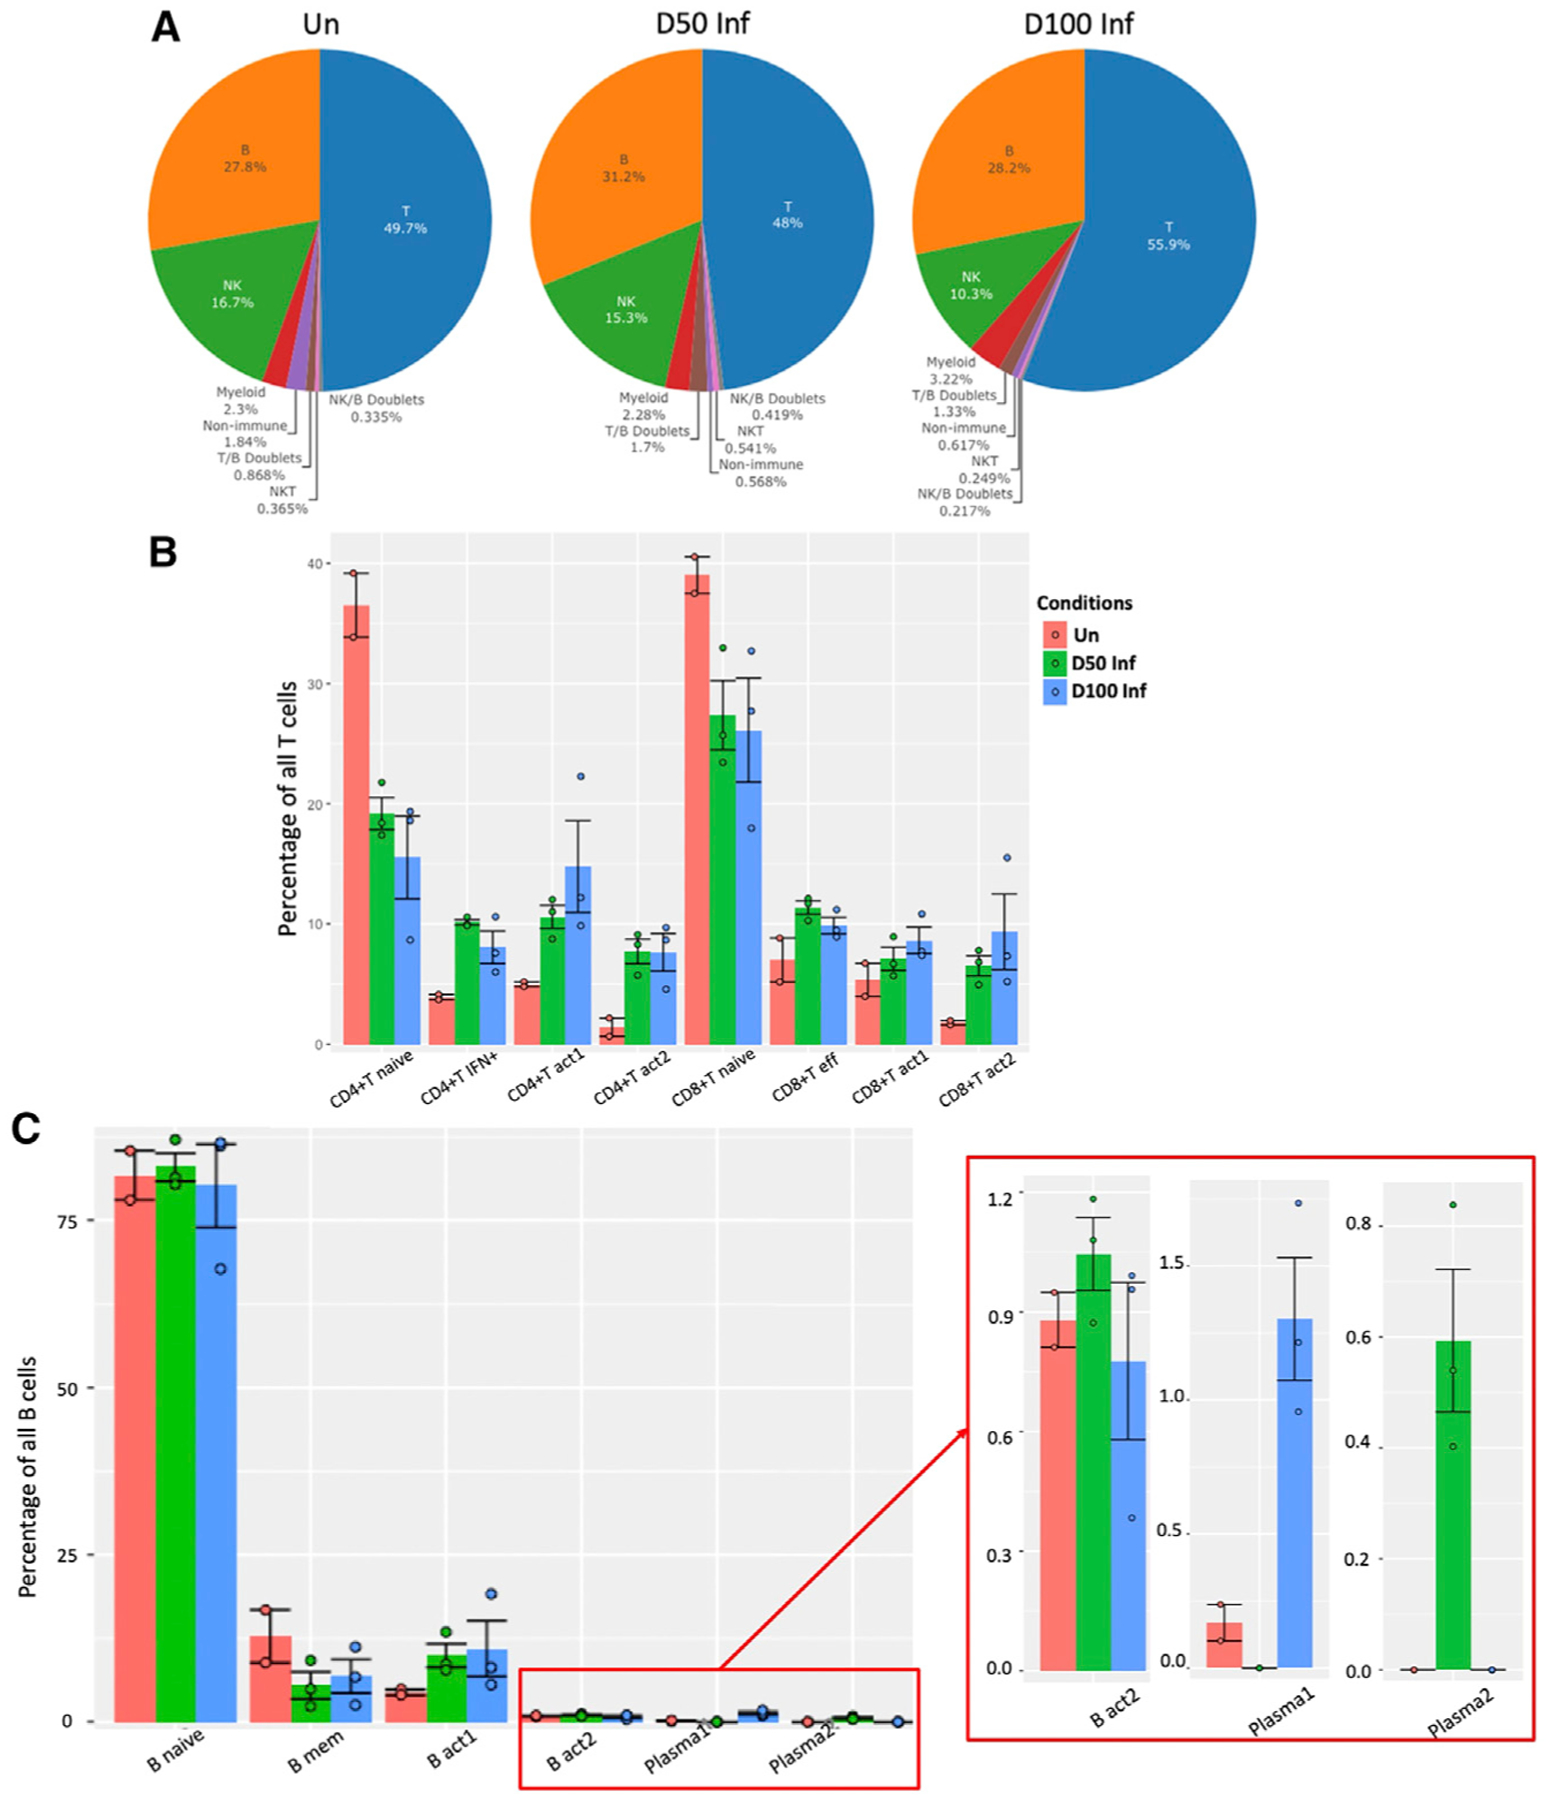
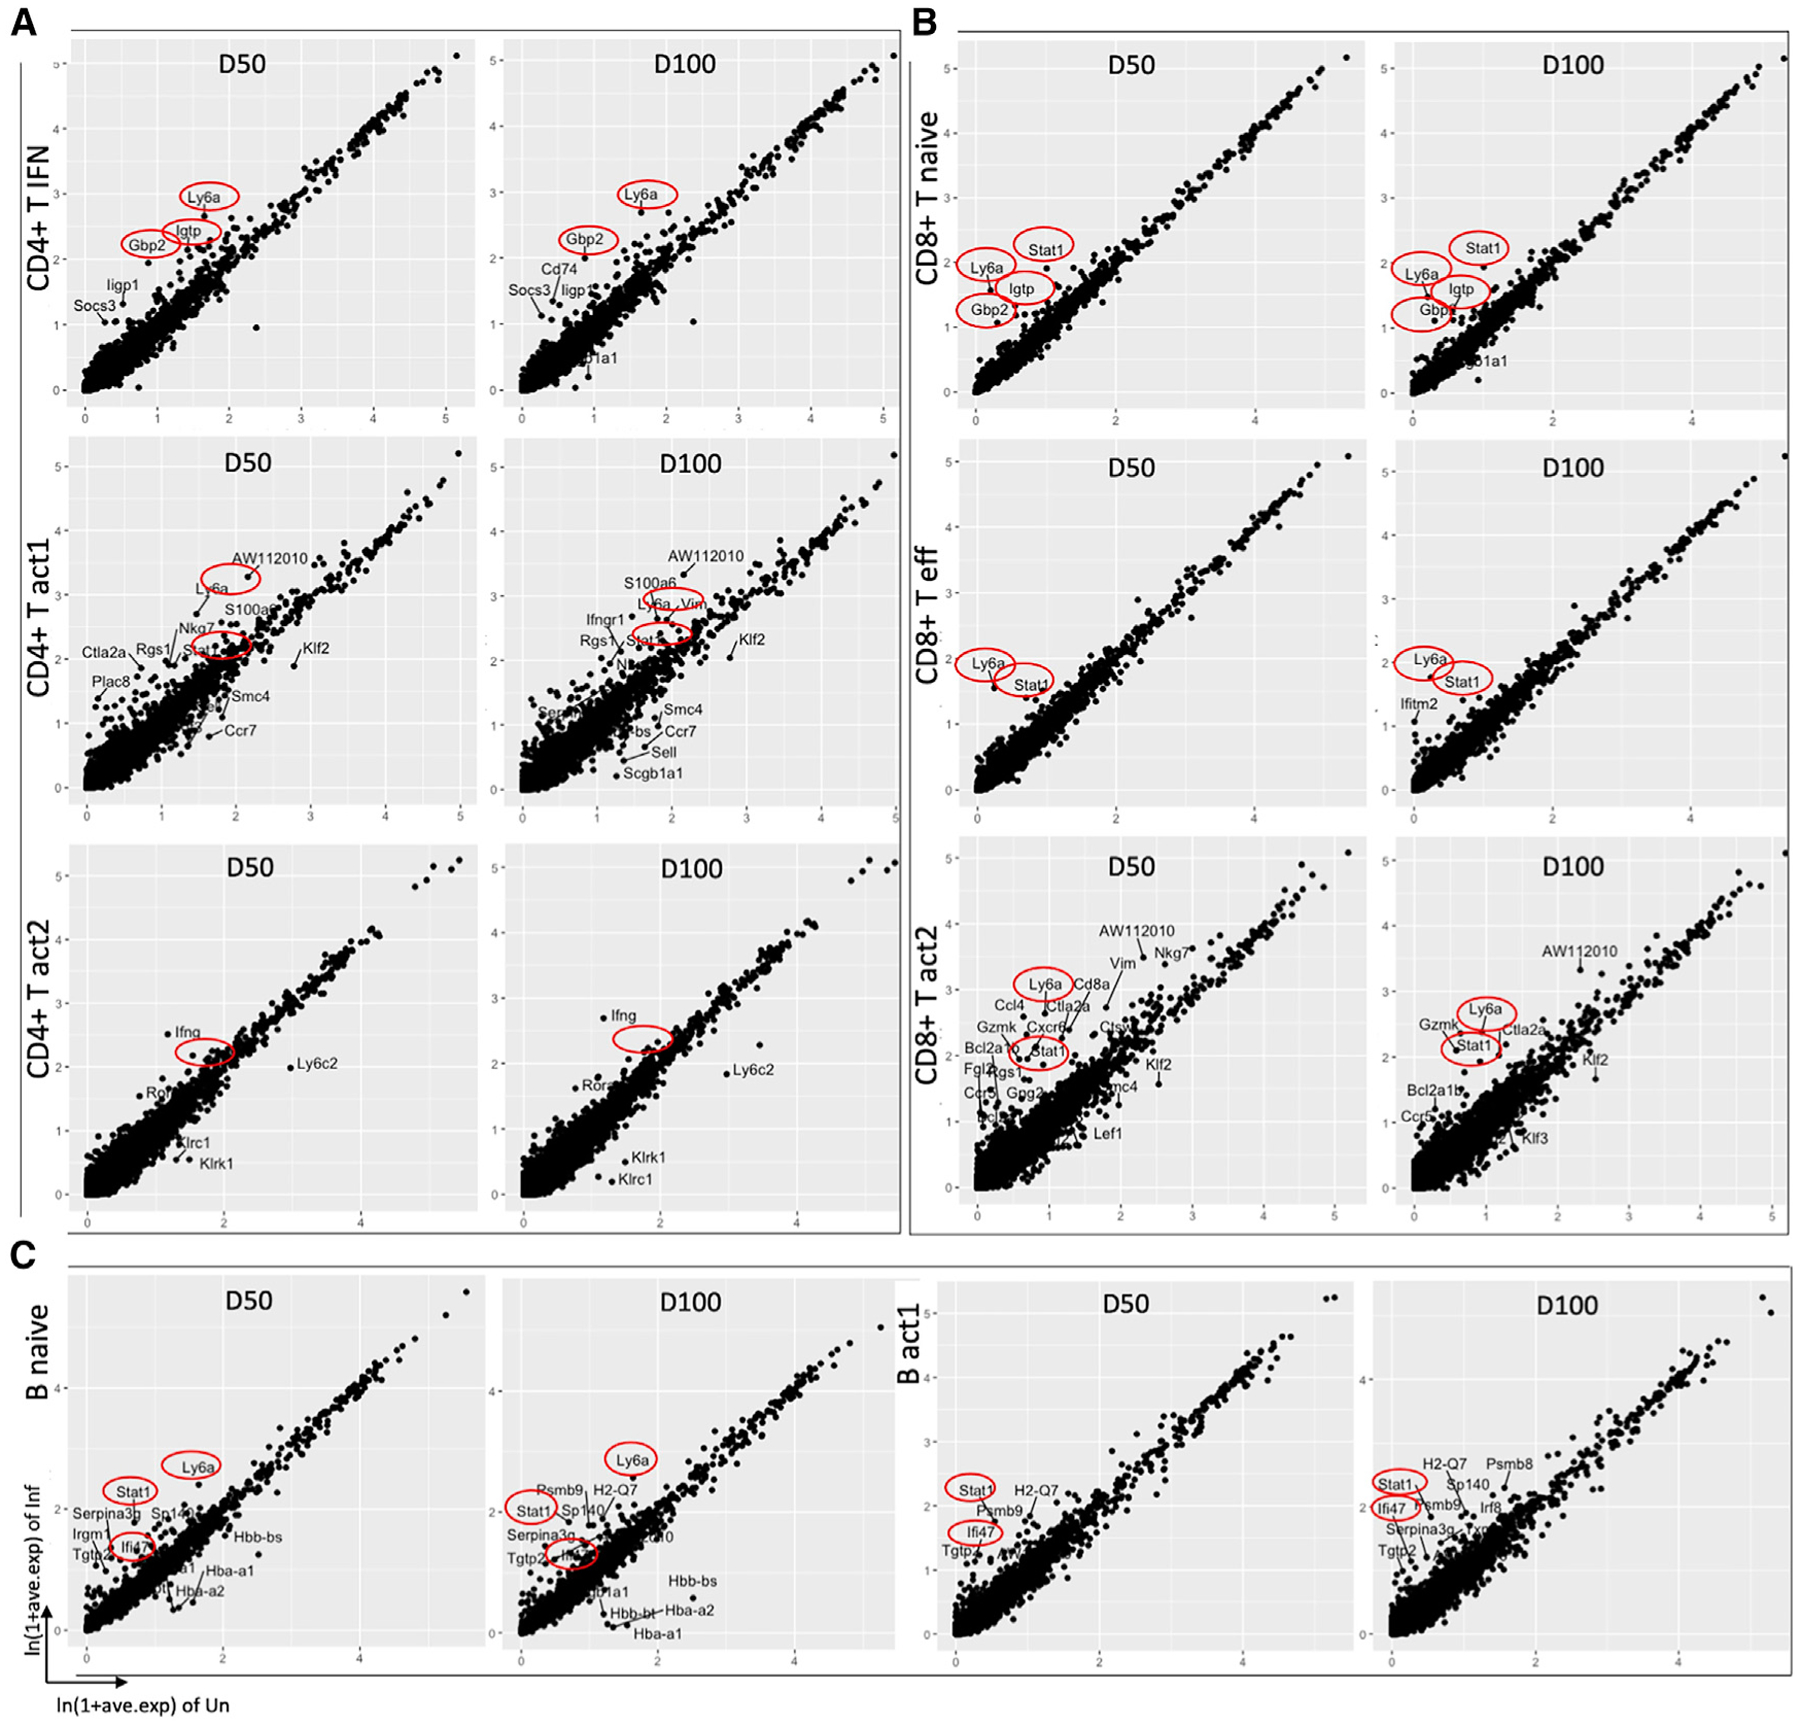
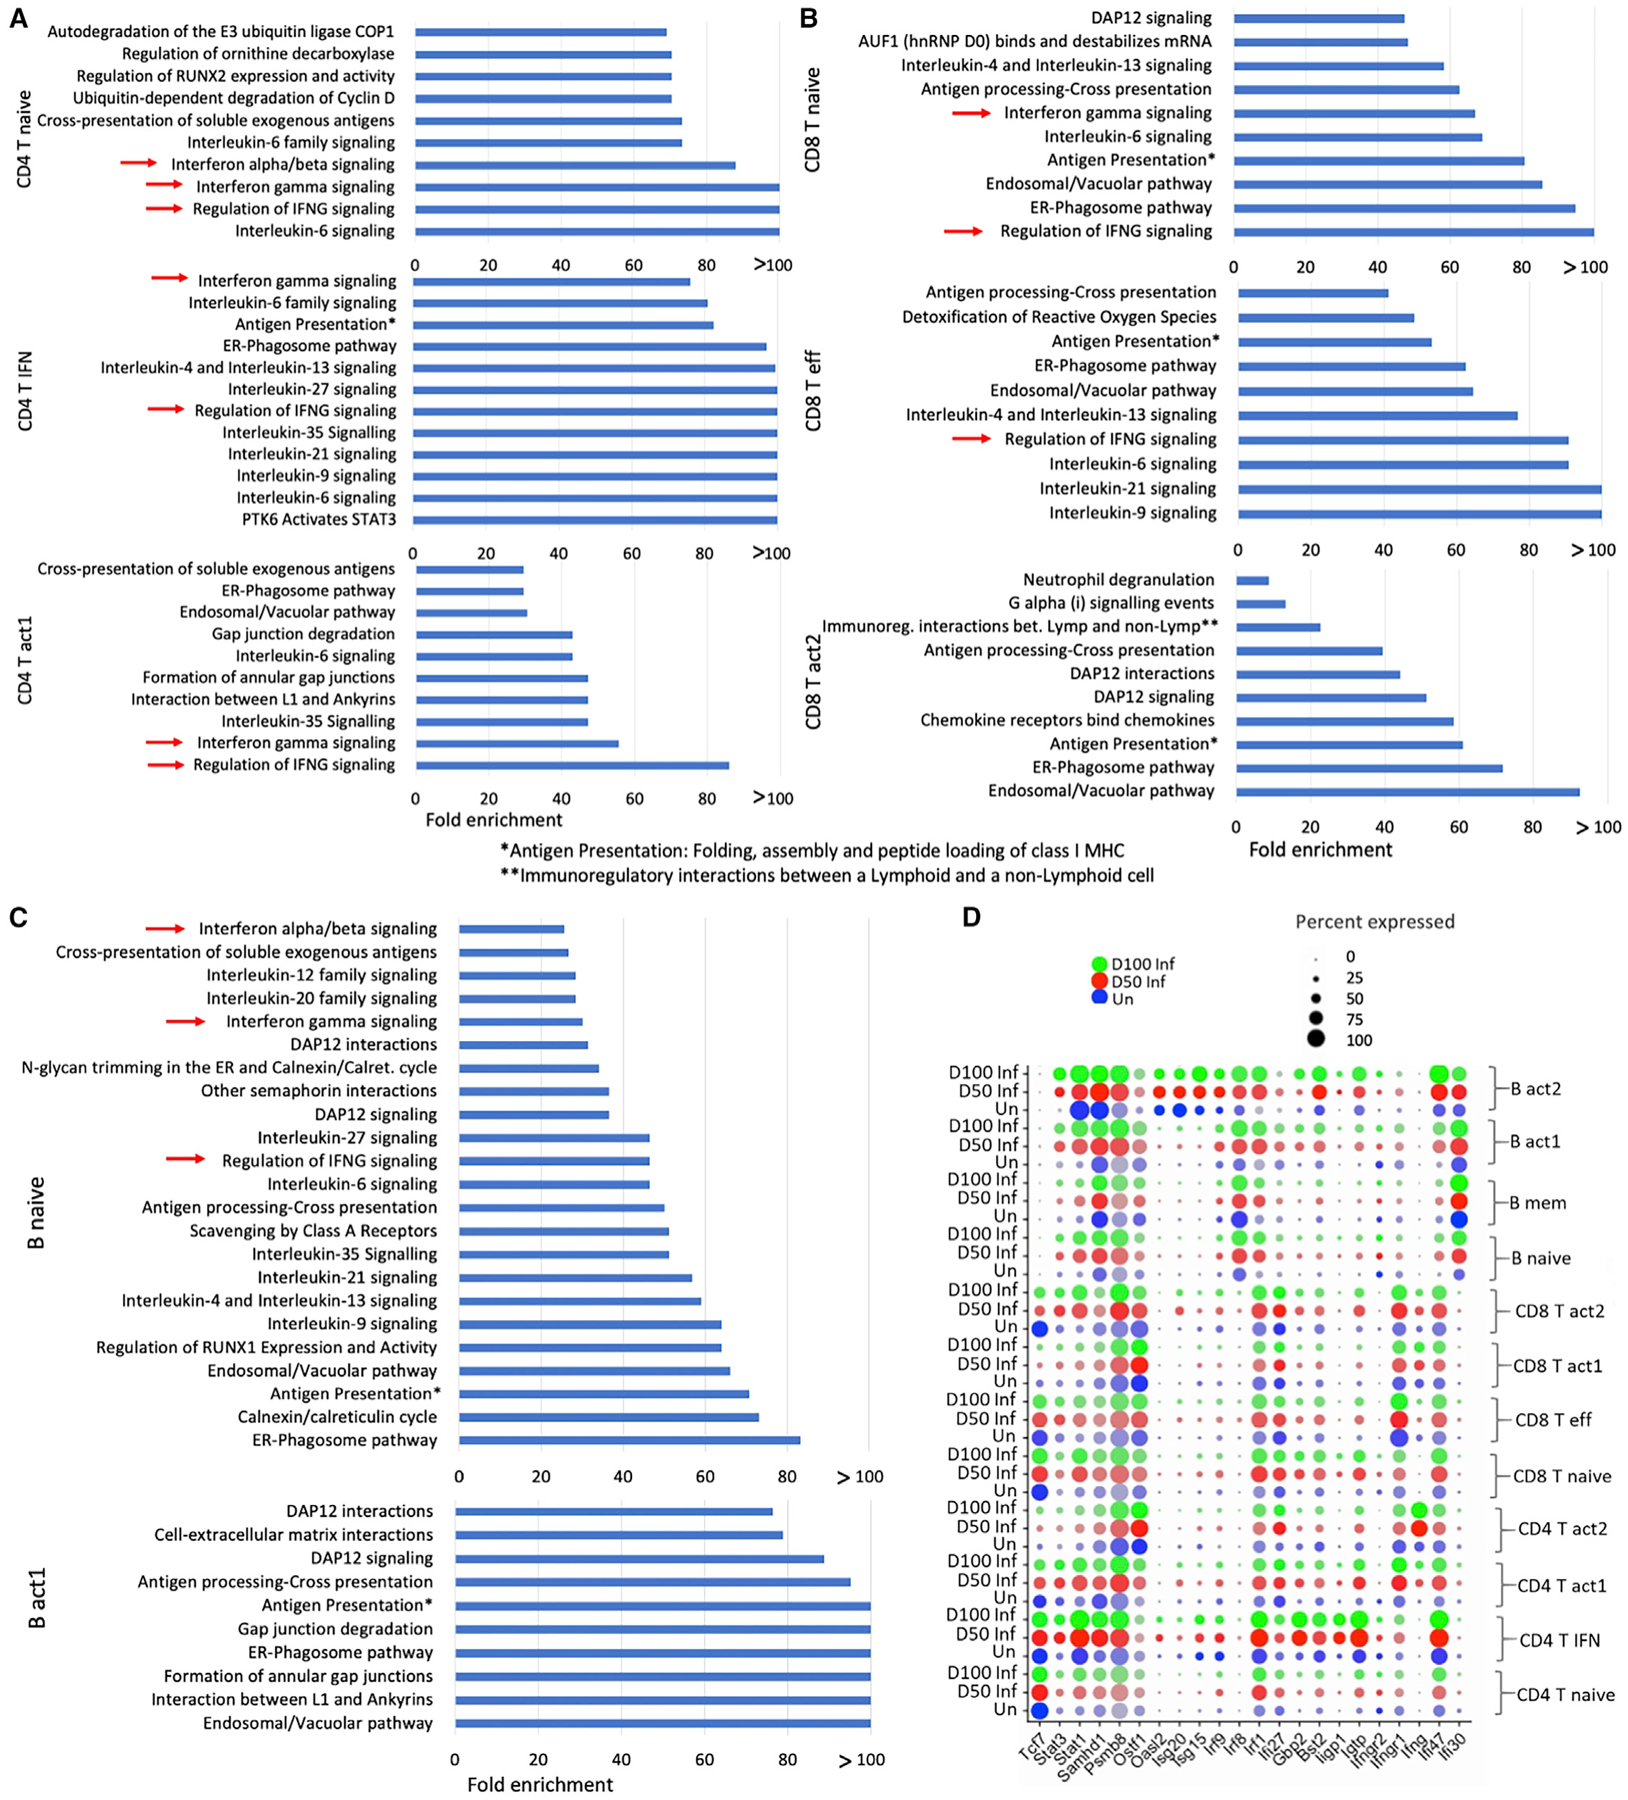
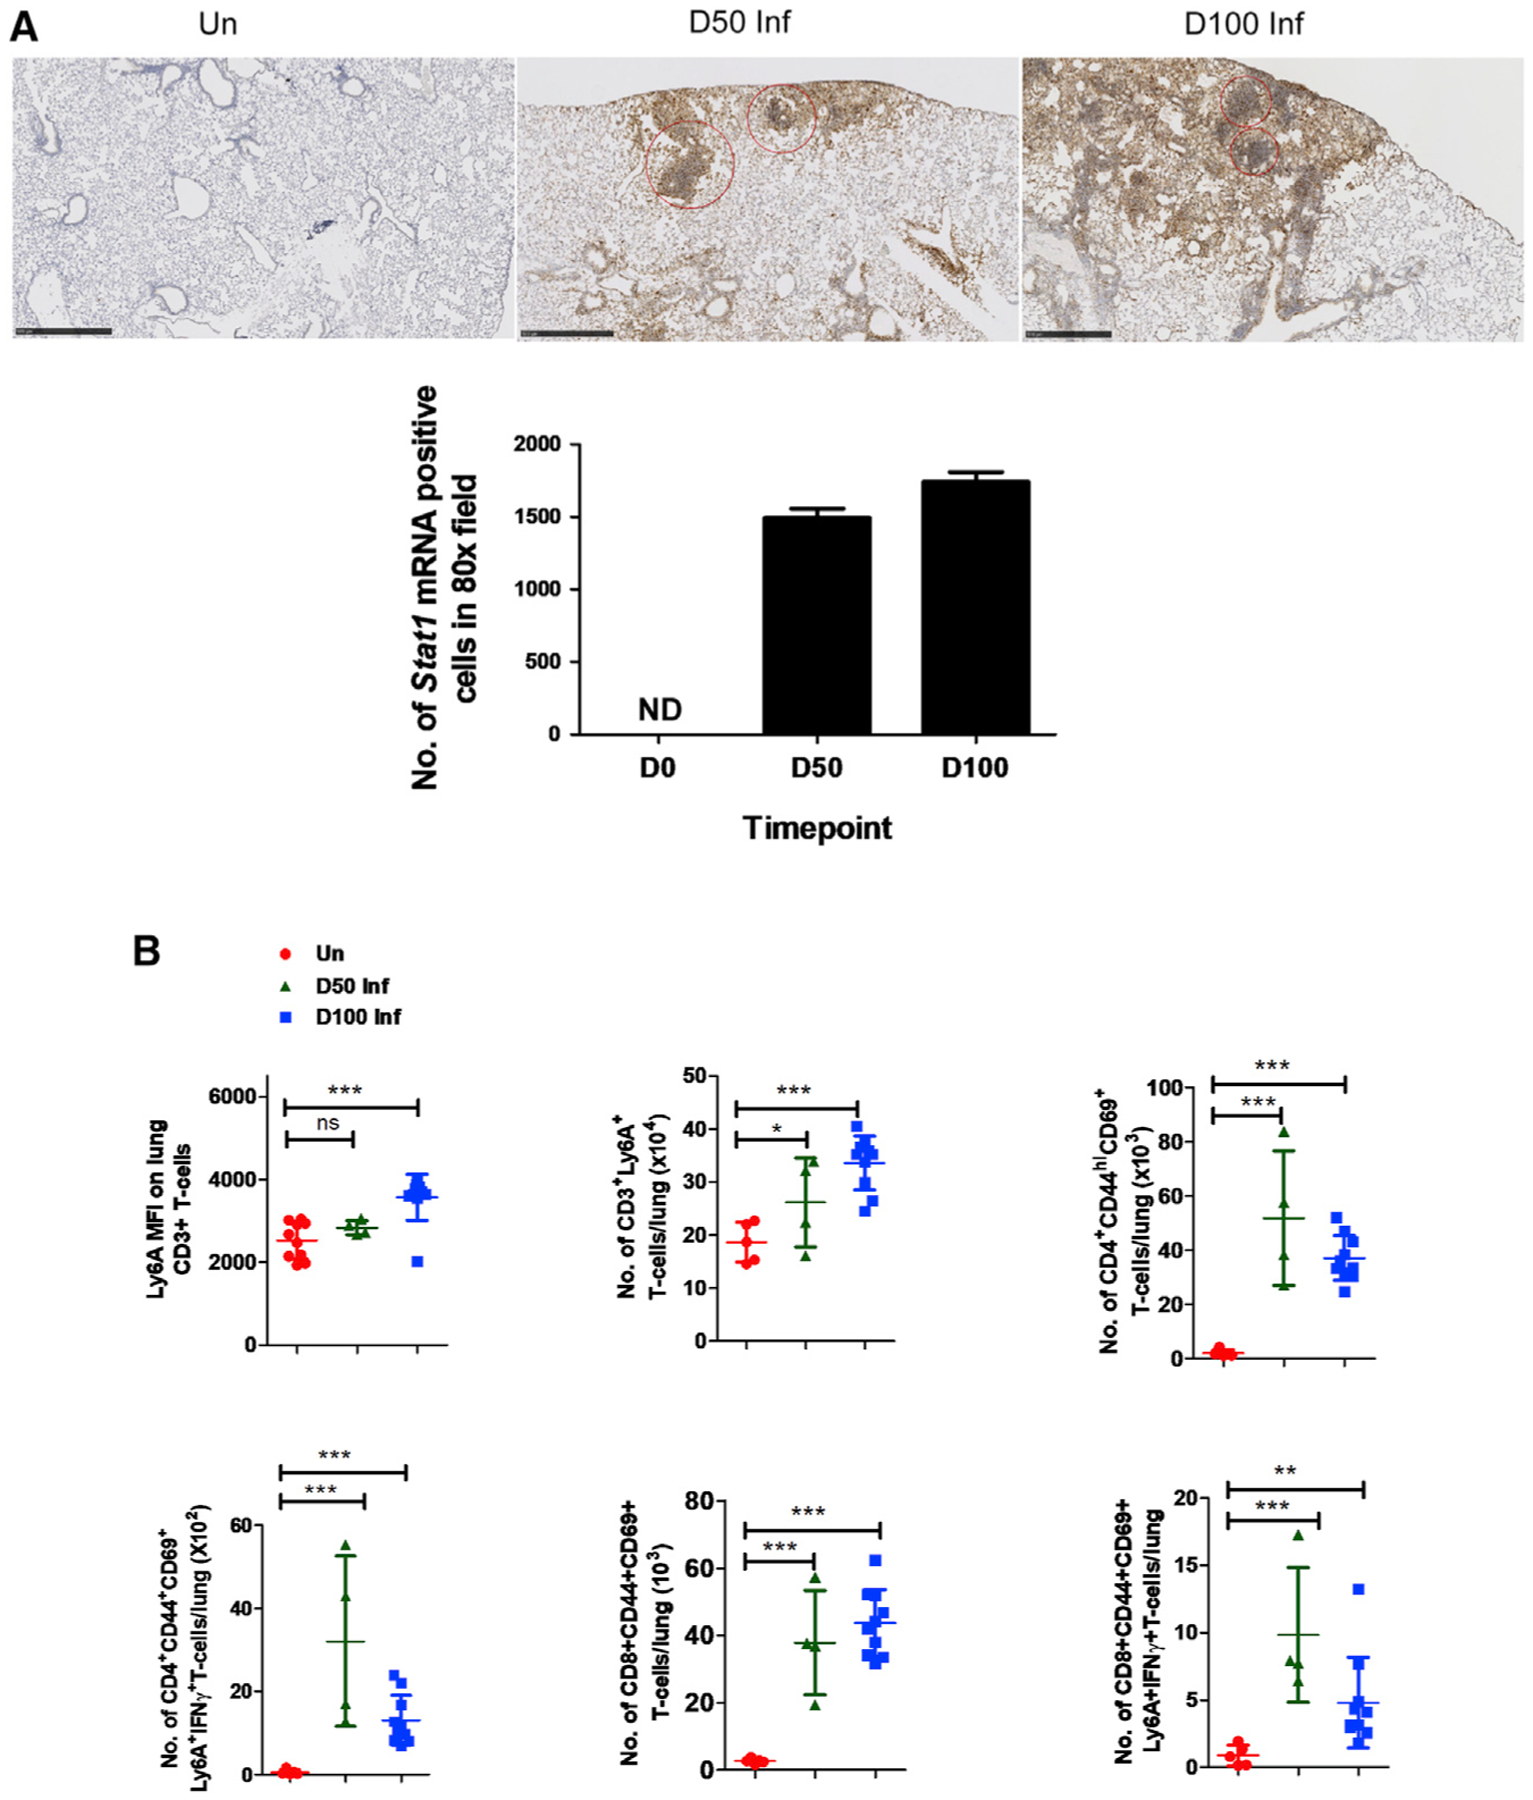
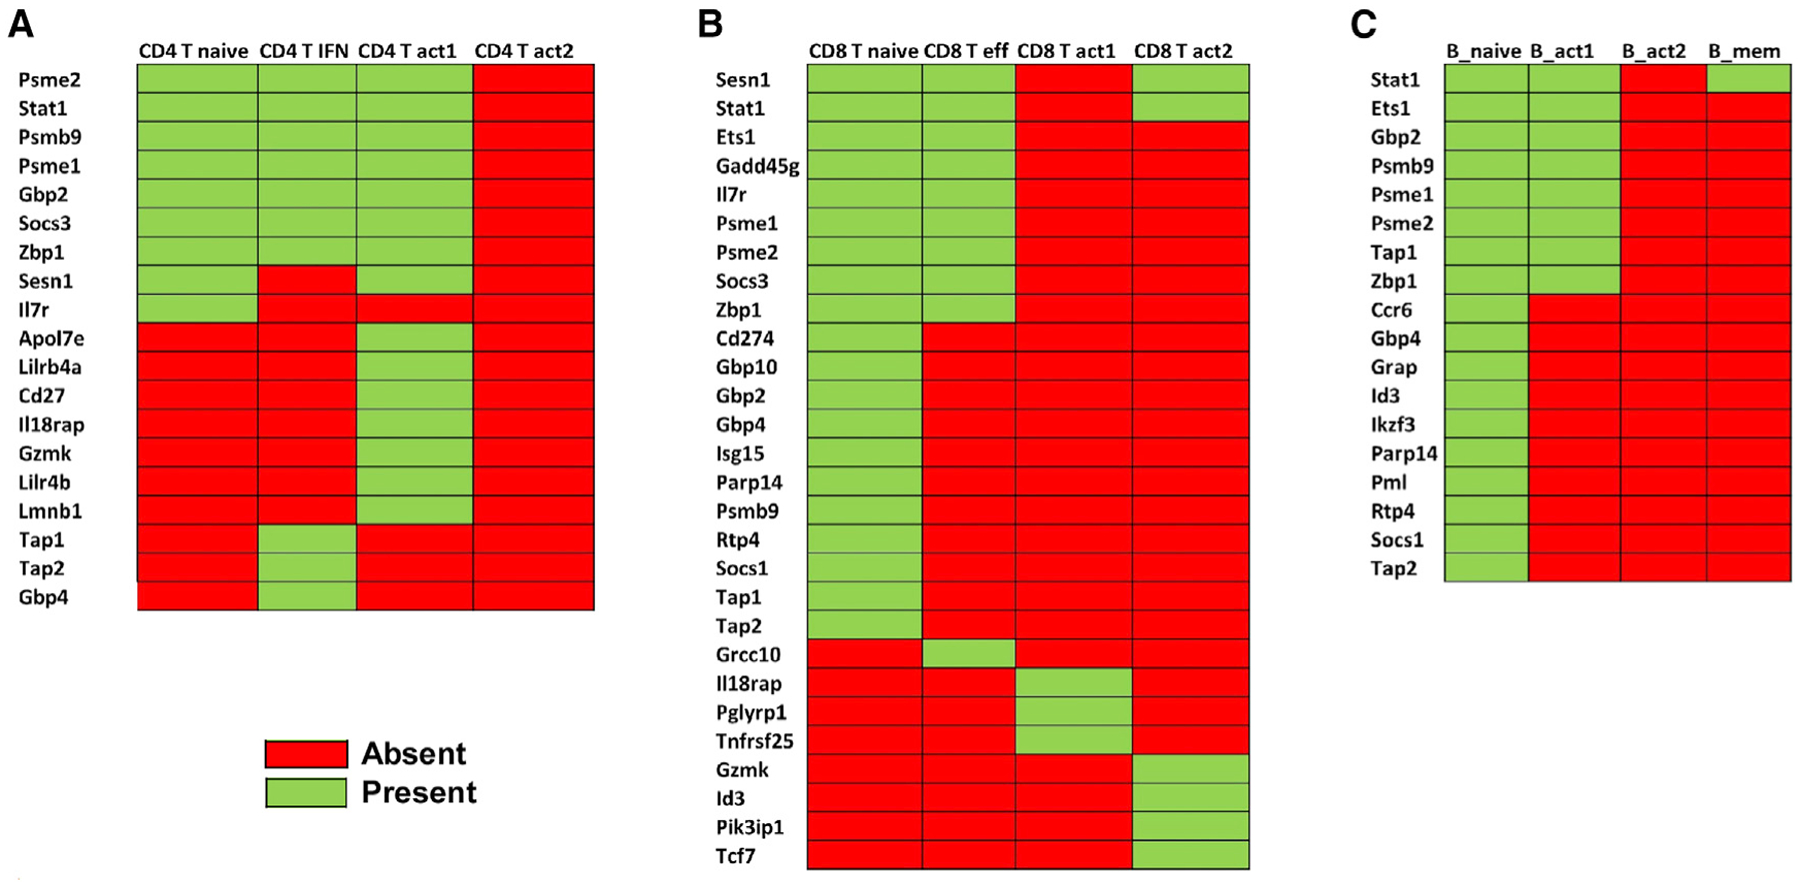
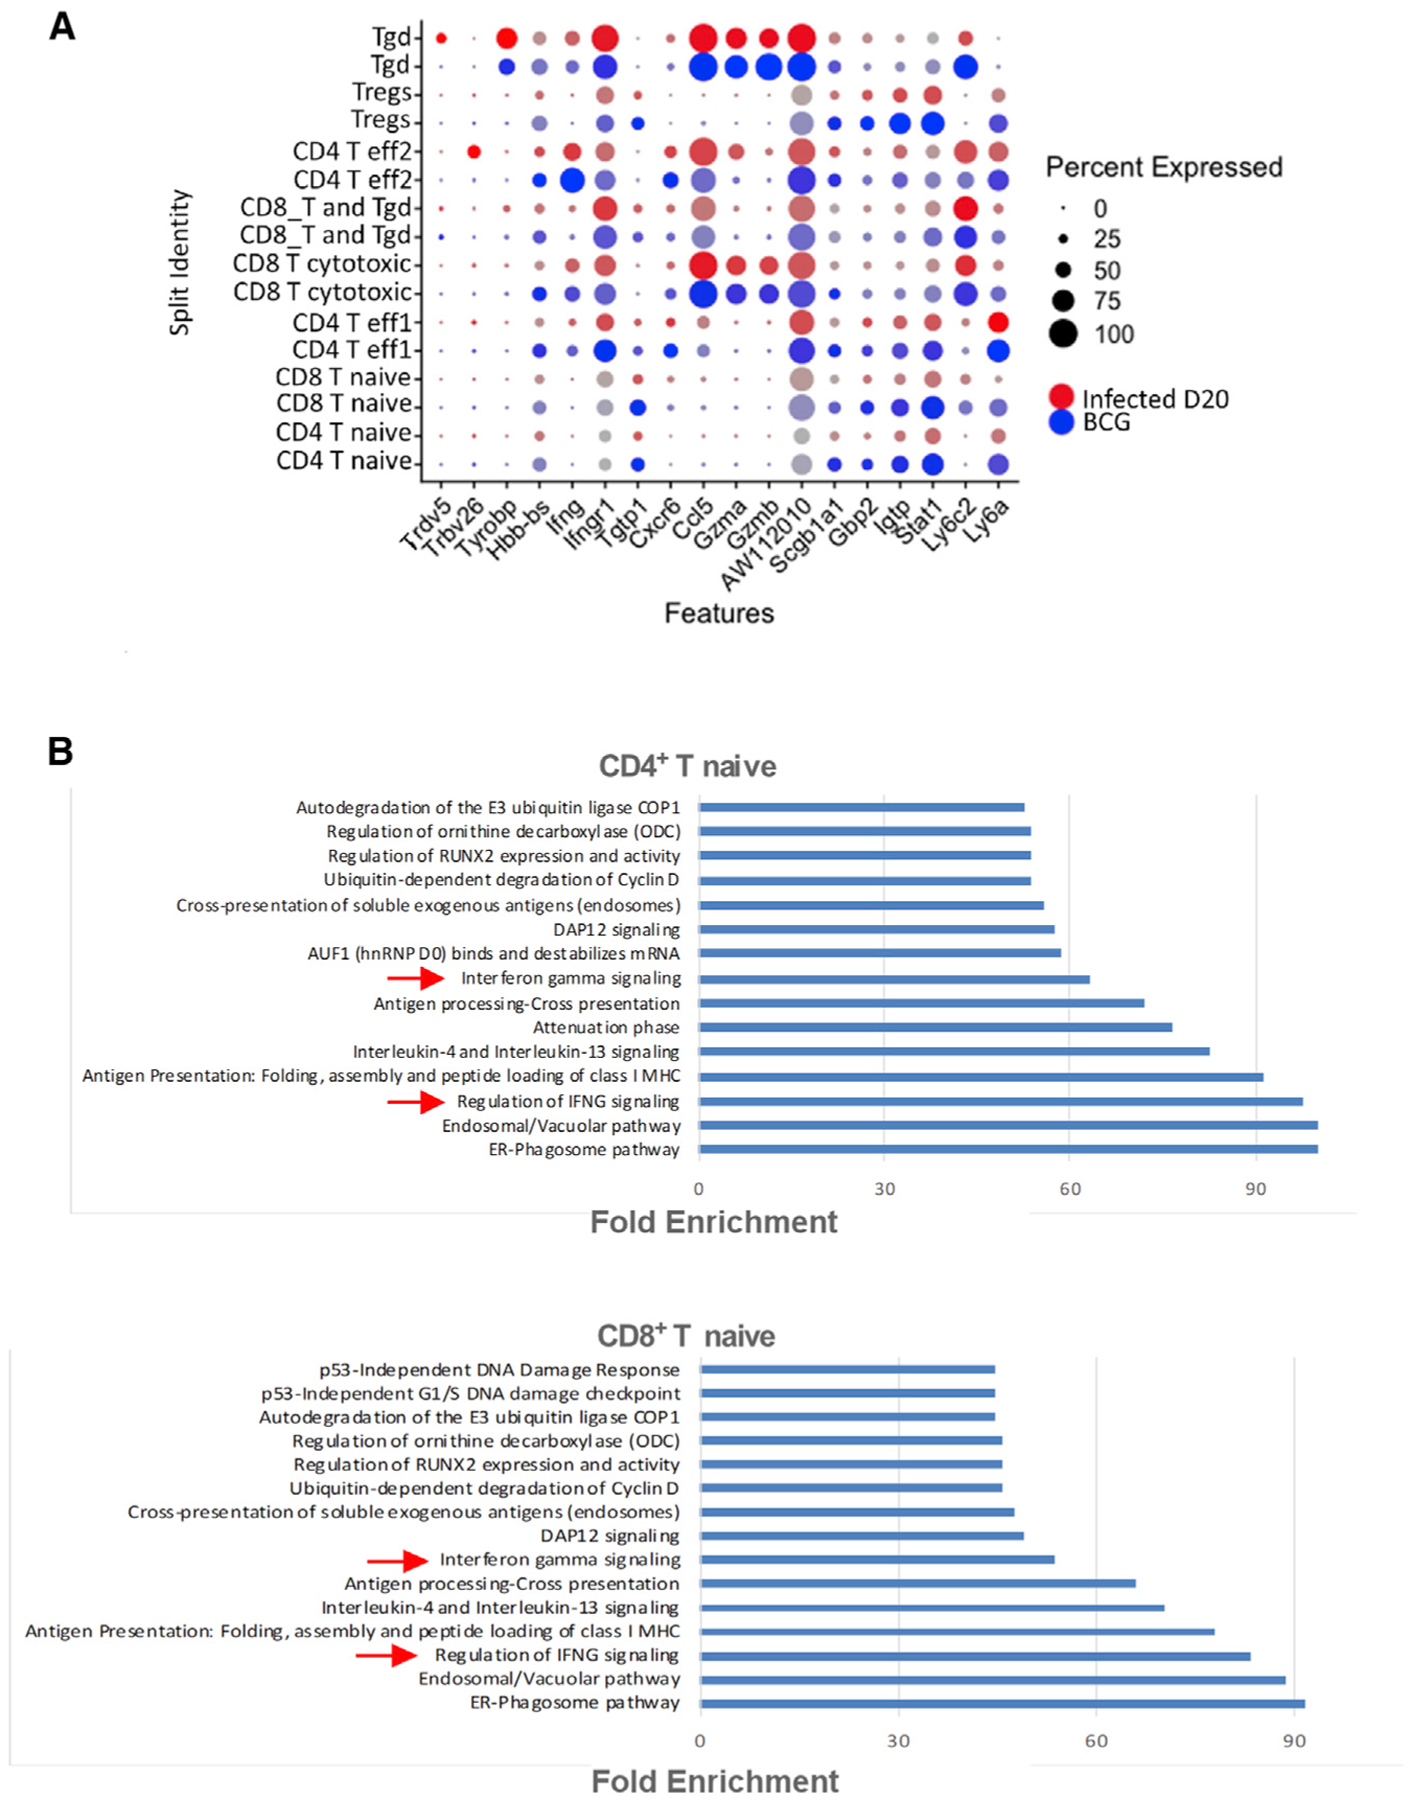
Mycobacterium tuberculosis (Mtb) infects 25% of the world's population and causes tuberculosis (TB), which is a leading cause of death globally. A clear understanding of the dynamics of immune response at the cellular level is crucial to design better strategies to control TB. We use the single-cell RNA sequencing approach on lung lymphocytes derived from healthy and Mtb-infected mice. Our results show the enrichment of the type I IFN signature among the lymphoid cell clusters, as well as heat shock responses in natural killer (NK) cells from Mtb-infected mice lungs. We identify Ly6A as a lymphoid cell activation marker and validate its upregulation in activated lymphoid cells following infection. The cross-analysis of the type I IFN signature in human TB-infected peripheral blood samples further validates our results. These findings contribute toward understanding and characterizing the transcriptional parameters at a single-cell depth in a highly relevant and reproducible mouse model of TB.

Keywords: CP: Immunology; CP: Microbiology; Mycobacterium tuberculosis; lymphocytes; single-cell RNA sequencing; type I IFN.


Conflict of interest statement

Declaration of interests The authors declare no competing interests.

Figures

Figure 1.
Figure 1.. scRNA-seq transcriptional profiling of Mtb-infected murine lungs
C57BL/6 mice were aerosol infected with Mtb HN878 and lungs were harvested at different dpi. (A) Study design using 10x Genomics platform. For this study, single-cell suspensions from lungs were derived from mice at 0, 50, and 100 dpi and subjected to downstream analysis as described in the Method details. (B) t-Distributed stochastic neighbor embedding (tSNE) visualization of the major cell types representing non-immune/lymphoid/myeloid cells in the dataset (all conditions together). (C) tSNE plot of cell subtypes after re-clustering the lymphoid cells, colored according to cellular identity (all conditions together). (D) tSNE plot of cell subtypes after re-clustering the lymphoid cells, colored according to cellular identity, split by condition. (E) Dot plot indicating expression of key genes detected for each cell subtype. The dot color represents the expression level, and the dot size represents the percentage of cells in each cluster expressing a particular gene. See also Figures S1 and S2.
Figure 2.
Figure 2.. Lymphoid clusters accumulate in the lungs during acute and chronic Mtb infection
(A) Pie charts representing the distribution of identified lymphoid cell types across conditions (0, 50, and 100 dpi). (B) Distribution of T cell subsets by cluster per condition per sample. (C) Distribution of B cells by cluster per condition per sample. Error bars are based on standard error of the mean. Wilcoxon rank-sum exact test was used to test whether the differences are significant among conditions in each cluster. Un, n = 2; D50 Inf, n = 3; D100 Inf, n = 3. *p < 0.05, **p < 0.01, ***p < 0.001.
Figure 3.
Figure 3.. Transcriptional analysis of lymphoid cell clusters
Scatterplots depicting the comparison of average expression of genes in infected (50/100 dpi) versus uninfected samples in (A) CD4+ T cell clusters (B) CD8+ T cell clusters, and (C) B cell clusters, highlighting the top DEGs (average logFC ≥ |±1|, adjusted p ≤ 0.05). IFN-related genes and Ly6A are highlighted in red circle. Each dot represents a gene. See also Figure S3 and Tables S1 and S2.
Figure 4.
Figure 4.. IFN-related pathways are overrepresented in lymphoid cell clusters in Mtb-infected mice
(A–C) Statistical overrepresentation test was performed with reactome pathways as annotation set. Top overrepresented pathways in Mtb-infected mice lungs at 50 dpi with respective fold enrichment in (A) CD4+ T cell clusters, (B) CD8+ T cell clusters, and (C) B cell clusters. False discovery rate (FDR) <0.05. (D) Average expression of several IFN-related genes that were differentially expressed in respective lymphoid cell clusters. The dot size represents the percentage of cells in each cluster expressing a particular gene. See also Figure S3 and Tables S1 and S2.
Figure 5.
Figure 5.. Induction of Stat1 and Ly6A expression in activated lymphoid cells in Mtb-infected lungs
C57BL/6 mice were aerosol infected with Mtb HN878 and lungs were harvested at 0, 50, and 100 dpi. (A) Histological analysis from paraffin-embedded sections from lungs of Mtb-infected mice showing induction of Stat1 mRNA using ISH (10×, upper panel) and its quantitations as number of Stat1 mRNA+ cells in 80× field (lower panel). ND, not detected. Red circles encompass regions with dense expression of Stat1 mRNA. Scale bar, 500 μM. (B) Ly6A expression measured using flow cytometry among different effector lymphoid cell populations at 0, 50, and 100 dpi, as predicted by scRNA-seq analysis. Data points represent the mean ± SD values from 4 to 10 mice; significance assessed by Student’s t test. *p < 0.05, **p < 0.01, ***p < 0.001; ns, not significant.
Figure 6.
Figure 6.. Type I IFN transcriptomic signatures are conserved across species post-Mtb infection in different clusters
Our result from scRNA-seq data from Mtb-infected lung lymphoid clusters (this study) was compared with human whole-blood data from a published study (Berry et al., 2010) to identify DEGs shared among (A) CD4+ T cell clusters (B) CD8+ T cell clusters, and (C) B cell clusters. Green represents common in both datasets; red represents not found in respective cluster.
Figure 7.
Figure 7.. IFN-γ transcriptional pathways are upregulated in lung lymphoid clusters in BCG-vaccinated mice
scRNA-seq was performed on lung single cells derived from BCG-vaccinated Mtb-infected mice at 15 dpi (n = 2) and compared to lungs of unvaccinated Mtb-infected mice at 20 dpi (n = 2). (A) Dot plot represents the expression of top DEGs at different conditions in T cell clusters. The color of the dot represents the condition (red = unvaccinated infected, blue = BCG vaccinated infected). (B) Top 15 significant overrepresented reactome pathways using the upregulated DEGs in BCG-vaccinated Mtb-infected lungs compared to unvaccinated Mtb-infected lungs in CD4+ T clusters. FDR <0.05.

References

    1. Ahmed M, Thirunavukkarasu S, Rosa BA, Thomas KA, Das S, Rangel-Moreno J, Lu L, Mehra S, Mbandi SK, Thackray LB, et al. (2020). Immune correlates of tuberculosis disease and risk translate across species. Sci. Transl. Med 12, eaay0233. 10.1126/scitranslmed.aay0233. - DOI - PMC - PubMed
    1. Ardain A, Domingo-Gonzalez R, Das S, Kazer SW, Howard NC, Singh A, Ahmed M, Nhamoyebonde S, Rangel-Moreno J, Ogongo P, et al. (2019). Group 3 innate lymphoid cells mediate early protective immunity against tuberculosis. Nature 570, 528–532. 10.1038/s41586-019-1276-2. - DOI - PMC - PubMed
    1. Benjamini Y, and Hochberg Y (1995). Controlling the false discovery rate: a practical and powerful approach to multiple testing. J. R. Stat. Soc. Ser. B 57, 289–300. 10.1111/j.2517-6161.1995.tb02031.x. - DOI
    1. Berry MPR, Graham CM, McNab FW, Xu Z, Bloch SAA, Oni T, Wilkinson KA, Banchereau R, Skinner J, Wilkinson RJ, et al. (2010). An interferon-inducible neutrophil-driven blood transcriptional signature in human tuberculosis. Nature 466, 973–977. 10.1038/nature09247. - DOI - PMC - PubMed
    1. Blankley S, Graham CM, Levin J, Turner J, Berry MPR, Bloom CI, Xu Z, Pascual V, Banchereau J, Chaussabel D, et al. (2016). A 380-gene meta-signature of active tuberculosis compared with healthy controls. Eur. Respir. J 47, 1873–1876. 10.1183/13993003.02121-2015. - DOI - PMC - PubMed

Publication types