

Phosphodiesterase type 5 inhibitors enhance chemotherapy in preclinical models of esophageal adenocarcinoma by targeting cancer-associated fibroblasts
- PMID: 35732148
- PMCID: PMC9244979
- DOI: 10.1016/j.xcrm.2022.100541
Phosphodiesterase type 5 inhibitors enhance chemotherapy in preclinical models of esophageal adenocarcinoma by targeting cancer-associated fibroblasts
Abstract
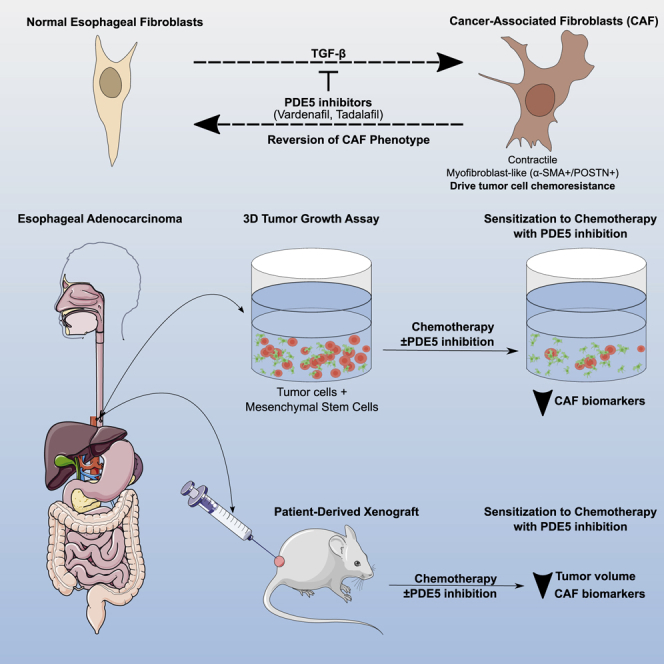
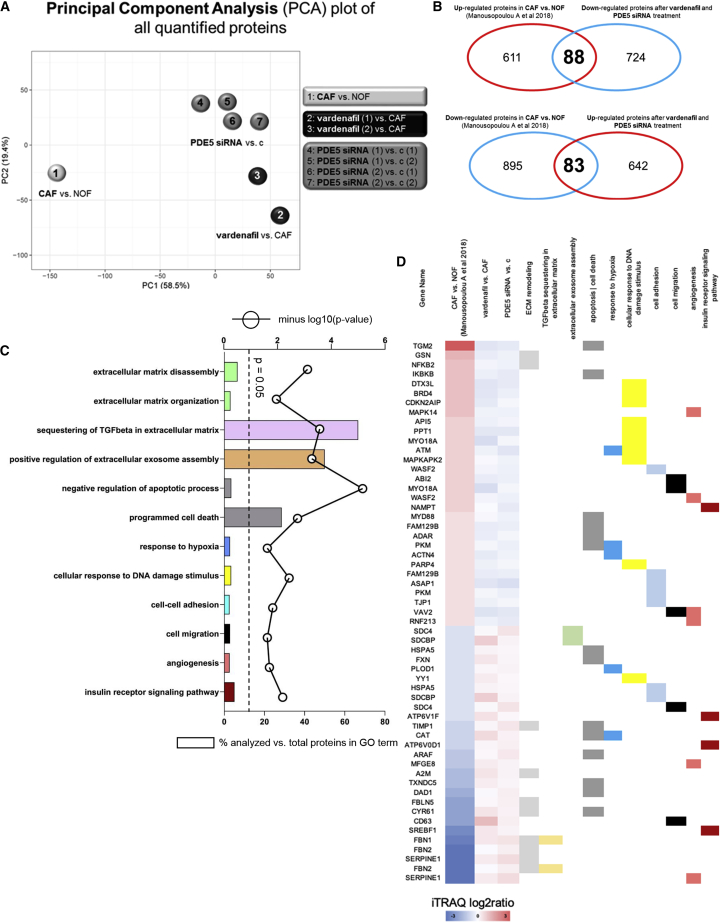
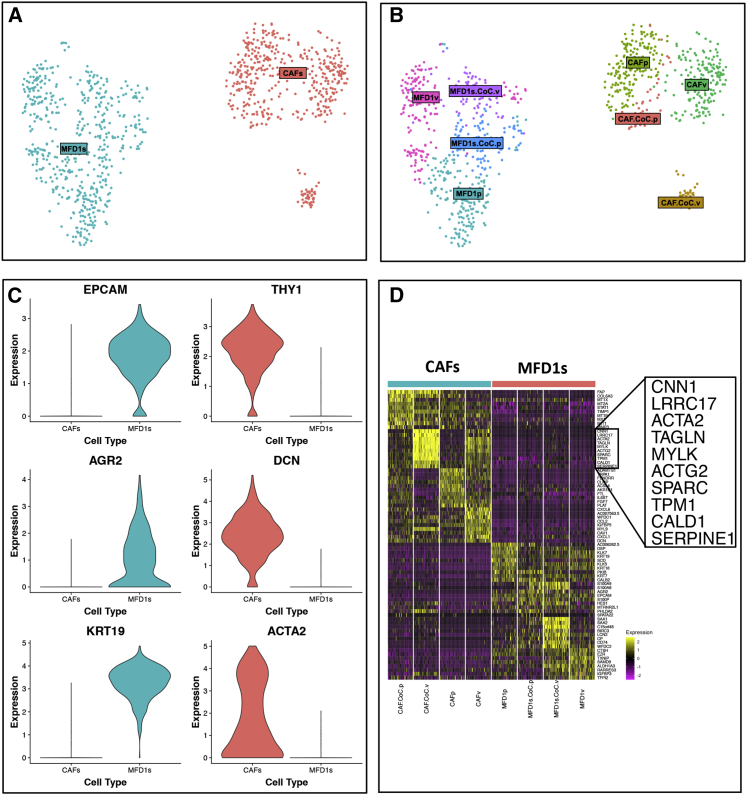
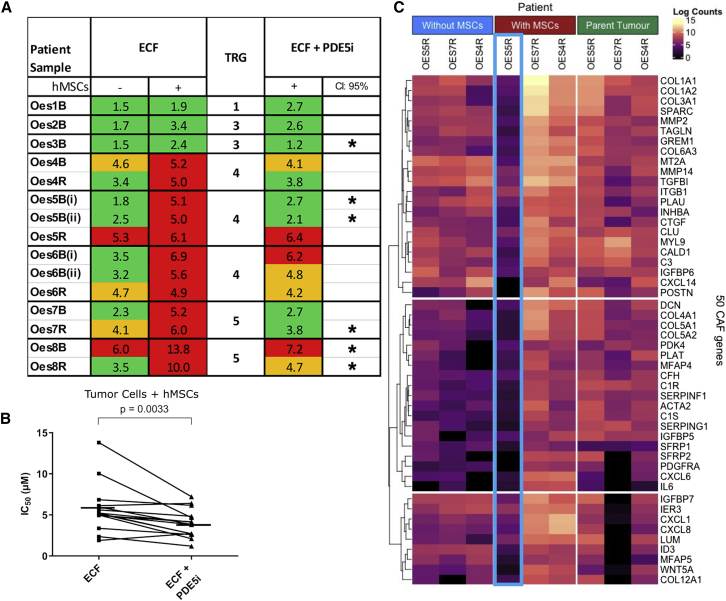
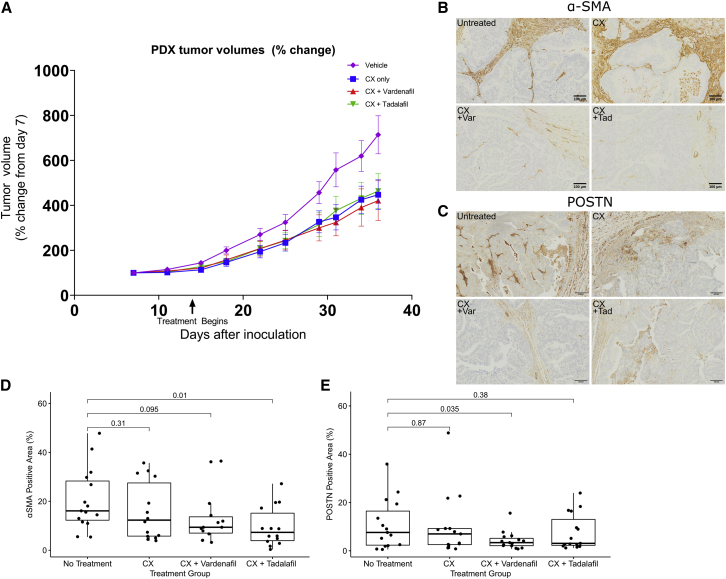
The chemotherapy resistance of esophageal adenocarcinomas (EACs) is underpinned by cancer cell extrinsic mechanisms of the tumor microenvironment (TME). We demonstrate that, by targeting the tumor-promoting functions of the predominant TME cell type, cancer-associated fibroblasts (CAFs) with phosphodiesterase type 5 inhibitors (PDE5i), we can enhance the efficacy of standard-of-care chemotherapy. In ex vivo conditions, PDE5i prevent the transdifferentiation of normal fibroblasts to CAF and abolish the tumor-promoting function of established EAC CAFs. Using shotgun proteomics and single-cell RNA-seq, we reveal PDE5i-specific regulation of pathways related to fibroblast activation and tumor promotion. Finally, we confirm the efficacy of PDE5i in combination with chemotherapy in close-to-patient and in vivo PDX-based model systems. These findings demonstrate that CAFs drive chemotherapy resistance in EACs and can be targeted by repurposing PDE5i, a safe and well-tolerated class of drug administered to millions of patients world-wide to treat erectile dysfunction.
Keywords: cancer-associated fibroblasts; chemotherapy; esophageal adenocarcinoma; phosphodiesterase type 5 inhibitors; preclinical models.
Copyright © 2022 The Authors. Published by Elsevier Inc. All rights reserved.
Conflict of interest statement
Declaration of interests S.D.G. is Founder, President, CEO, and CTO of Proteas Bioanalytics, Inc. A.M. is CSO of Proteas Bioanalytics, Inc. They confirm that they were not affiliated when the work published in this study was carried out. All other authors declare no competing interests.
Figures
Similar articles
-
Patient-derived tumor organoid and fibroblast assembloid models for interrogation of the tumor microenvironment in esophageal adenocarcinoma.Cell Rep Methods. 2024 Dec 16;4(12):100909. doi: 10.1016/j.crmeth.2024.100909. Epub 2024 Nov 27. Cell Rep Methods. 2024. PMID: 39610249 Free PMC article.
-
Cancer-associated fibroblasts predict poor outcome and promote periostin-dependent invasion in oesophageal adenocarcinoma.J Pathol. 2015 Feb;235(3):466-77. doi: 10.1002/path.4467. J Pathol. 2015. PMID: 25345775 Free PMC article.
-
Targeting the Myofibroblastic Cancer-Associated Fibroblast Phenotype Through Inhibition of NOX4.J Natl Cancer Inst. 2018 Jan 1;110(1):109-20. doi: 10.1093/jnci/djx121. J Natl Cancer Inst. 2018. PMID: 28922779 Free PMC article.
-
Immune checkpoint inhibitors as mediators for immunosuppression by cancer-associated fibroblasts: A comprehensive review.Front Immunol. 2022 Oct 5;13:996145. doi: 10.3389/fimmu.2022.996145. eCollection 2022. Front Immunol. 2022. PMID: 36275750 Free PMC article. Review.
-
Emerging role of cancer-associated fibroblasts in esophageal squamous cell carcinoma.Pathol Res Pract. 2024 Jan;253:155002. doi: 10.1016/j.prp.2023.155002. Epub 2023 Nov 30. Pathol Res Pract. 2024. PMID: 38056131 Review.
Cited by
-
Interactions between cancer-associated fibroblasts and the extracellular matrix in oesophageal cancer.Matrix Biol. 2025 Aug;139:49-60. doi: 10.1016/j.matbio.2025.05.003. Epub 2025 May 14. Matrix Biol. 2025. PMID: 40379112 Free PMC article. Review.
-
Patient-derived tumor organoid and fibroblast assembloid models for interrogation of the tumor microenvironment in esophageal adenocarcinoma.Cell Rep Methods. 2024 Dec 16;4(12):100909. doi: 10.1016/j.crmeth.2024.100909. Epub 2024 Nov 27. Cell Rep Methods. 2024. PMID: 39610249 Free PMC article.
-
Tumour microenvironment influences response to treatment in oesophageal adenocarcinoma.Front Immunol. 2023 Dec 13;14:1330635. doi: 10.3389/fimmu.2023.1330635. eCollection 2023. Front Immunol. 2023. PMID: 38155973 Free PMC article. Review.
-
Cancer-associated fibroblasts are associated with neo-adjuvant treatment response in oesophageal adenocarcinoma.Br J Cancer. 2025 Sep;133(5):633-647. doi: 10.1038/s41416-025-03080-8. Epub 2025 Jul 10. Br J Cancer. 2025. PMID: 40640495 Free PMC article.
-
Cancer-associated fibroblasts as mediators of tissue microenvironment remodeling in cancer.Curr Opin Cell Biol. 2025 Oct;96:102567. doi: 10.1016/j.ceb.2025.102567. Epub 2025 Jul 14. Curr Opin Cell Biol. 2025. PMID: 40663954 Free PMC article. Review.
References
-
- Alderson D., Cunningham D., Nankivell M., Blazeby J.M., Griffin S.M., Crellin A., Grabsch H.I., Langer R., Pritchard S., Okines A., et al. Neoadjuvant cisplatin and fluorouracil versus epirubicin, cisplatin, and capecitabine followed by resection in patients with oesophageal adenocarcinoma (UK MRC OE05): an open-label, randomised phase 3 trial. Lancet Oncol. 2017;18:1249–1260. - PMC - PubMed
-
- Allum W.H., Stenning S.P., Bancewicz J., Clark P.I., Langley R.E. Long-term results of a randomized trial of surgery with or without preoperative chemotherapy in esophageal cancer. J. Clin. Oncol. 2009;27:5062–5067. - PubMed
-
- Shapiro J., van Lanschot J.J.B., Hulshof M.C.C.M., van Hagen P., van Berge Henegouwen M.I., Wijnhoven B.P.L., van Laarhoven H.W.M., Nieuwenhuijzen G.A.P., Hospers G.A.P., Bonenkamp J.J., et al. Neoadjuvant chemoradiotherapy plus surgery versus surgery alone for oesophageal or junctional cancer (CROSS): Long-term results of a randomised controlled trial. Lancet Oncol. 2015;16:1090–1098. - PubMed
Publication types
MeSH terms
Substances
Supplementary concepts
Grants and funding
LinkOut - more resources
Full Text Sources
Medical
Molecular Biology Databases
