. 2022 Jun 21;3(6):100663.
doi: 10.1016/j.xcrm.2022.100663.

The IL-1β, IL-6, and TNF cytokine triad is associated with post-acute sequelae of COVID-19

Affiliations

The IL-1β, IL-6, and TNF cytokine triad is associated with post-acute sequelae of COVID-19

Christoph Schultheiß et al. Cell Rep Med. .

Abstract

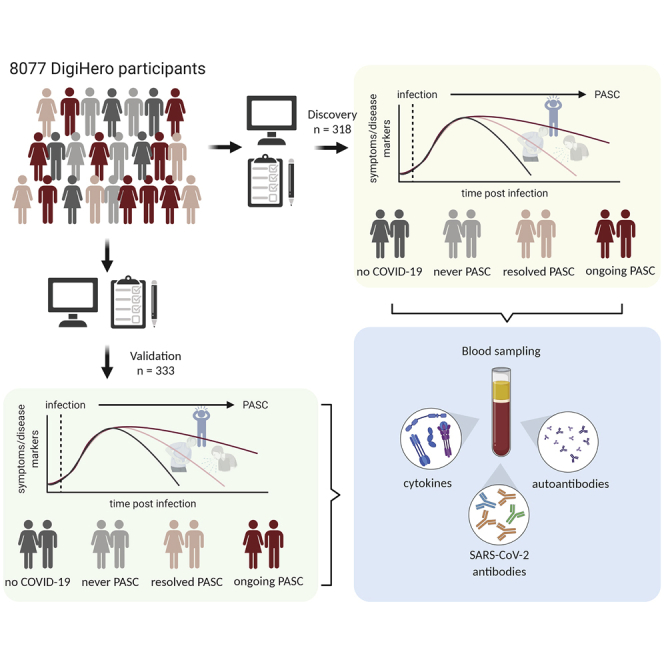
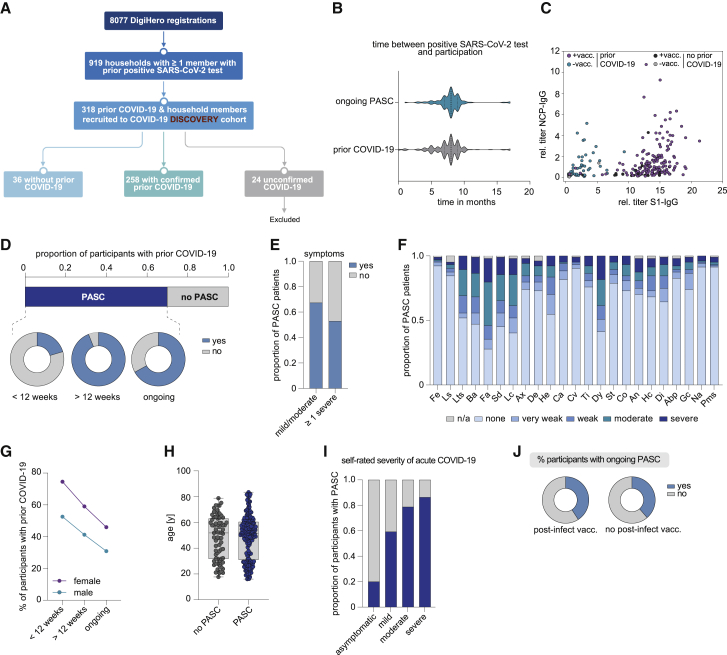
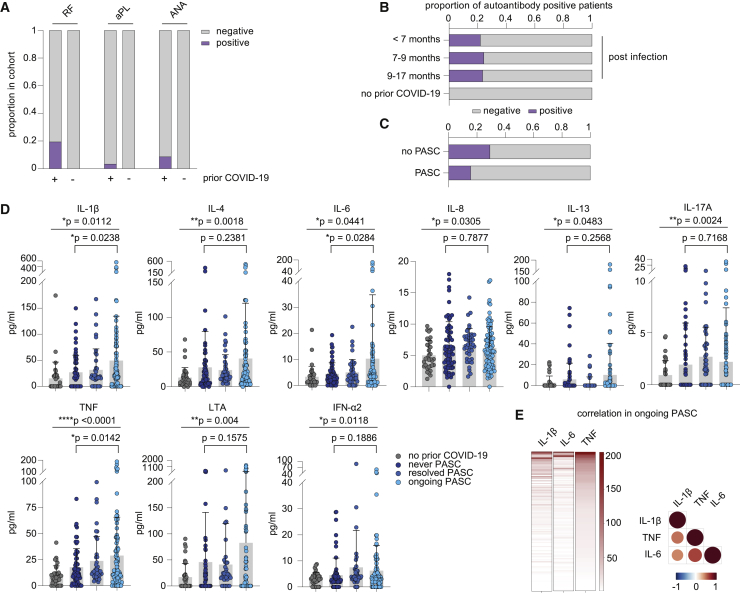
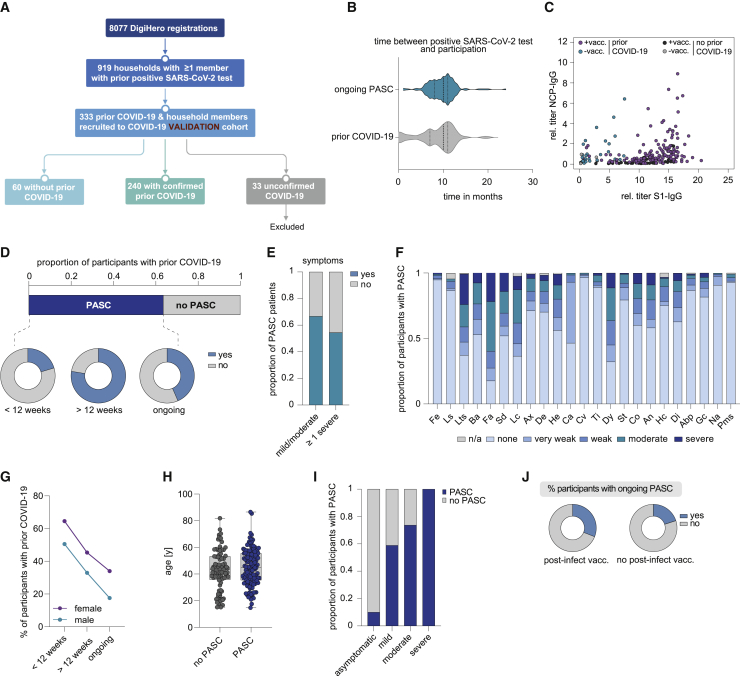
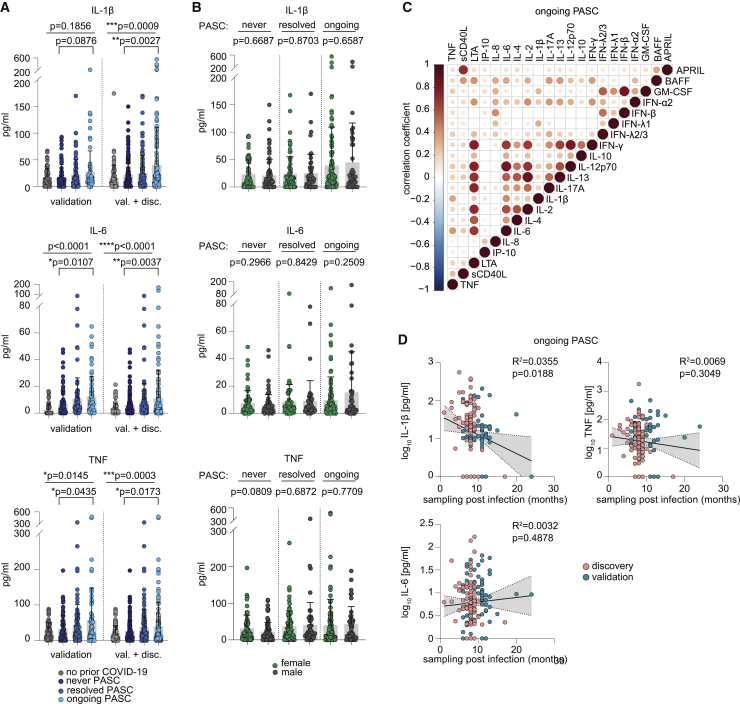
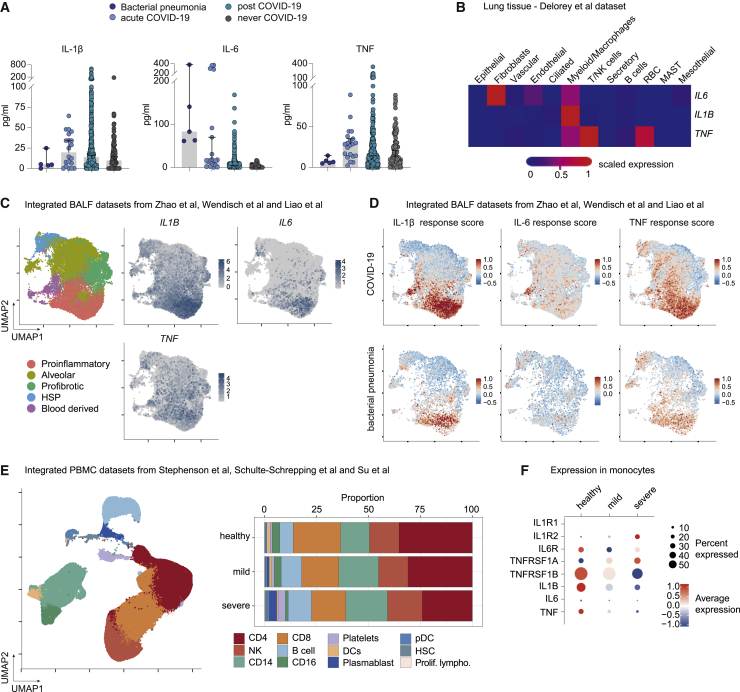
Post-acute sequelae of COVID-19 (PASC) is emerging as global problem with unknown molecular drivers. Using a digital epidemiology approach, we recruited 8,077 individuals to the cohort study for digital health research in Germany (DigiHero) to respond to a basic questionnaire followed by a PASC-focused survey and blood sampling. We report the first 318 participants, the majority thereof after mild infections. Of those, 67.8% report PASC, predominantly consisting of fatigue, dyspnea, and concentration deficit, which persists in 60% over the mean 8-month follow-up period and resolves independently of post-infection vaccination. PASC is not associated with autoantibodies, but with elevated IL-1β, IL-6, and TNF plasma levels, which we confirm in a validation cohort with 333 additional participants and a longer time from infection of 10 months. Blood profiling and single-cell data from early infection suggest the induction of these cytokines in COVID-19 lung pro-inflammatory macrophages creating a self-sustaining feedback loop.

Keywords: COVID-19; IL-1β; IL-6; PASC; SARS-CoV-2; TNF; cytokine; long covid; macrophage; post-acute sequelae of COVID-19.


Conflict of interest statement

Declaration of interests The authors declare no competing interests.

Figures

None
Graphical abstract
Figure 1
Figure 1
Clinical and epidemiological parameters of the DigiHero discovery cohort and patients with PASC (A) Flow chart of the COVID-19 module of the DigiHero study. (B) Median time from positive PCR or antigen test to participation in the module for the prior COVID-19 (n = 154) and ongoing PASC groups (n = 104). (C) Plasma titer of antibodies directed against the S1 and NCP proteins of SARS-CoV-2 in individuals with or without SARS-CoV-2 vaccination (+vacc./−vacc.) and with or without prior COVID-19 from the DigiHero cohort. (D) Proportion of DigiHero participants with self-reported PASC including duration of PASC symptoms after infection plus proportion of patients with ongoing symptoms at the time of blood sampling. (E) Proportion of PASC patients with mild/moderate or at least one severe symptom. (F) Severity of self-reported symptoms in PASC patients. (G) Distribution of PASC duration between female and male study participants with prior COVID-19. (H) Age distribution of DigiHero participants with or without PASC shown as box plot extending from the 25th to 75th percentiles. Median age is indicated as line. Bars represent range from smallest to highest value. (I) Severity of acute COVID-19 in PASC patients. Abp, abdominal pain; An, angina; Ax, anxiety; Ba, body aches; Ca, coryza; Co, cough; Cv, conjunctivitis; De, depression; Di, dizziness; Dy, dyspnea; Fa, fatigue; Fe, fever; Gc, gastrointestinal complaints; He, headache; Hc, heart complaints; Lc, lack of concentration; Ls, lymph node swelling; Lts, loss of taste/smell; Na, nausea; Sai, self-reported severity of acute infection; SD, sleep disturbance; St, sore throat; Ti, tinnitus. (J) Post-vaccination status of patients with ongoing PASC.
Figure 2
Figure 2
Serological profiling of plasma from patients of the discovery cohort with ongoing PASC, after resolved SARS-CoV-2 infection and after resolved PASC (A) Proportion of participants with rheumatic factor (RF), and antinuclear (ANA) and phospholipid autoantibodies (aPL) dependent on COVID-19 history. n (prior COVID-19) = 201; n (no prior COVID-19) = 36. (B) Seroprevalence of autoantibodies over time in COVID-19 patients. n (<7 months) = 41; n (7–9 months) = 152; n (>9 months) = 28. (C) Seroprevalence of autoantibodies in patients with ongoing PASC and individuals after infection without developing PASC. n (PASC) = 96; n (no PASC) = 65. (D) Mean plasma cytokine levels of participants who never reported PASC post-infection (n = 65), with ongoing PASC (n = 96), with resolved PASC (n = 41), and participants without prior COVID-19 (n = 36). Error bars indicate ± SD. Statistical analysis: Welch’s ANOVA for comparison of all four groups and two-sided Welch corrected t test for comparison of never PASC versus ongoing PASC groups. (E) Relation of IL-1β, IL-6, and TNF plasma levels in PASC patients displayed as heatmap (concentrations as pg/mL) and as correlation matrix.
Figure 3
Figure 3
Clinical and epidemiological parameters of the DigiHero validation cohort and patients with PASC (A) Flow chart of the COVID-19 module of the DigiHero study. (B) Median time from positive PCR or antigen test to participation in the module for the prior COVID-19 (n = 87) and ongoing PASC groups (n = 153). (C) Plasma titer of antibodies directed against the S1 and NCP proteins of SARS-CoV-2 in individuals with or without SARS-CoV-2 vaccination (+vacc./−vacc.) and with or without prior COVID-19 in the validation cohort. (D) Proportion of DigiHero participants with self-reported PASC including duration of PASC symptoms after infection plus proportion of patients with ongoing symptoms at the time of blood sampling. (E) Proportion of PASC patients with mild/moderate or at least one severe symptom. (F) Severity of self-reported symptoms in PASC patients. (G) Distribution of PASC duration between female and male study participants with prior COVID-19. (H) Age distribution of DigiHero participants with or without PASC shown as box plot extending from the 25th to 75th percentiles. Median age is indicated as line. Bars represent range from smallest to highest value. (I) Severity of acute COVID-19 in PASC patients. Abp, abdominal pain; An, angina; Ax, anxiety; Ba, body aches; Ca, coryza; Co, cough; Cv, conjunctivitis; De, depression; Di, dizziness; Dy, dyspnea; Fa, fatigue; Fe, fever; Gc, gastrointestinal complaints; He, headache; Hc, heart complaints; Lc, lack of concentration; Ls, lymph node swelling; Lts, loss of taste/smell; Na, nausea; Sai, self-reported severity of acute infection; SD, sleep disturbance; St, sore throat; Ti, tinnitus. (J) Post-vaccination status of patients with ongoing PASC.
Figure 4
Figure 4
Serological profiling of plasma from patients of the validation cohort with ongoing PASC, after resolved SARS-CoV-2 infection and after resolved PASC (A) Mean plasma cytokine levels of participants with prior COVID-19 from the validation cohort who never reported PASC (n = 86), with ongoing PASC (n = 89), or with resolved PASC (n = 65) and participants without prior COVID-19 (n = 60), as well as plasma cytokine levels in the combined discovery and validation cohorts: n (never COVID-19) = 96; n (no PASC) = 150; n (resolved PASC) = 106; n (ongoing PASC) = 185. Error bars indicate ± SD. Statistical analysis: Welch’s ANOVA for comparison of all four groups and two-sided Welch corrected t test for comparison of never PASC versus ongoing PASC groups. (B) Sex-dependent mean plasma cytokine levels in the never COVID-19 (71 females, 79 males), resolved PASC (77 females, 52 males), and ongoing PASC (116 females, 46 males) groups of the combined discovery and validation cohorts. Error bars indicate ± SD. Statistical analysis: two-sided Welch corrected t test. (C) Correlation matrix of all cytokines in the combined ongoing PASC group (n = 185). (D) Linear regression analysis of plasma cytokine levels and sampling time point post-infection in the combined ongoing PASC group (n = 185).
Figure 5
Figure 5
PASC-related cytokine triad in acute COVID-19 and profiling of IL1B, IL6, and TNF signatures in different tissues from hospitalized COVID-19 patients or individuals with mild to moderate COVID-19 courses (A) Median plasma levels of IL-1β, IL6, and TNF in acute COVID-19 (n = 20) and in post-acute disease phases (n = 471) as compared with patients with bacterial pneumonia (n = 5) or individuals without prior COVID-19 (n = 96). Samples from patients with bacterial pneumonia and acute COVID-19 derived from the HACO trial; follow-up blood samples derived from DigiHero and the HACO trial. Bars indicate 95% confidence interval. (B) Profiling of IL1B, IL6, and TNF transcripts in lung autopsy tissue from deceased COVID-19 patients. Single-cell transcriptome dataset from Delorey et al. (C) Macrophage subsets from bronchoalveolar (BAL) fluid in active COVID-19. Integrated single-cell dataset from Zhao et al., Wendisch et al., and Liao et al. encompassing 19,089 cells. Uniform Manifold Approximation and Projection (UMAP) plot showing expression of IL1B, IL6, and TNF in macrophage subpopulations. (D) Analysis of gene set associated with response to cytokine triad in macrophage subsets from bronchoalveolar fluid in active COVID-19. (E) Generation of an integrated peripheral blood mononuclear cell (PBMC) dataset encompassing 39 healthy individuals (140,472 cells), 50 COVID-19 patients with mild (167,160 cells) and 19 with severe (81,754 cells) courses with data derived from Stephenson et al., Schulte-Schrepping et al., and Su et al. (F) Expression of IL1B, IL6, TNF, and their receptors IL1R1, IL1R2, IL6R, TNFRSF1A, and TNFRSF1B in monocytes relative to the remaining cells in the integrated datasets from (E) shown as a dotplot.

References

    1. Salian V.S., Wright J.A., Vedell P.T., Nair S., Li C., Kandimalla M., Tang X., Carmona Porquera E.M., Kalari K.R., Kandimalla K.K. COVID-19 transmission, current treatment, and future therapeutic strategies. Mol. Pharm. 2021;18:754–771. doi: 10.1021/acs.molpharmaceut.0c00608. - DOI - PubMed
    1. Kumar A., Singh R., Kaur J., Pandey S., Sharma V., Thakur L., Sati S., Mani S., Asthana S., Sharma T.K., et al. Wuhan to world: the COVID-19 pandemic. Front. Cell. Infect. Microbiol. 2021;11:596201. doi: 10.3389/fcimb.2021.596201. - DOI - PMC - PubMed
    1. Ramos-Casals M., Brito-Zerón P., Mariette X. Systemic and organ-specific immune-related manifestations of COVID-19. Nat. Rev. Rheumatol. 2021;17:315–332. doi: 10.1038/s41584-021-00608-z. - DOI - PMC - PubMed
    1. Osuchowski M.F., Winkler M.S., Skirecki T., Cajander S., Shankar-Hari M., Lachmann G., Monneret G., Venet F., Bauer M., Brunkhorst F.M., et al. The COVID-19 puzzle: deciphering pathophysiology and phenotypes of a new disease entity. Lancet Respir. Med. 2021;9:622–642. doi: 10.1016/S2213-2600(21)00218-6. - DOI - PMC - PubMed
    1. Bartleson J.M., Radenkovic D., Covarrubias A.J., Furman D., Winer D.A., Verdin E. SARS-CoV-2, COVID-19 and the aging immune system. Nat. Aging. 2021;1:769–782. doi: 10.1038/s43587-021-00114-7. - DOI - PMC - PubMed

Publication types