. 2022 Jun 21;3(6):100661.
doi: 10.1016/j.xcrm.2022.100661.

Proteome profiling of cerebrospinal fluid reveals biomarker candidates for Parkinson's disease

Affiliations

Proteome profiling of cerebrospinal fluid reveals biomarker candidates for Parkinson's disease

Ozge Karayel et al. Cell Rep Med. .

Abstract

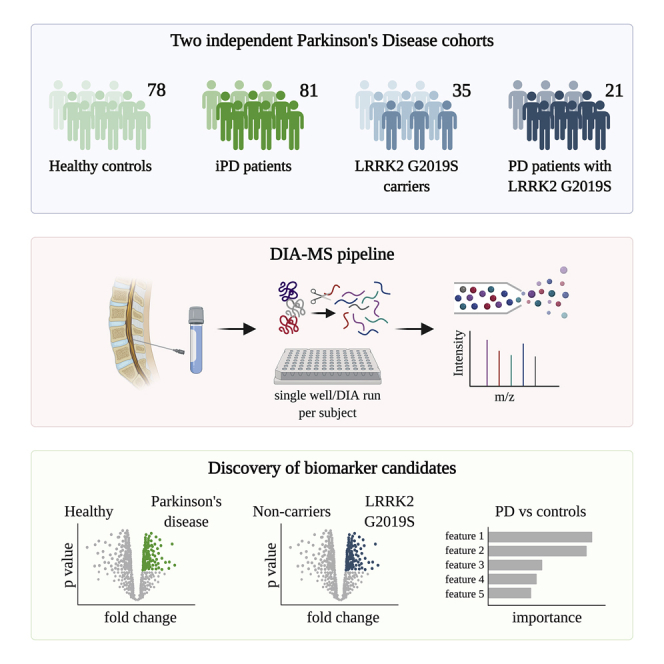
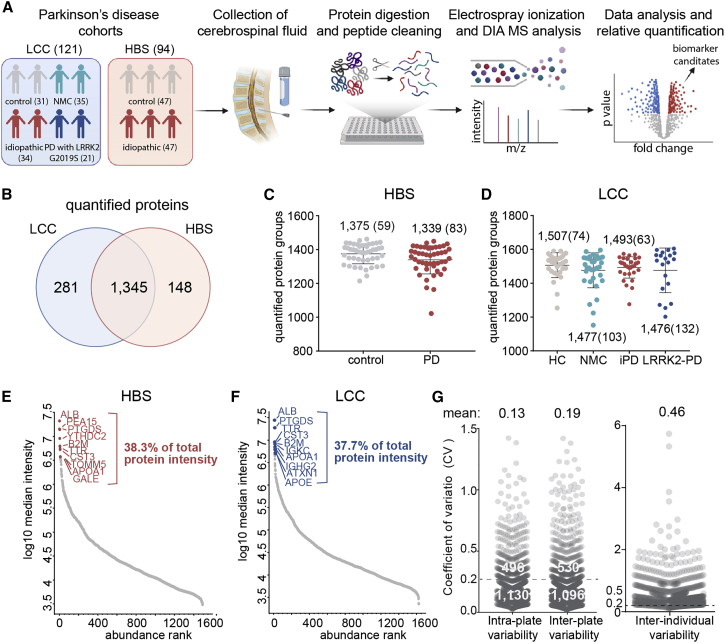
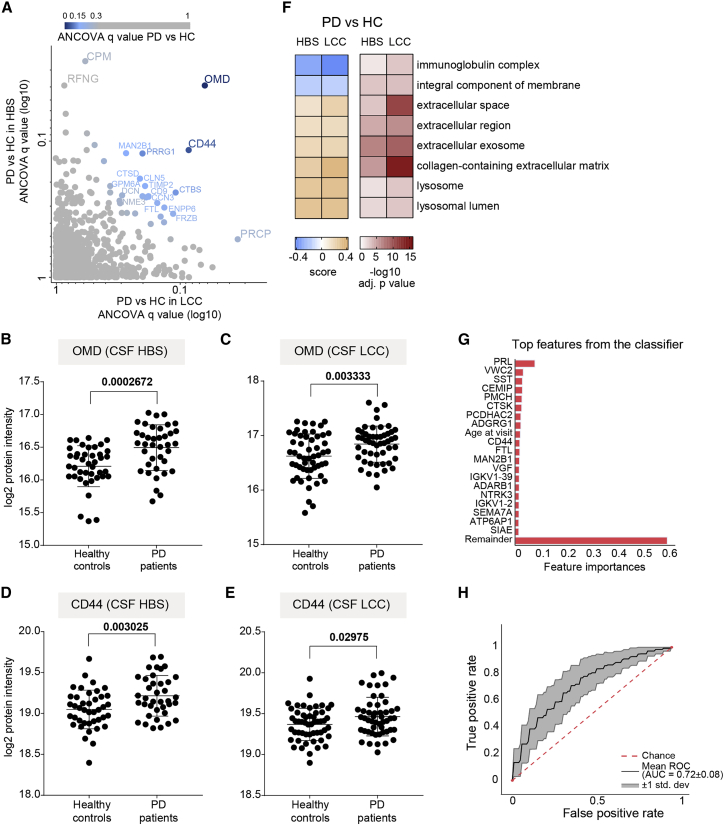
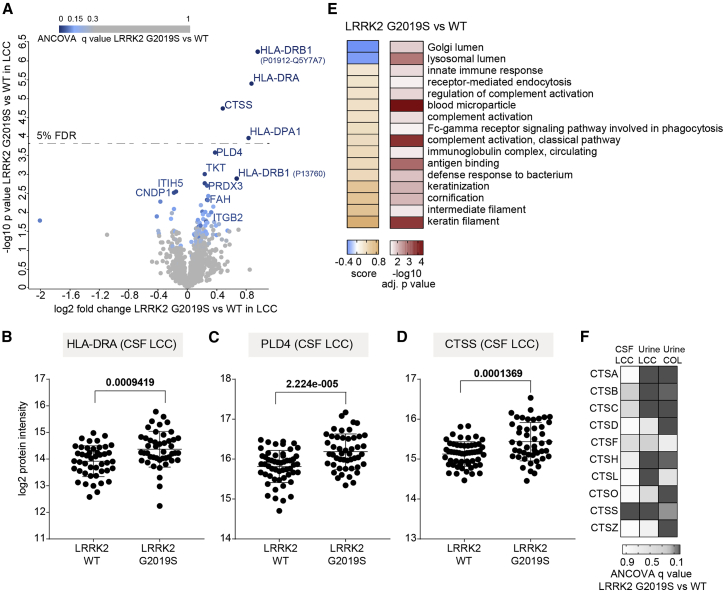
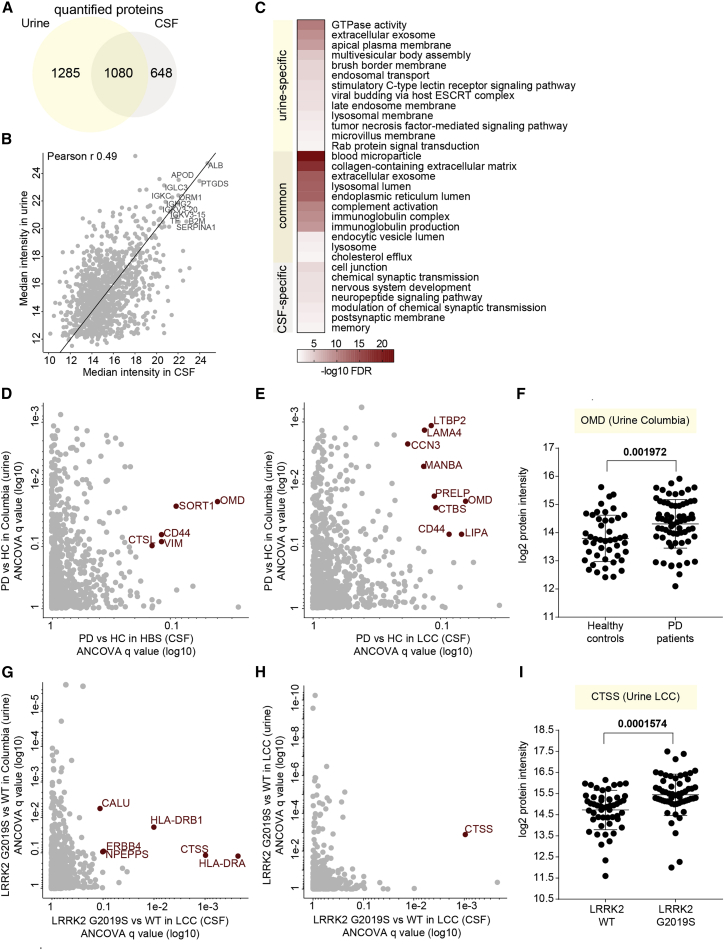
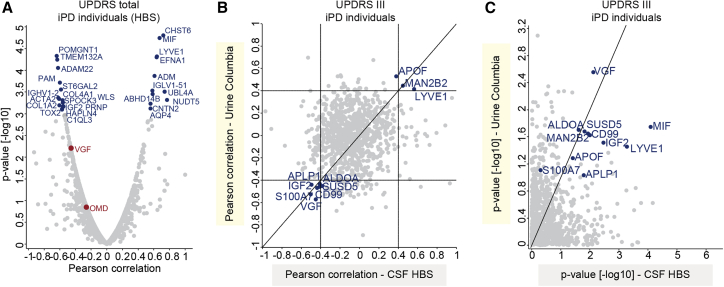
Parkinson's disease (PD) is a growing burden worldwide, and there is no reliable biomarker used in clinical routines to date. Cerebrospinal fluid (CSF) is routinely collected in patients with neurological symptoms and should closely reflect alterations in PD patients' brains. Here, we describe a scalable and sensitive mass spectrometry (MS)-based proteomics workflow for CSF proteome profiling. From two independent cohorts with over 200 individuals, our workflow reproducibly quantifies over 1,700 proteins from minimal CSF amounts. Machine learning determines OMD, CD44, VGF, PRL, and MAN2B1 to be altered in PD patients or to significantly correlate with clinical scores. We also uncover signatures of enhanced neuroinflammation in LRRK2 G2019S carriers, as indicated by increased levels of CTSS, PLD4, and HLA proteins. A comparison with our previously acquired urinary proteomes reveals a large overlap in PD-associated changes, including lysosomal proteins, opening up new avenues to improve our understanding of PD pathogenesis.

Keywords: CSF; DIA; LRRK2; Parkinson’s disease; biomarker; mass spectrometry; proteomics.


Conflict of interest statement

Declaration of interests The authors declare no conflicts of interest related to this work.

Figures

None
Graphical abstract
Figure 1
Figure 1
MS-based proteomic analysis of two independent CSF PD cohorts (A) Overview of the CSF proteomic workflow. CSF samples were prepared in 96-well plates using an automated liquid-handling system and analyzed by LC-MS/MS using data-independent acquisition (DIA). The total number of subjects per cohort group is shown. (B) A total of 1,345 proteins were consistently quantified in both cohorts. (C and D) Number of proteins identified and quantified with a 1% false discovery rate (FDR) in each sample in the HBS (C) and LCC (D) cohorts. Numbers indicate mean and standard deviation (SD). (E and F) Proteins identified in the HBS (E) and LCC (F) cohorts were ranked according to their MS signals. The top 10 most abundant proteins are labeled, and their relative contribution to the total protein intensity is indicated. (G) Quantification precision assessed by calculating the intra- and inter-plate (between repeated measurements of the same sample) and inter-individual coefficients of variation (CVs) of all proteins. Number of proteins with a CV below and above 20% and mean CV values are shown.
Figure 2
Figure 2
Quality assessment of two independent CSF PD cohorts (A and B) Assessment of study quality by determining the percentage of the summed intensity of the proteins in the respective quality marker panel and the summed intensity of all proteins in the HBS (A) and LCC (B) cohorts. Erythrocyte-specific protein panel (red), platelet marker panel (turquois), coagulation marker panel (orange), and the top 10 most abundant protein panel (dark gray) are included in these analyses. The proteins in each quality marker panel are listed in Table S3. (C and D) Histograms of log2 ratios of the summed intensity of the erythrocyte-specific proteins and the summed intensity of all proteins in the HBS (C) and LCC (D) cohorts. A sample was flagged for potential contamination and removed from further analysis if the ratio differed more than one SD from the mean of all samples within the cohort. (E) Comparison of erythrocyte counts in CSF following sample collection and degree of erythrocyte contamination as determined by MS-based proteomics of all LCC cohort samples. Samples colored in red were excluded from further analysis based on the distribution shown in (D). (F) Grouping samples in the LCC cohort for four sample collection centers demonstrated a high degree of contamination with erythroid-specific proteins for study centers 2 and 4, whereas there was no indication of this in study centers 1 and 3.
Figure 3
Figure 3
PD-related alterations in CSF proteome and ML-based classification of PD status (A) Correlation of ANCOVA q values of all proteins quantified in the CSF of PD patients compared with controls in the HBS and LCC cohorts. Color gradient is based on the mean of ANCOVA q values (PD versus HC) obtained in the LCC and HBS cohorts. (B and C) Osteomodulin (OMD) protein intensity (log2) distribution in controls and PD patients of the HBS (B) and LCC (C) cohorts. We applied an unpaired t test and the resulting p value is shown. (D and E) CD44 protein intensity (log2) distribution in controls and PD patients of the HBS (D) and LCC (E) cohorts; the corresponding p values from unpaired t test are shown. In panels B-E, lines indicate mean and SD. (F) Annotation enrichment of GO terms using the PD versus HC fold changes (5% FDR). All significantly enriched GO terms that were common in both cohorts are displayed. Terms with positive enrichment scores are enriched in PD over HC and vice versa. (G) Feature importance of the top 20 most important features used to distinguish PD+ versus PD–individuals. (H) ROC curve and corresponding AUC statistics in 5-fold cross-validation repeated 10 times using the XGBoost-based model to classify PD versus HC based on protein panel in (G). Random performance is indicated by the dotted diagonal red line for comparison. Gray area represents the SD from the mean ROC curve. Blue lines show the values for a total of repeats with five stratified train-test splits.
Figure 4
Figure 4
Effect of the pathogenic LRRK2 G2019S mutation on the CSF proteome (A) Volcano plot comparing the CSF proteomes of LRRK2 G2019S versus WT carriers. The fold change in protein levels is depicted on the x axis and the –log10 t test p value on the y axis. Color scale is based on ANCOVA q values of the proteins differentially present in the CSF of LRRK2 G2019S carriers compared with the WT controls in the LCC cohort. Proteins with ANCOVA q values <5% are labeled. (B–D) HLA-DRA (B), PLD4 (C), and CTSS (D) protein intensity (log2) distributions in LRRK2 G2019S and WT carriers of the LCC cohort; p values of an unpaired t test are shown. Lines indicate mean and SD. (E) Annotation enrichment of GO terms using the LRRK2 G2019S versus WT fold changes (5% FDR). Terms with positive enrichment scores are enriched in the G2019S mutation over the WT and vice versa. (F) Heatmap of ANCOVA q values of all cathepsin proteins, which were quantified in both CSF and urine of LRRK2 G2019S carriers compared with the WT controls.
Figure 5
Figure 5
Integration of CSF and urine proteome profiles (A) Overlapping proteins between the CSF and urinary proteomes. (B) CSF-urine proteome abundance map based on median MS intensities of common proteins. Highly abundant proteins in both datasets are labeled as examples. (C) Fisher exact test to identify significantly enriched GO terms among the common and urine- and CSF-specific protein groups. Significant and non-redundant GO terms are displayed (FDR <5%). (D) Correlation of ANCOVA q values of the proteins differentially present in the CSF (HBS) and urine (Columbia) of PD patients compared with controls. (E) Correlation of ANCOVA q values of the proteins differentially present in the CSF (LCC) and urine (Columbia) of PD patients compared with controls. (F) OMD protein intensity distribution in the urine of controls and PD patients of the Columbia cohort. Results of unpaired t test are shown. The lines indicate mean and SD. (G) Correlation of ANCOVA q values of the proteins differentially present in the CSF (LCC) and urine (Columbia) of LRRK2 G2019S carriers compared with the LRRK2 WT controls. (H) Correlation of ANCOVA q values of the proteins differentially present in the CSF (LCC) and urine (LCC) of LRRK2 G2019S carriers compared with the LRRK2 WT controls. (I) CTSS protein intensity (log2) distribution in the urine of LRRK2 G2019S and WT carriers of the LCC cohort. Results of an unpaired t test are shown. The lines indicate mean and SD.
Figure 6
Figure 6
Correlation of CSF and urinary proteomes with UPDRS scores in idiopathic PD (iPD) patients (A) Correlation analysis of protein intensities in CSF with the UPDRS total scores in iPD patients. Pearson correlation coefficients and –log10 p values are displayed on the x and y axes, respectively. Proteins significantly correlating with UPDRS score (positively or negatively with a p value < 0.001) are labeled. (B) Correlation between Pearson correlation coefficients for correlation of urinary and CSF proteomes with UDPRS III scores. (C) Correlation between –log10 p values for correlation of urinary and CSF proteomes with UDPRS III scores. The proteins with Pearson correlation coefficients >0.4 and < −0.4 in both datasets are labeled in (B) and (C).

References

    1. Reeve A., Simcox E., Turnbull D. Ageing and Parkinson's disease: why is advancing age the biggest risk factor? Ageing Res. Rev. 2014;14:19–30. doi: 10.1016/j.arr.2014.01.004. - DOI - PMC - PubMed
    1. Tysnes O.B., Storstein A. Epidemiology of Parkinson's disease. J. Neural. Transm. 2017;124:901–905. doi: 10.1007/s00702-017-1686-y. - DOI - PubMed
    1. de Lau L.M., Breteler M.M. Epidemiology of Parkinson's disease. Lancet Neurol. 2006;5:525–535. doi: 10.1016/s1474-4422(06)70471-9. - DOI - PubMed
    1. Klein C., Westenberger A. Genetics of Parkinson's disease. Cold Spring Harb. Perspect. Med. 2012;2:a008888. doi: 10.1101/cshperspect.a008888. - DOI - PMC - PubMed
    1. Schneider S.A., Alcalay R.N. Precision medicine in Parkinson's disease: emerging treatments for genetic Parkinson's disease. J. Neurol. 2020;267:860–869. doi: 10.1007/s00415-020-09705-7. - DOI - PMC - PubMed

Publication types