. 2022 Jun 28;39(13):111009.
doi: 10.1016/j.celrep.2022.111009. Epub 2022 Jun 8.

Cryo-EM structures of SARS-CoV-2 Omicron BA.2 spike

Affiliations

Cryo-EM structures of SARS-CoV-2 Omicron BA.2 spike

Victoria Stalls et al. Cell Rep. .

Abstract

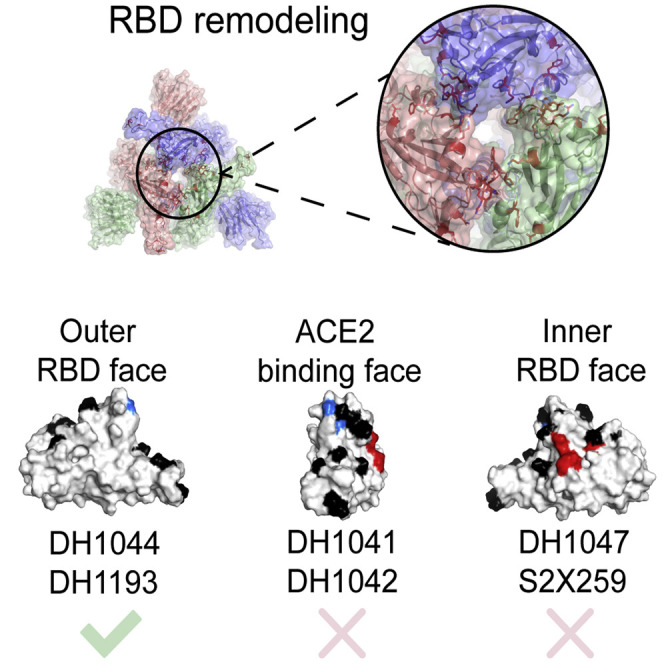
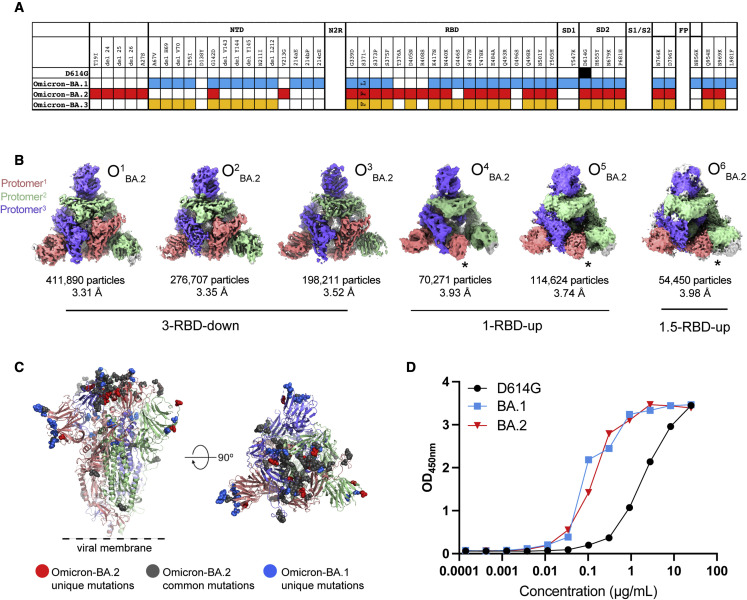
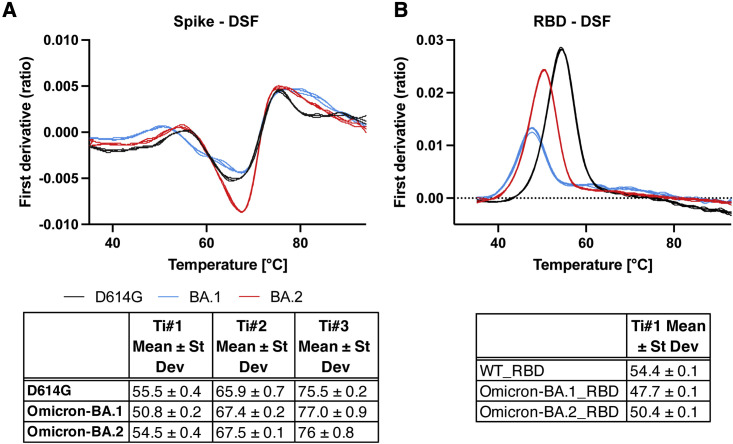
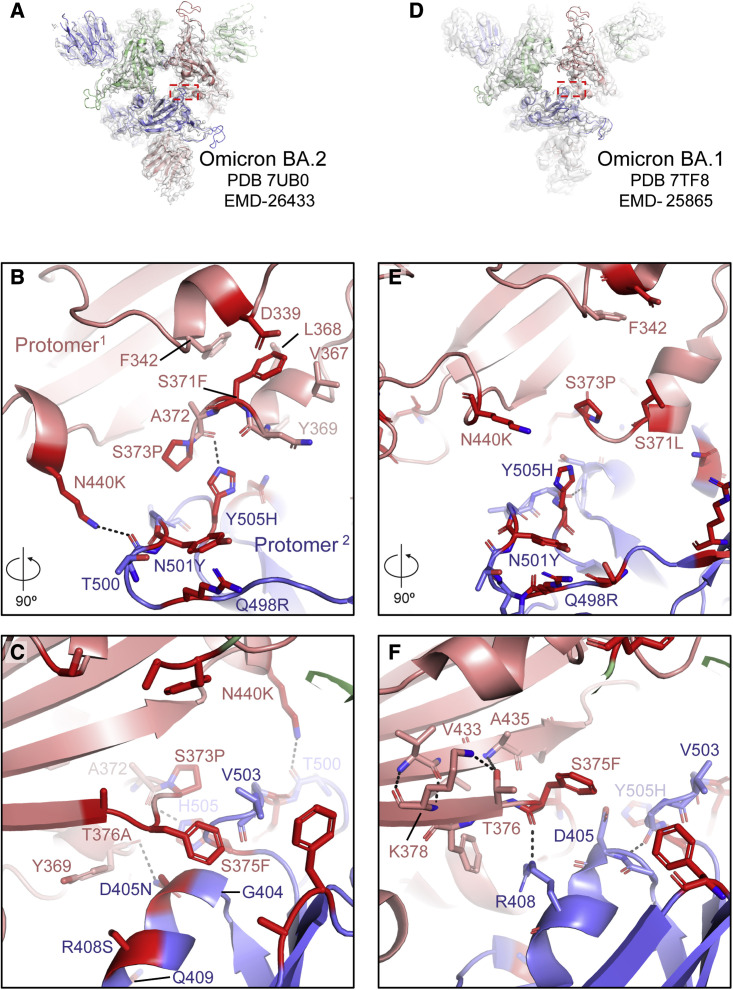
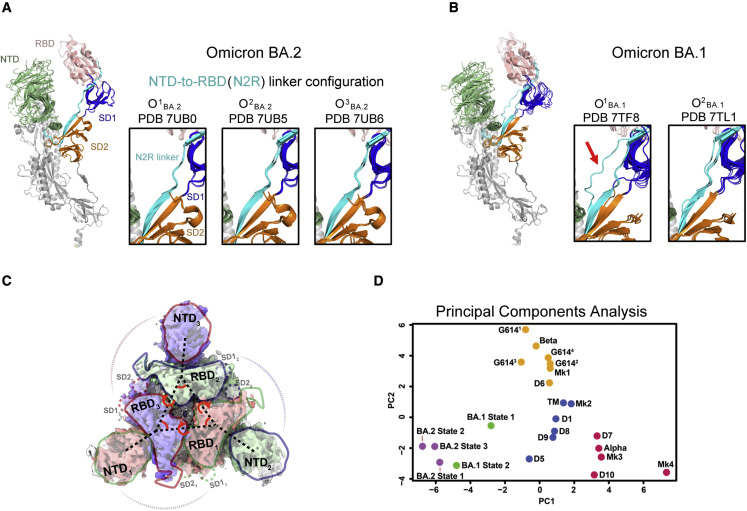
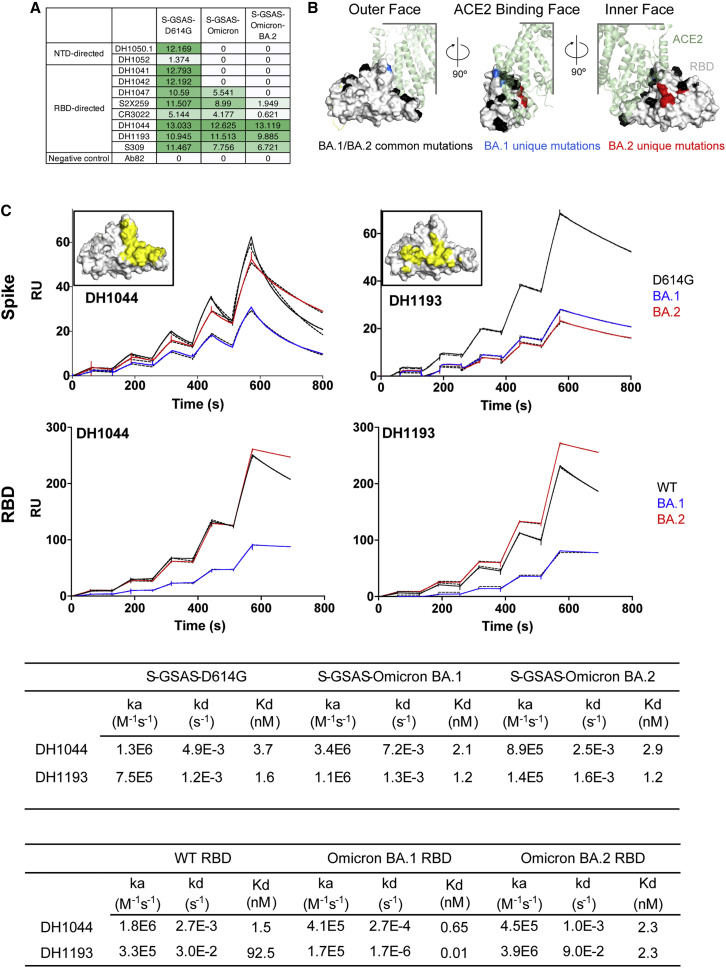
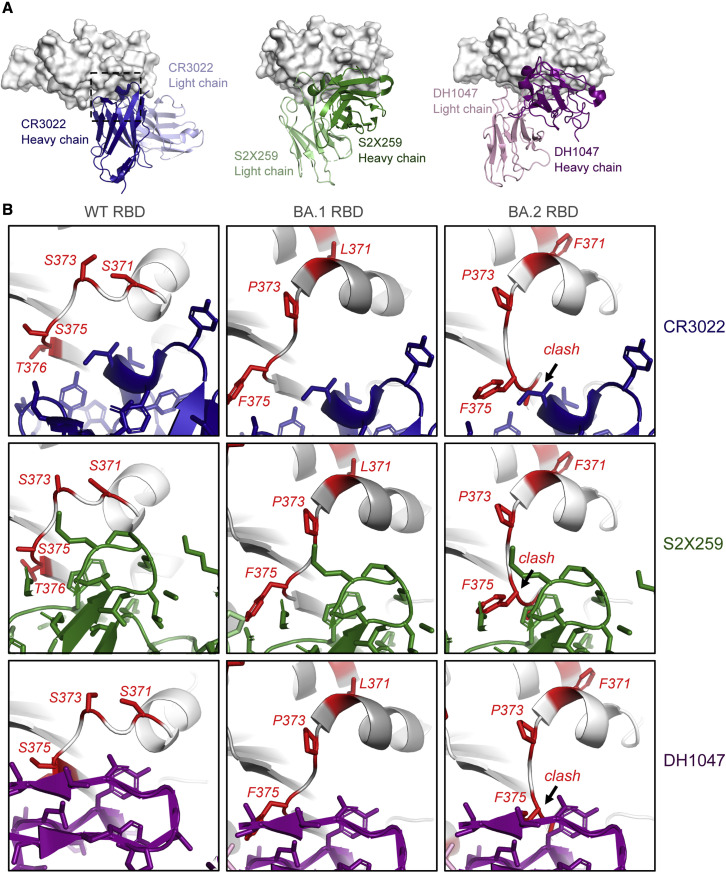
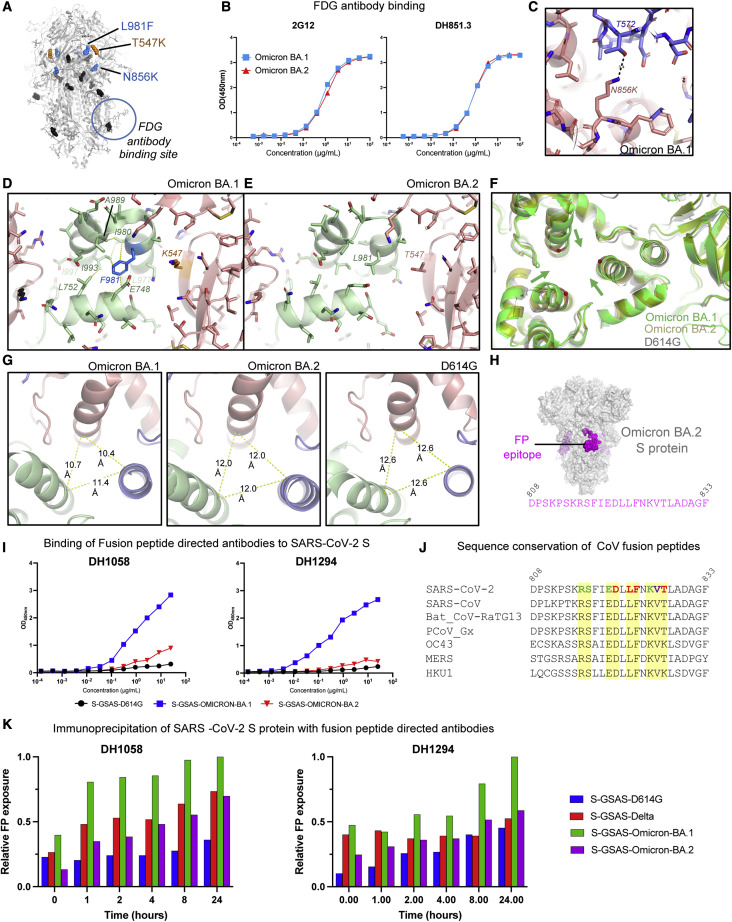
The severe acute respiratory syndrome coronavirus 2 (SARS-CoV-2) Omicron BA.2 sub-lineage has gained in proportion relative to BA.1. Because spike (S) protein variations may underlie differences in their pathobiology, here we determine cryoelectron microscopy (cryo-EM) structures of the BA.2 S ectodomain and compare these with previously determined BA.1 S structures. BA.2 receptor-binding domain (RBD) mutations induce remodeling of the RBD structure, resulting in tighter packing and improved thermostability. Interprotomer RBD interactions are enhanced in the closed (or 3-RBD-down) BA.2 S, while the fusion peptide is less accessible to antibodies than in BA.1. Binding and pseudovirus neutralization assays reveal extensive immune evasion while defining epitopes of two outer RBD face-binding antibodies, DH1044 and DH1193, that neutralize both BA.1 and BA.2. Taken together, our results indicate that stabilization of the closed state through interprotomer RBD-RBD packing is a hallmark of the Omicron variant and show differences in key functional regions in the BA.1 and BA.2 S proteins.

Keywords: CP: Microbiology; Omicron BA.2; SARS-CoV-2 spike; cryoelectron microscopy; fusion peptide; immune evasion; receptor binding domain.


Conflict of interest statement

Declaration of interests B.F.H., K.O.S., B.K., X.L., R.J.E., S.M.-C.G., and P.A. are named in patents submitted on the SARS-CoV-2 monoclonal antibodies studied in this paper. Other authors declare no competing interests.

Figures

None
Graphical abstract
Figure 1
Figure 1
Structural characterization of SARS-CoV-2 Omicron-BA.2 spike (S) protein (A) Comparison of residue changes in the S ectodomain (S-GSAS) of SARS-CoV-2 D614G and Omicron variant sub-lineages. Residue changes from the original Wuhan strain are color coded for the variants: D614G (black), BA.1 (blue), BA.2 (red), and BA.3 (yellow). (B) cryo-EM reconstructions of Omicron-BA.2 S protein 3-RBD-down (O1BA.2: EMD: 26433, PDB: 7UB0; O2BA.2: EMD: 26435, PDB: 7UB5; O3BA.2: EMD: 26436, PDB: 7UB6), 1-RBD-up (O4BA.2: EMD: 26644, O5BA.2: EMD: 26647), and 1.5-RBD-up (O6BA.2: EMD: 26643 ) states, colored by protomer, and viewed from the host cell membrane. In the RBD-up reconstructions, the “up” RBD is indicated by an asterisk (). (C) Omicron-BA.2 S 3-RBD-down structure (O1BA.2: EMD: 26433; PDB: 7UB0) colored by protomer, with common mutations shown as gray spheres, BA.2 unique mutations colored red, and BA.1 unique mutations colored blue. (D) ACE-2 binding to SARS-CoV-2 S proteins measured by ELISA. OD450nm, optical density 450 nm. See also Figures S1–S4 and Table S1.
Figure 2
Figure 2
Thermostability of SARS-CoV-2 S ectodomain and RBD (A) (Top) DSF profiles of the SARS-CoV-2 S ectodomains showing changes in protein intrinsic fluorescence (expressed as the first derivative of the ratio between fluorescence at 350 and 330 nm) with temperature. For each S protein construct, three overlaid curves (technical replicates) are shown. (Bottom) Maxima and minima indicate inflection temperatures, Ti nos. 1–3 (Ti#1, Ti#2, and Ti#3) are represented as mean ± standard deviation from three technical replicates. (B) Same as (A) but for a monomeric RBD construct. See also Figures S2 and S9.
Figure 3
Figure 3
Omicron BA.2 S mutations induce RBD interfacial loop remodeling, facilitating tight packing of the 3-RBD-down state (A) View of the Omicron BA.2 S protein O1BA.2 state with the red dotted rectangle indicating the region shown in (B) and (C). (B and C) 90° rotated views of the interface between two RBDs in the 3-RBD-down O1BA.2 structure. The sites of mutation are colored red and the residues shown in sticks. (D) Same as (A) but for the Omicron BA.1 S protein O1 state (O1BA.1), with the red rectangle indicating the region shown in (E) and (F). (E and F) Same as (B) and (C) but for the Omicron BA.1 S protein O1BA.1 structure. See also Figures S5, S7, S8, and S10.
Figure 4
Figure 4
Intra- and interprotomer communication in the Omicron BA.2 3-RBD-down states (A) Omicron BA.2 3-RBD-down structures shown with the three protomers aligned using S2 subunit residues 908–1,035. The structures are colored by domain; green, NTD; salmon, RBD; cyan, N2R linker; blue, SD1 subdomain; orange, SD2 subdomain; white, S2 subunit. The insets show zoomed-in views of the N2R region that connects the NTD and RBD within a protomer for the Omicron BA.2 S 3-RBD-down structures O1BA.2 (PDB: 7UB0), O2BA.2 (PDB: 7UB5), and O3BA.2 (PDB: 7UB6). (B) Same as (A) but for the Omicron BA.1 3-RBD-down structures O1BA.1 (PDB: 7TF8) and O2BA.1 (PDB: 7TL1). The red arrow in (B) is pointing to the N2R rearranged state that was observed in one of the protomers in the O1BA.1 (PDB: 7TF8) structure. (C) Interprotomer vectors describing the relationship between the NTDs, RBDs, and subdomains across protomers overlaid on the O1BA.2 (EMDB: 26433) cryo-EM reconstruction. (D) Principal-component analysis of the interprotomer vector network distances, angle, and dihedrals for SARS-CoV-2 variant structures. Green, yellow, blue, and red points are K means cluster assignments (K = 4) for PCA of the dataset excluding the BA.2 variant. Each point represents a variant structure. The BA.2 structures are indicated by purple points. The variants shown include D614G (G6141, G6142, G6143, and G6144), Alpha, Beta, Delta (D1, D5, D6, D7, D8, D9, and D10); a spike (TM) with substitutions in three RBD position—K417, E484, and N501—that are mutated in multiple variants, including Gamma and Beta; a mink-associated variant (Mk1, Mk2, Mk3, and Mk4); BA.1 state 1 (O1BA.1) and state 2 (O2BA.1); and BA.2 (O1BA.2, O2BA.2, and O3BA.2). See also Figure S6.
Figure 5
Figure 5
Antigenicity of the SARS-CoV-2 Omicron BA.2 S protein (A) Antibody binding to SARS-CoV-2 S proteins measured by ELISA. The binding values were obtained by calculating area under curve of ELISA binding curves shown in Figure S11 and are color coded with a dark green to white gradient where dark green indicates tighter binding and white indicates no binding. (B) Locations of Omicron BA.1 and BA.2 mutations mapped on the RBD surface. The RBD surface is shown in light gray, with the mutations that are common between BA.1 and BA.2 colored black; those that occur only in BA.1, but not in BA.2, are colored blue; and those that occur in BA.2, but not in BA.1, are colored red. ACE2 is shown bound to the RBD in transparent green cartoon representation. (C) First row: binding of DH1044 and DH1193 Fabs to D614G (black), BA.1 (blue), and BA.2 (red) S protein ectodomains measured by SPR. Second row: binding of antibodies DH1044 and DH1193 to WT (black), Omicron-BA.1 (blue), and Omicron-BA.2 (red) RBD, measured by SPR using single-cycle kinetics, is shown. The solid lines are the binding sensorgrams; the dotted lines show fits of the data to a 1:1 Langmuir binding model. Affinity and kinetics of DH1044 and DH1193 Fab binding to the (top) S protein ectodomain and (bottom) monomeric RBD-only constructs are tabulated below. The insets show the binding footprints (colored yellow) of the DH1044 and DH1193 on the surface of the RBD (colored gray). The antibody binding footprints are obtained from previously published NSEM structures (Li et al., 2021; Gobeil et al., 2022). The RBD orientation shown in the inset figures is identical to that in the leftmost panel in (B). See also Figures S11 and S12 and Table S1.
Figure 6
Figure 6
Structural basis for loss in binding of class 4 RBD-binding antibodies to Omicron BA.2 S protein (A) (Left) Crystal structure of CR3022 bound to SARS-CoV-2 WT RBD (PDB: 7LOP), with the RBD shown as gray surface and CR3022 heavy and light chains colored dark blue and light blue, respectively. The dotted square indicates the zoomed-in areas shown in (B). (Middle) cryo-EM structure of S2X259 bound to SARS-CoV-2 WT RBD (PDB: 7RAL) is shown, with the RBD shown as gray surface, and S2X259 heavy and light chains colored dark green and light green, respectively. (Right) cryo-EM structure of DH1047 bound to SARS-CoV-2 WT RBD (PDB: 7LD1) is shown, with the RBD shown as gray surface, and DH1047 heavy and light chains colored dark magenta and light pink, respectively. (B) Zoomed-in images of antibodies CR3022 (blue; PDB: 7LOP), S2X259 (green; PDB: 7RAL), and DH1047 (magenta; PDB: 7LD1), bound to WT RBD (leftmost panels). The middle and right panels show models of the antibodies bound to BA.1 (PDB: 7TF8) and BA.2 (PDB: 7UBO) RBDs. The models were prepared by aligning the variant RBDs with the antibody-bound RBD in each structure. For the WT RBD, residues that are mutated in the Omicron BA.2 variant are colored red and shown as sticks. For the BA.1 and BA.2 RBDs, the mutated residues in each are colored red. A region where the RBD 371–376 loop clashes with the antibody is indicated in the BA.2 RBD-bound models. See also Figures S11 and S12.
Figure 7
Figure 7
Conformation and antigenicity of the S2 subunit of the Omicron BA.2 S protein (A) Omicron BA.1 S shown in gray with S2 and SD1 mutations shown as spheres. The S2 mutations that BA.1 and BA.2 have in common are colored black. The L981F and N856K substitutions that occur in the BA.1, but not in the BA.2, S are colored blue, and the SD1 T547K substitution that occurs in BA.1, but not in the BA.2, S is colored orange. The glycan cluster that binds Fab-dimerized glycan-reactive (FDG) antibodies is marked with a circle. (B) Binding of FDG antibodies 2G12 and DH851.3 to Omicron BA.1 and BA.2 S proteins. (C) Zoom in of the region around the N856K substitution in the BA.1 S, showing an interprotomer hydrogen bond between K856 and T572. (D) Zoom in of the region around the L981F and T547K substitutions in the Omicron BA.1 spike. The yellow dotted lines indicate van der Waals contacts. (E) Same as in (D) but for the Omicron BA.2 S. (F) Overlay of the D614G, BA.1, and BA.2 Ss, showing the movement of the BA.1 S2 subunit helices toward the center of the trimer axis. (G) View of the S2 subunit helices, showing interprotomer distances between the Cα atom of residue R995, which was used to measure the differences in the arrangement of this region between the different Ss. (H) Omicron BA.2 spike with the location of the fusion peptide shown in magenta. The sequence below spans the magenta regions mapped on the structure. (I) ELISA binding of antibodies (left) DH1058 and (right) DH1294 to the D614G (black), BA.1 (blue), and BA.2 (red) S protein ectodomains. (J) Sequence alignment of the fusion peptide region in diverse CoV S proteins. In the SARS-CoV-2 sequence, the colored residues indicate contacts observed with FP-directed antibody DH1058 in the crystal structure of FP bound to DH1058 (PDB: 7TOW). Red indicates residues that make both main-chain and side-chain contacts, green indicates residues that only make side-chain contacts, and purple indicates residues that contact DH1058 only through the main chain. Contacts indicated here include both direct contact with the antibody as well as water-mediated contacts. (K) Time-dependent exposure of fusion peptide (FP) to FP-directed antibodies, DH1058 and DH1294, shown as relative FP exposure ranging from 0 to 24 h. See also Figures S14 and S15.

References

    1. Afonine P.V., Poon B.K., Read R.J., Sobolev O.V., Terwilliger T.C., Urzhumtsev A., Adams P.D. Real-space refinement inPHENIXfor cryo-EM and crystallography. Acta. Crystallogr. D Struct. Biol. 2018;74:531–544. doi: 10.1107/s2059798318006551. - DOI - PMC - PubMed
    1. Barnes C.O., West A.P., Jr., Huey-Tubman K.E., Hoffmann M.A.G., Sharaf N.G., Hoffman P.R., Koranda N., Gristick H.B., Gaebler C., Muecksch F., et al. Structures of human antibodies bound to SARS-CoV-2 spike reveal common epitopes and recurrent features of antibodies. Cell. 2020;182:828–842.e16. doi: 10.1016/j.cell.2020.06.025. - DOI - PMC - PubMed
    1. Cameroni E., Bowen J.E., Rosen L.E., Saliba C., Zepeda S.K., Culap K., Pinto D., Vanblargan L.A., De Marco A., Di Iulio J., et al. Broadly neutralizing antibodies overcome SARS-CoV-2 Omicron antigenic shift. Nature. 2021;602:664–670. doi: 10.1038/s41586-021-04386-2. - DOI - PMC - PubMed
    1. Case J.B., Mackin S., Errico J., Chong Z., Madden E.A., Guarino B., Schmid M.A., Rosenthal K., Ren K., Jung A., et al. Resilience of S309 and AZD7442 monoclonal antibody treatments against infection by SARS-CoV-2 Omicron lineage strains. bioRxiv. 2022 doi: 10.1101/2022.03.17.484787. Preprint at. - DOI - PMC - PubMed
    1. Cerutti G., Guo Y., Liu L., Liu L., Zhang Z., Luo Y., Huang Y., Wang H.H., Ho D.D., Sheng Z., Shapiro L. Cryo-EM structure of the SARS-CoV-2 Omicron spike. Cell Rep. 2022;38 doi: 10.1016/j.celrep.2022.110428. - DOI - PMC - PubMed

Publication types

Supplementary concepts