Comparative Study
. 2022 Aug;608(7921):135-145.
doi: 10.1038/s41586-022-04966-w. Epub 2022 Jun 22.

Women are credited less in science than men

Affiliations
Comparative Study

Women are credited less in science than men

Matthew B Ross et al. Nature. 2022 Aug.

Erratum in

Abstract

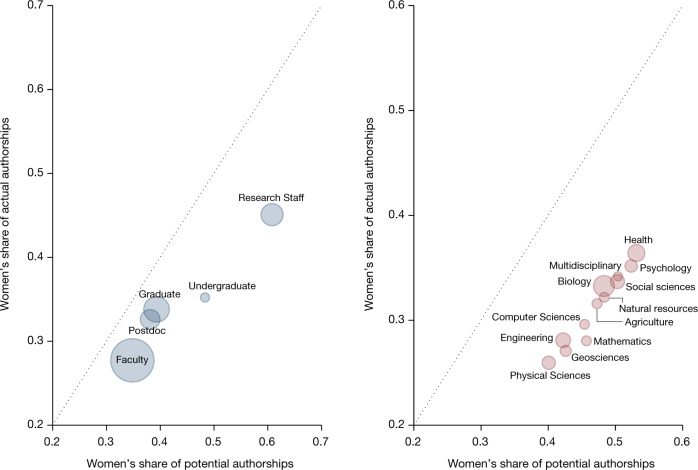
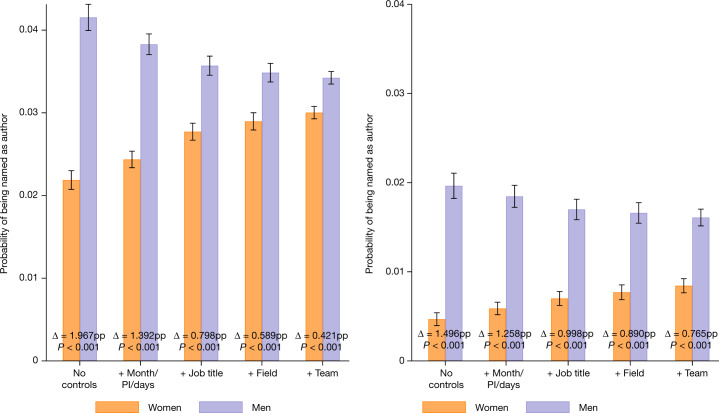
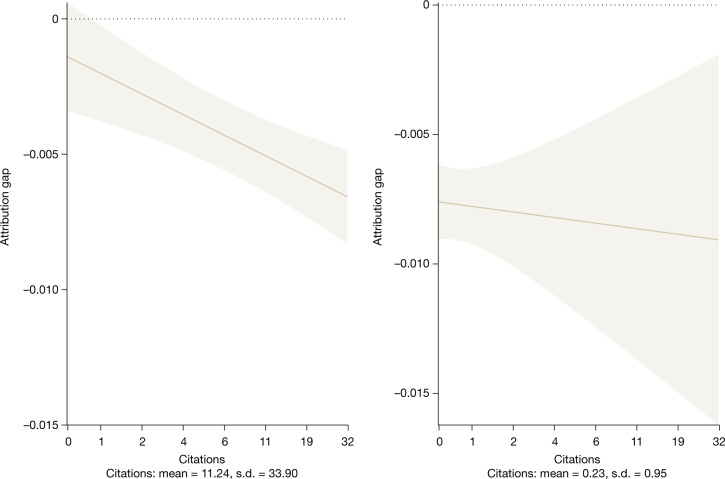
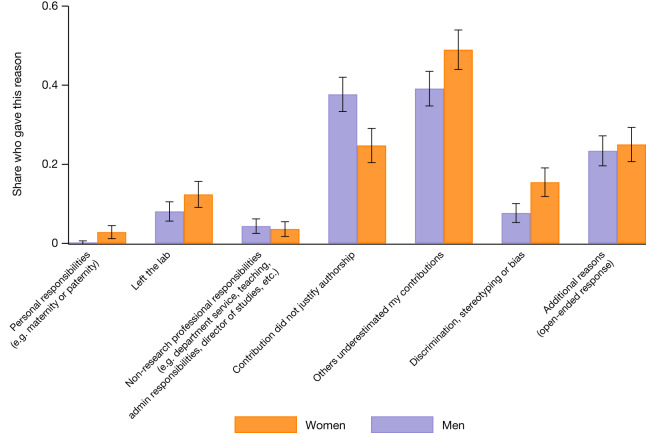
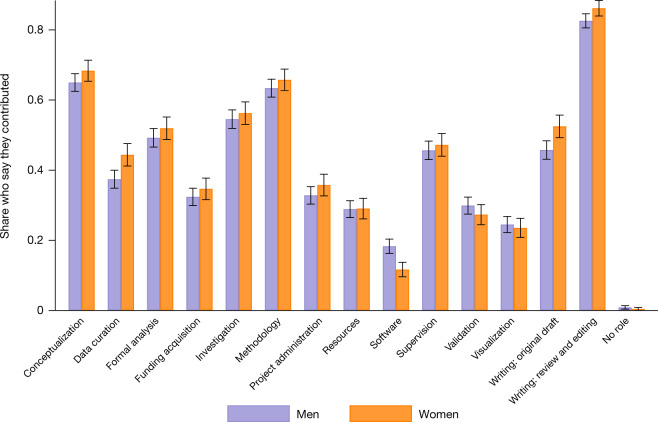
There is a well-documented gap between the observed number of works produced by women and by men in science, with clear consequences for the retention and promotion of women1. The gap might be a result of productivity differences2-5, or it might be owing to women's contributions not being acknowledged6,7. Here we find that at least part of this gap is the result of unacknowledged contributions: women in research teams are significantly less likely than men to be credited with authorship. The findings are consistent across three very different sources of data. Analysis of the first source-large-scale administrative data on research teams, team scientific output and attribution of credit-show that women are significantly less likely to be named on a given article or patent produced by their team relative to their male peers. The gender gap in attribution is present across most scientific fields and almost all career stages. The second source-an extensive survey of authors-similarly shows that women's scientific contributions are systematically less likely to be recognized. The third source-qualitative responses-suggests that the reason that women are less likely to be credited is because their work is often not known, is not appreciated or is ignored. At least some of the observed gender gap in scientific output may be owing not to differences in scientific contribution, but rather to differences in attribution.


Conflict of interest statement

The authors declare no competing interests.

Figures

Fig. 1
Fig. 1. Women are less likely to be named authors on any given document in all fields and at all career stages.
Graphs plot the probability that a potential author on a scientific document (article or patent) is a woman against the probability that an actual author is a woman. A potential author is defined as an employee in a laboratory between 2013 and 2016 from which an article or patent was published between 2014 and 2016. There are 17,929,271 potential article authorships and 3,203,831 potential patent inventorships in our sample. The markers in each panel are sized by the total number of actual authorships in the category. The diagonal represents parity in the gender composition of potential and actual authorships. Individual data on potential and actual authorships are shown in Supplementary Fig.  5. Left, disparity across job titles. Right, disparity across research fields. Observations are weighted by the inverse of the number of teams per employee times the inverse of the number of potential articles or patents per employee.
Fig. 2
Fig. 2. Women are still less likely to be named even when controls are included.
Graphs show the probability that an individual in a team is an author on a given article (left) or patent (right) published by that team. Left, the likelihood of attribution on an article is estimated from 17,929,271 potential authorship observations. Right, the likelihood of attribution on a patent is estimated from 3,203,831 inventorship observations. The data associated with each bar are generated by predicting the dependent variable from ordinary least squares regressions of the likelihood of being named on gender and the indicated controls (reported in Extended Data Table 4). For the purpose of plotting probabilities and gender differences holding all else fixed (Δ), we hold all of the controls at their respective means. Because men have higher values than women on average on the controlled factors that increase the probability of attribution, the predicted probabilities for men decline and those for women increase as more controls are included. Controls, from left to right: (1) none; (2) whether a potential author is the PI of the team, the number of days worked on the team and publication date (calendar year × month); (3) job title of the potential author/inventor; (4) research field of the team; (5) individual indicator variables for each team (these team indicators subsume the fields indicator). The observations are weighted by the inverse of the number of teams per employee times the inverse of the number of potential articles or patents per employee.  Individual data on the probability of women or men being named on articles or patents are visualized in Supplementary Fig.  6. Error bars are centred on the mean and extend to the 95% confidence interval based on 1.96 × s.e. Standard errors are clustered by team and employee.
Fig. 3
Fig. 3. Women are much less likely to be named on high-impact articles.
The probability that an individual in a team is an author on an article (left) or inventor on a patent (right) in relation to the number of citations that the document receives. Estimates were obtained from an ordinary least squares regression of the probability of being named with an indicator for gender against the log of total forward citations plus one (Extended Data Table 7). Left, the regression is estimated based on 17,929,271 potential article authorships. Right, the regression is estimated based on 3,203,831 potential patent inventorships. The observations are weighted by the inverse of the number of teams per employee times the inverse of the number of potential articles or patents per employee. Estimates include controls for publication date (calendar year × month), PI status, number of days worked on the team, job title and research team fixed effects. Each data point represents the estimated difference in the probability of a woman being named an author (left) or inventor (right) at each citation level. Error bars extend from the point estimate of the estimated marginal effect by ±1.96 × the standard error and show the 95% confidence interval of the marginal effect. Standard errors are clustered by team and employee.
Fig. 4
Fig. 4. Women are more likely to report that their contributions were underestimated or that there was discrimination.
A survey was sent to 28,000 scientists who had published in an academic journal listed in the Web of Science and who listed themselves with a public profile on the ORCID database. The bar chart shows the percentage of 871 men and women who provided answers to the survey question (Q2b): ‘What is the most likely reason that you were not listed as an author on that paper?’. Respondents were able to select more than one option, thus the total number of responses is higher than the number of respondents. The probability is computed as the arithmetic mean of the binary responses. Individual data on the reason an individual is not named are visualized in Supplementary Fig. 7. Error bars are centred on that mean and extend to the 95% confidence interval based on 1.96 × s.e.m. The difference in the probability of selecting ‘Contribution did not justify authorship’ between men and women is 0.1294 (P = 0.0000; two-sided t-test; test value = 4.1060). The difference in the probability of selecting ‘Others underestimated my contributions’ between men and women is −0.0984 (P = 0.0036; two-sided t-test; test value = −2.9218). The difference in the probability of selecting ‘Discrimination/stereotyping/bias’ between men and women is −0.0780 (P = 0.0003; two-sided t-test; test value = −3.6623). Additional t-tests of the differences in the probability of indicating a reason across men and women can be found in the text.
Fig. 5
Fig. 5. Women report making more contributions than men on authored papers.
We sent a survey to 28,000 scientists who had published in academic journals listed in the Web of Science and who had a public profile in the ORCID database. Of these, 2,297 responded and completed the question (Q1a): ‘How did you contribute to the paper? Check all that apply.’ The graph shows the percentage of these respondents who selected each category. Probability was computed as the arithmetic mean of binary indicators representing whether the respondent selected each category. Each respondent was asked about a paper associated with them on Web of Science. Respondents were able to select more than one option, thus the total number of responses is therefore higher than the number of respondents. Individual data on the contribution by gender are visualized in Supplementary Fig.  8. Error bars are centred on the mean and extend to the 95% confidence interval based on 1.96 × s.e.m.

Comment in

References

    1. Huang J, et al. Historical comparison of gender inequality in scientific careers across countries and disciplines. Proc. Natl Acad. Sci. USA. 2020;117:4609–4616. doi: 10.1073/pnas.1914221117. - DOI - PMC - PubMed
    1. Tomaskovic-Devey D. Women’s work: gender equality vs. hierarchy in the life sciences. Adm. Sci. Q. 2005;50:661–662. doi: 10.2189/asqu.50.4.661. - DOI
    1. Whittington KB, Smith-Doerr L. Gender and commercial science: women’s patenting in the life sciences. J. Technol. Transf. 2005;30:355–370. doi: 10.1007/s10961-005-2581-5. - DOI
    1. Bostick VK, Weinberg BA. Nevertheless she persisted? Gender peer effects in doctoral STEM programs. J. Lab. Econ. 2022;40:397–436. doi: 10.1086/714921. - DOI - PMC - PubMed
    1. Mairesse J, Pezzoni M. Does gender affect scientific productivity? Rev. Écon. 2015;66:65–113. doi: 10.3917/reco.661.0065. - DOI

Publication types