. 2022 Aug;608(7921):181-191.
doi: 10.1038/s41586-022-04989-3. Epub 2022 Jun 22.

Integrated multi-omic characterization of congenital heart disease

Affiliations

Integrated multi-omic characterization of congenital heart disease

Matthew C Hill et al. Nature. 2022 Aug.

Abstract

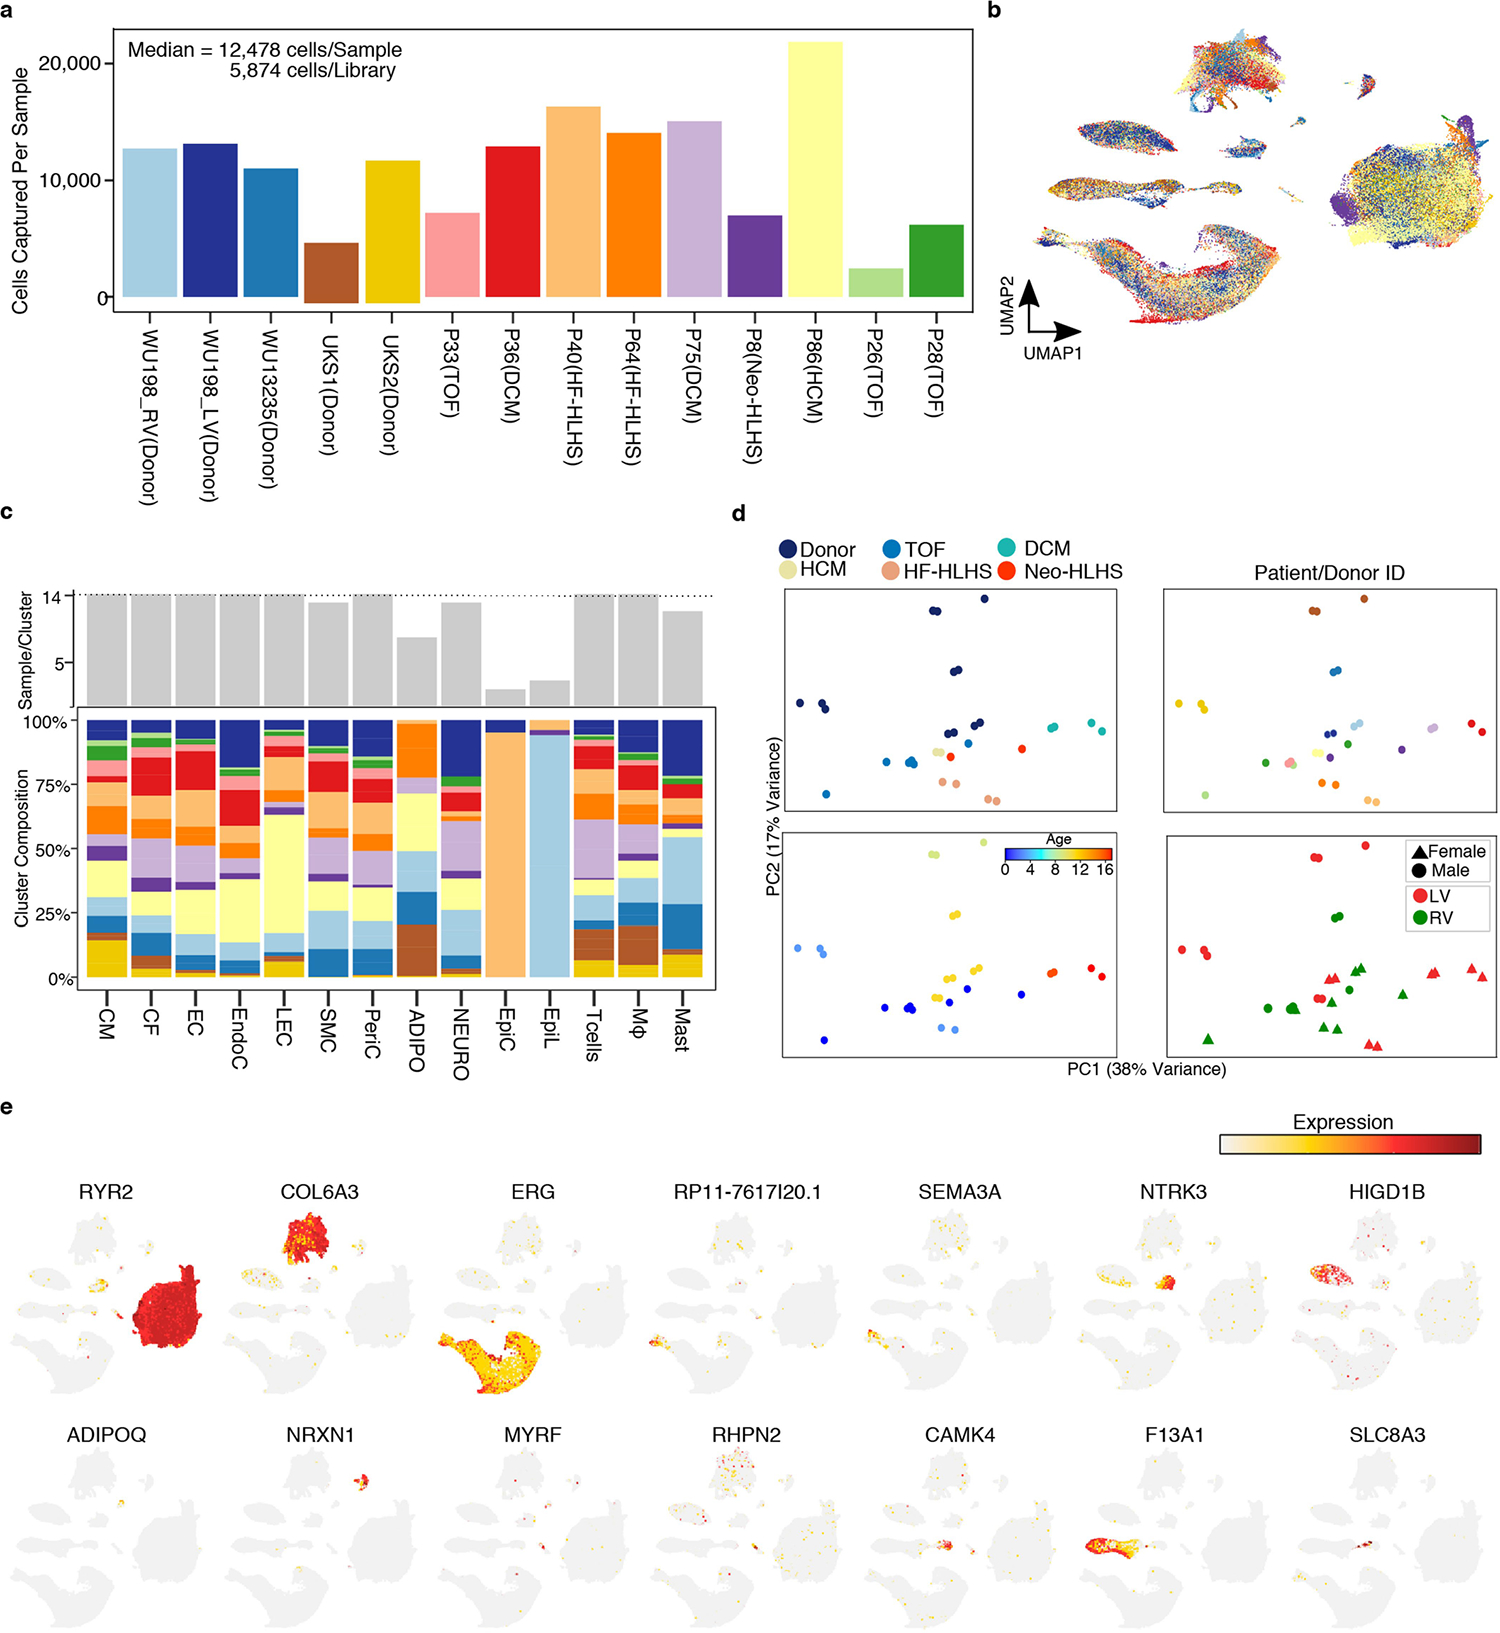
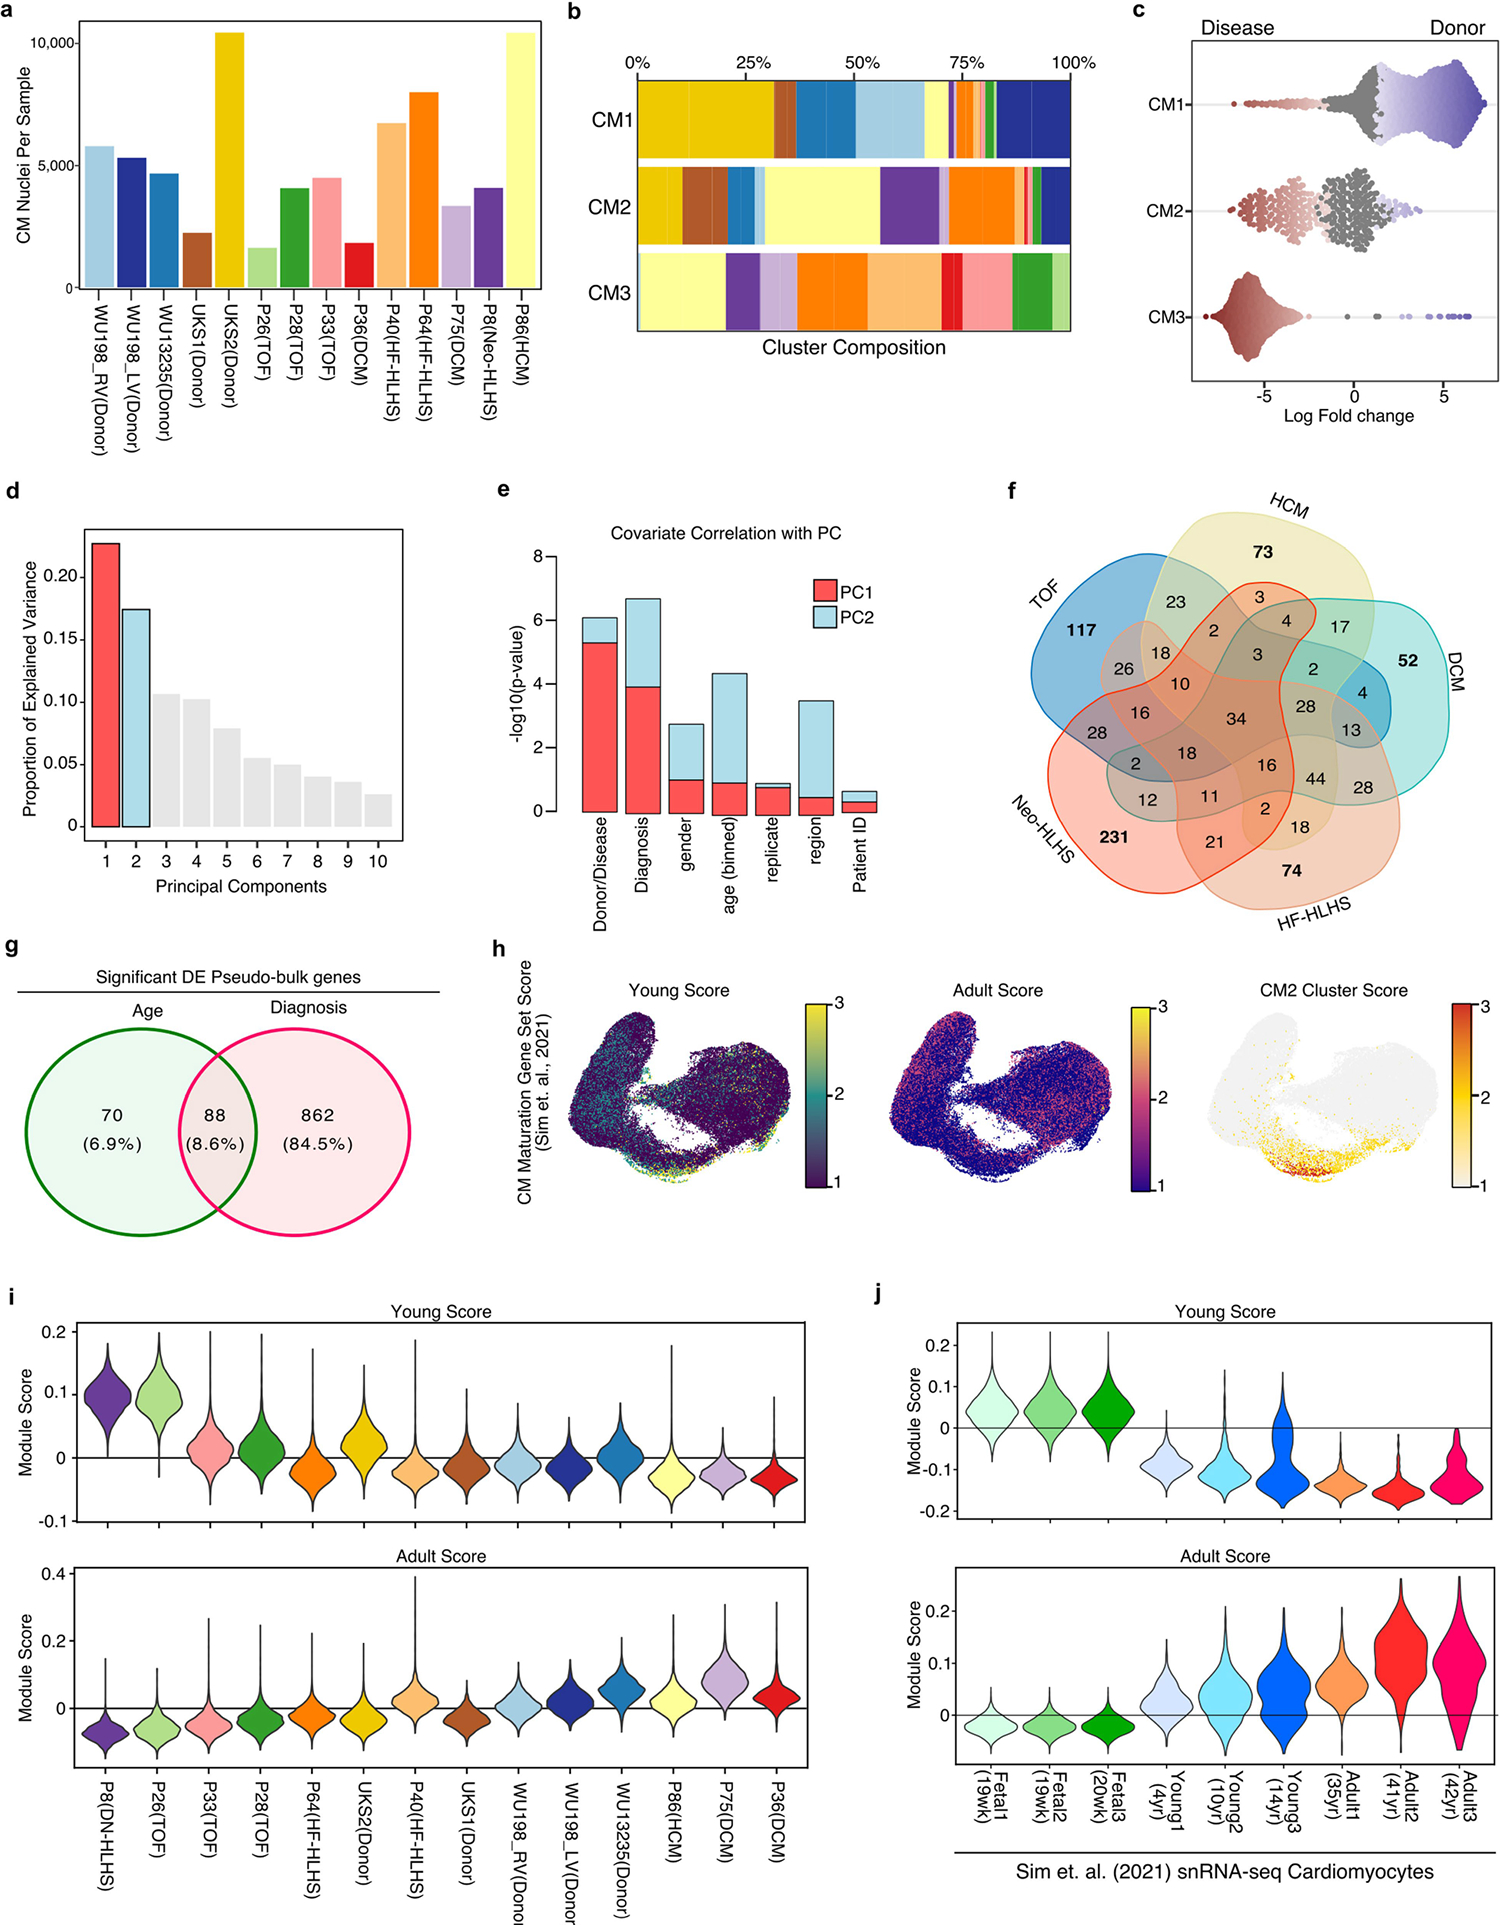
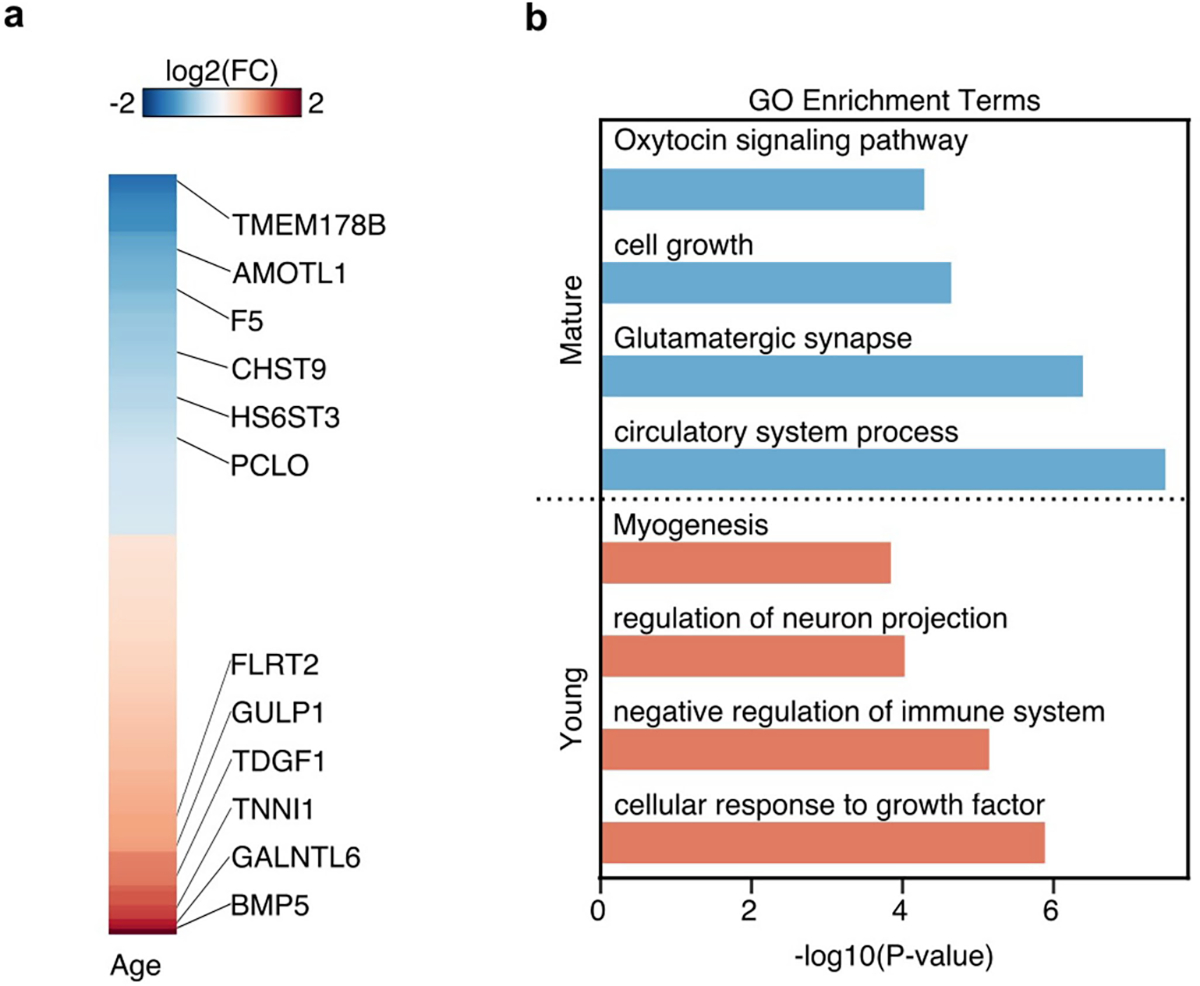
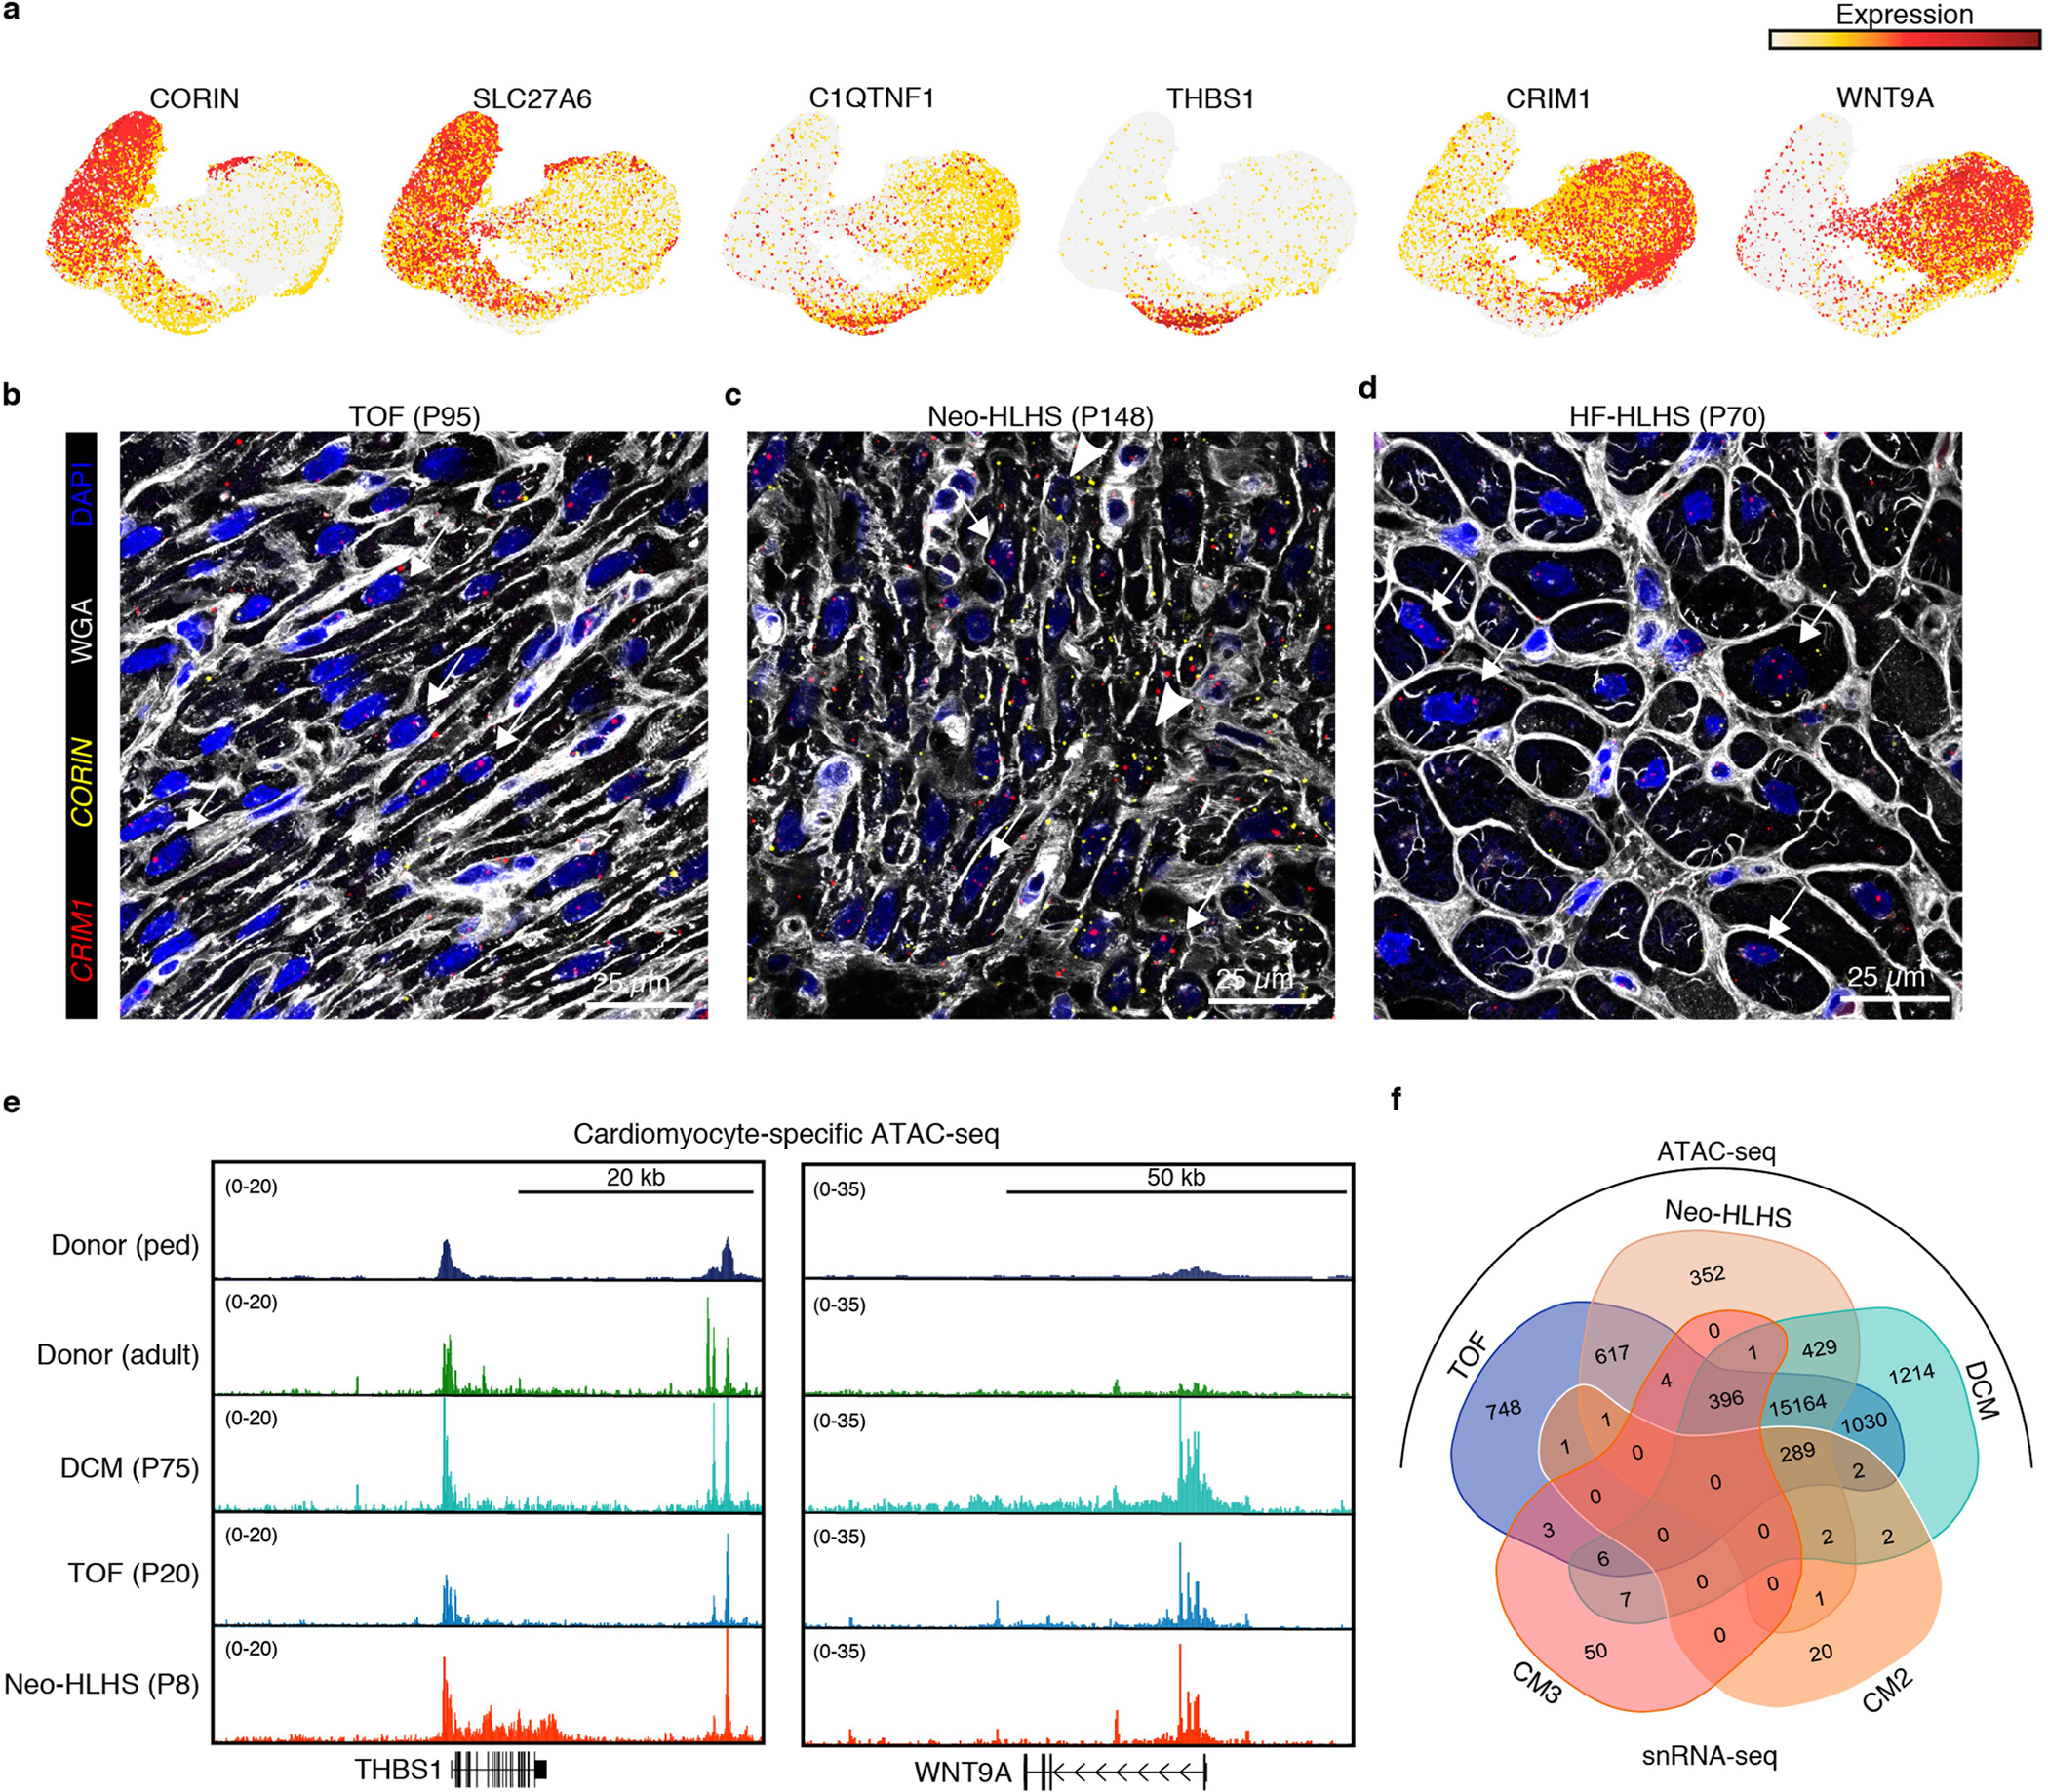
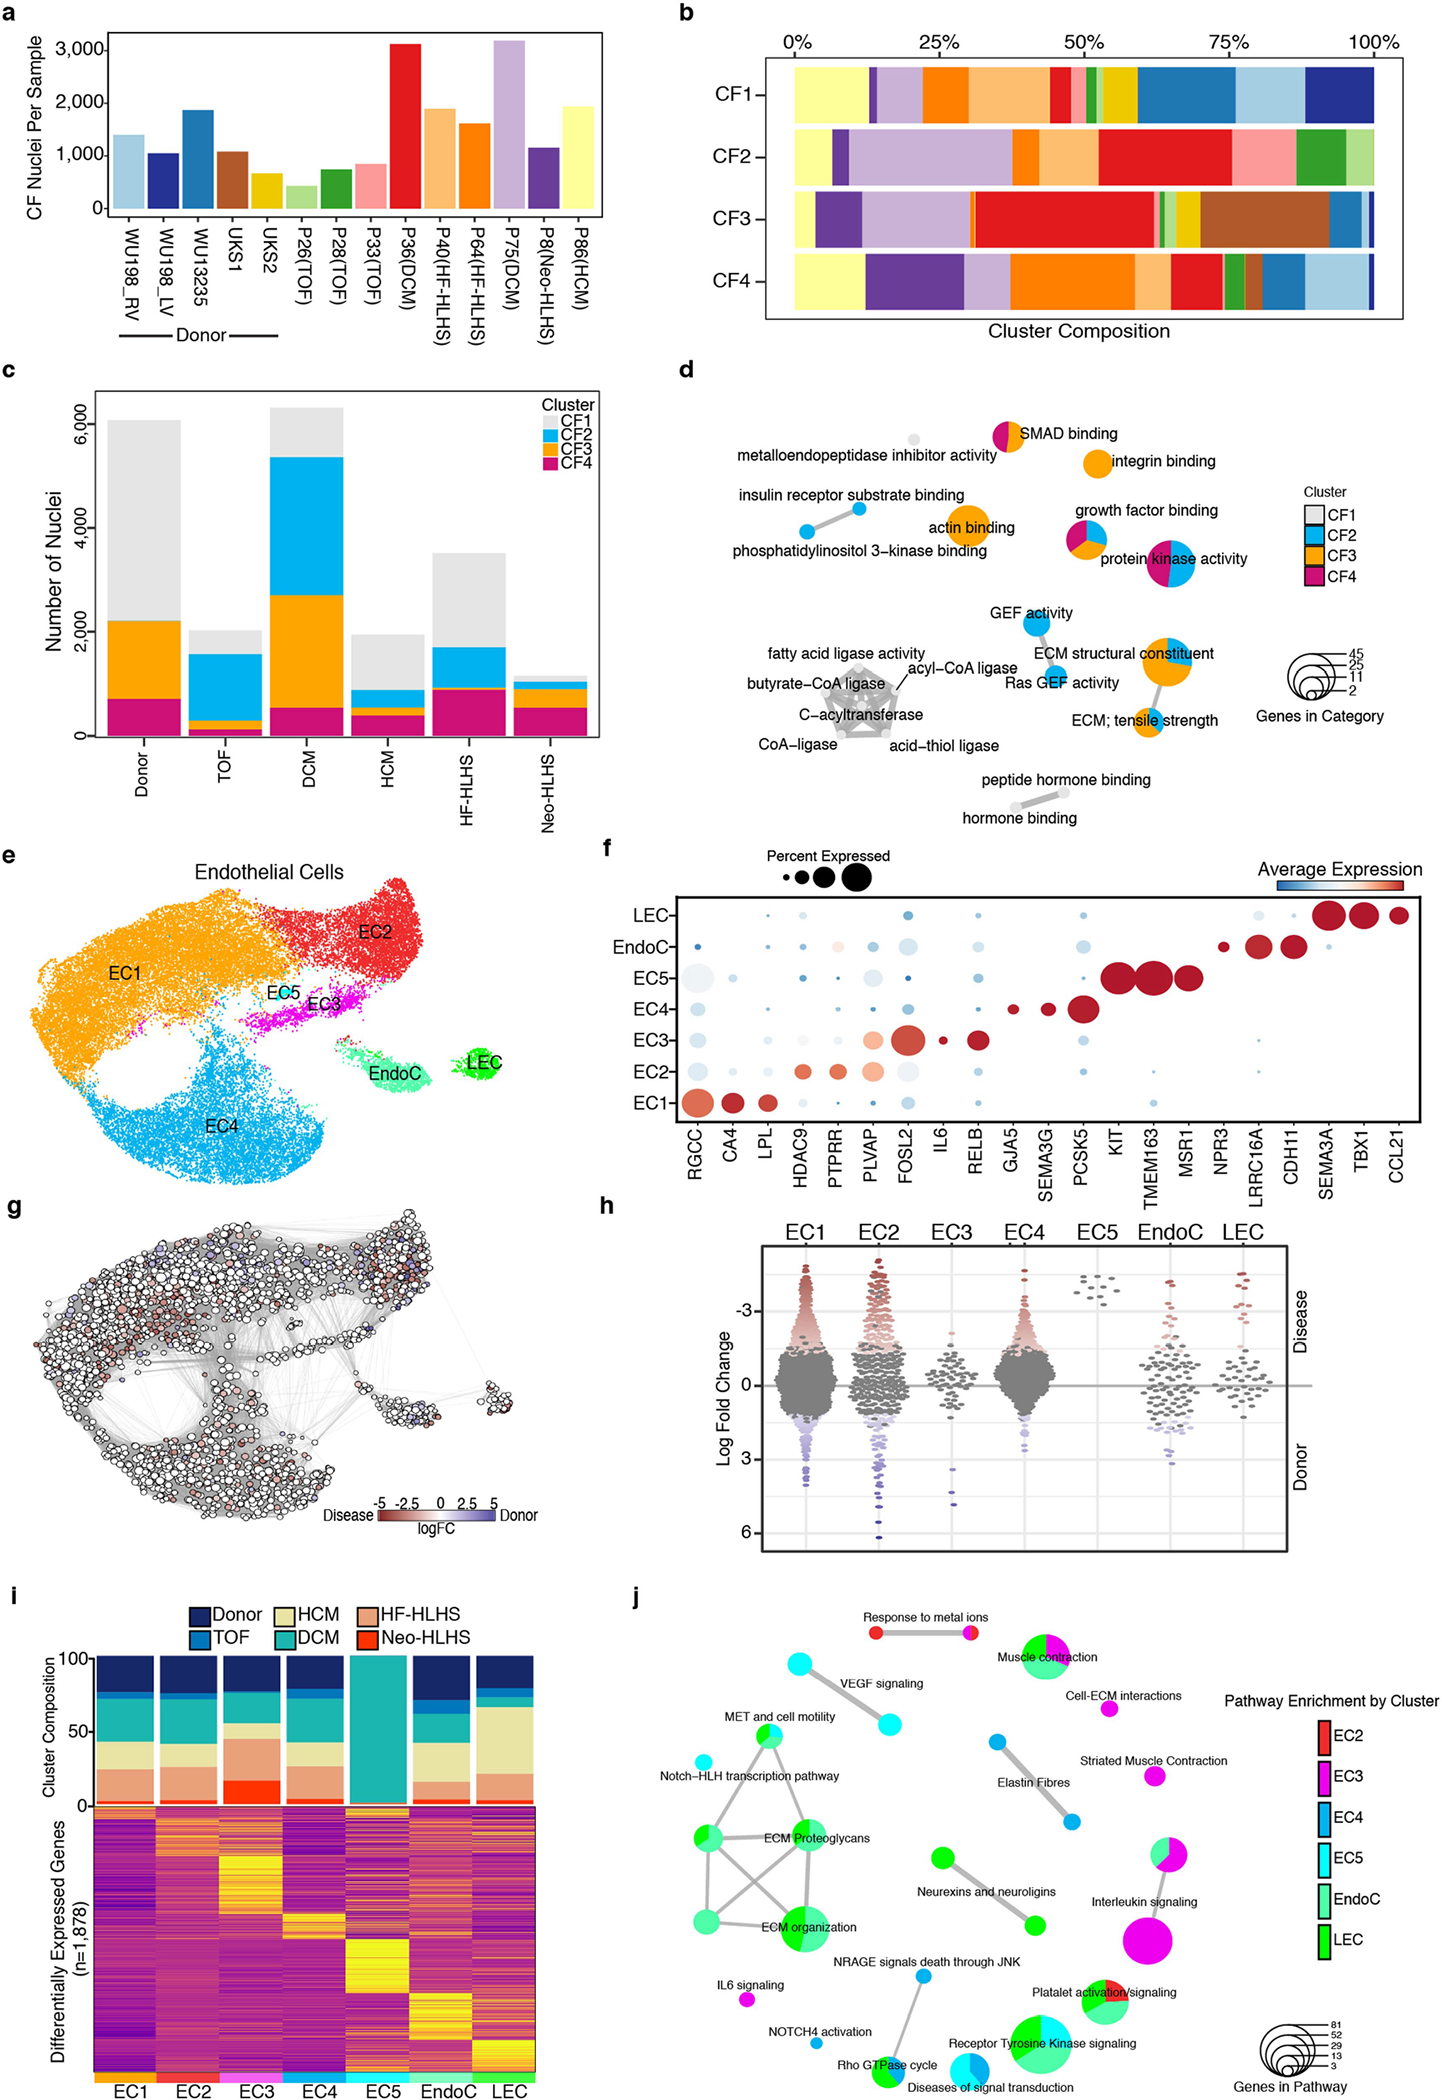
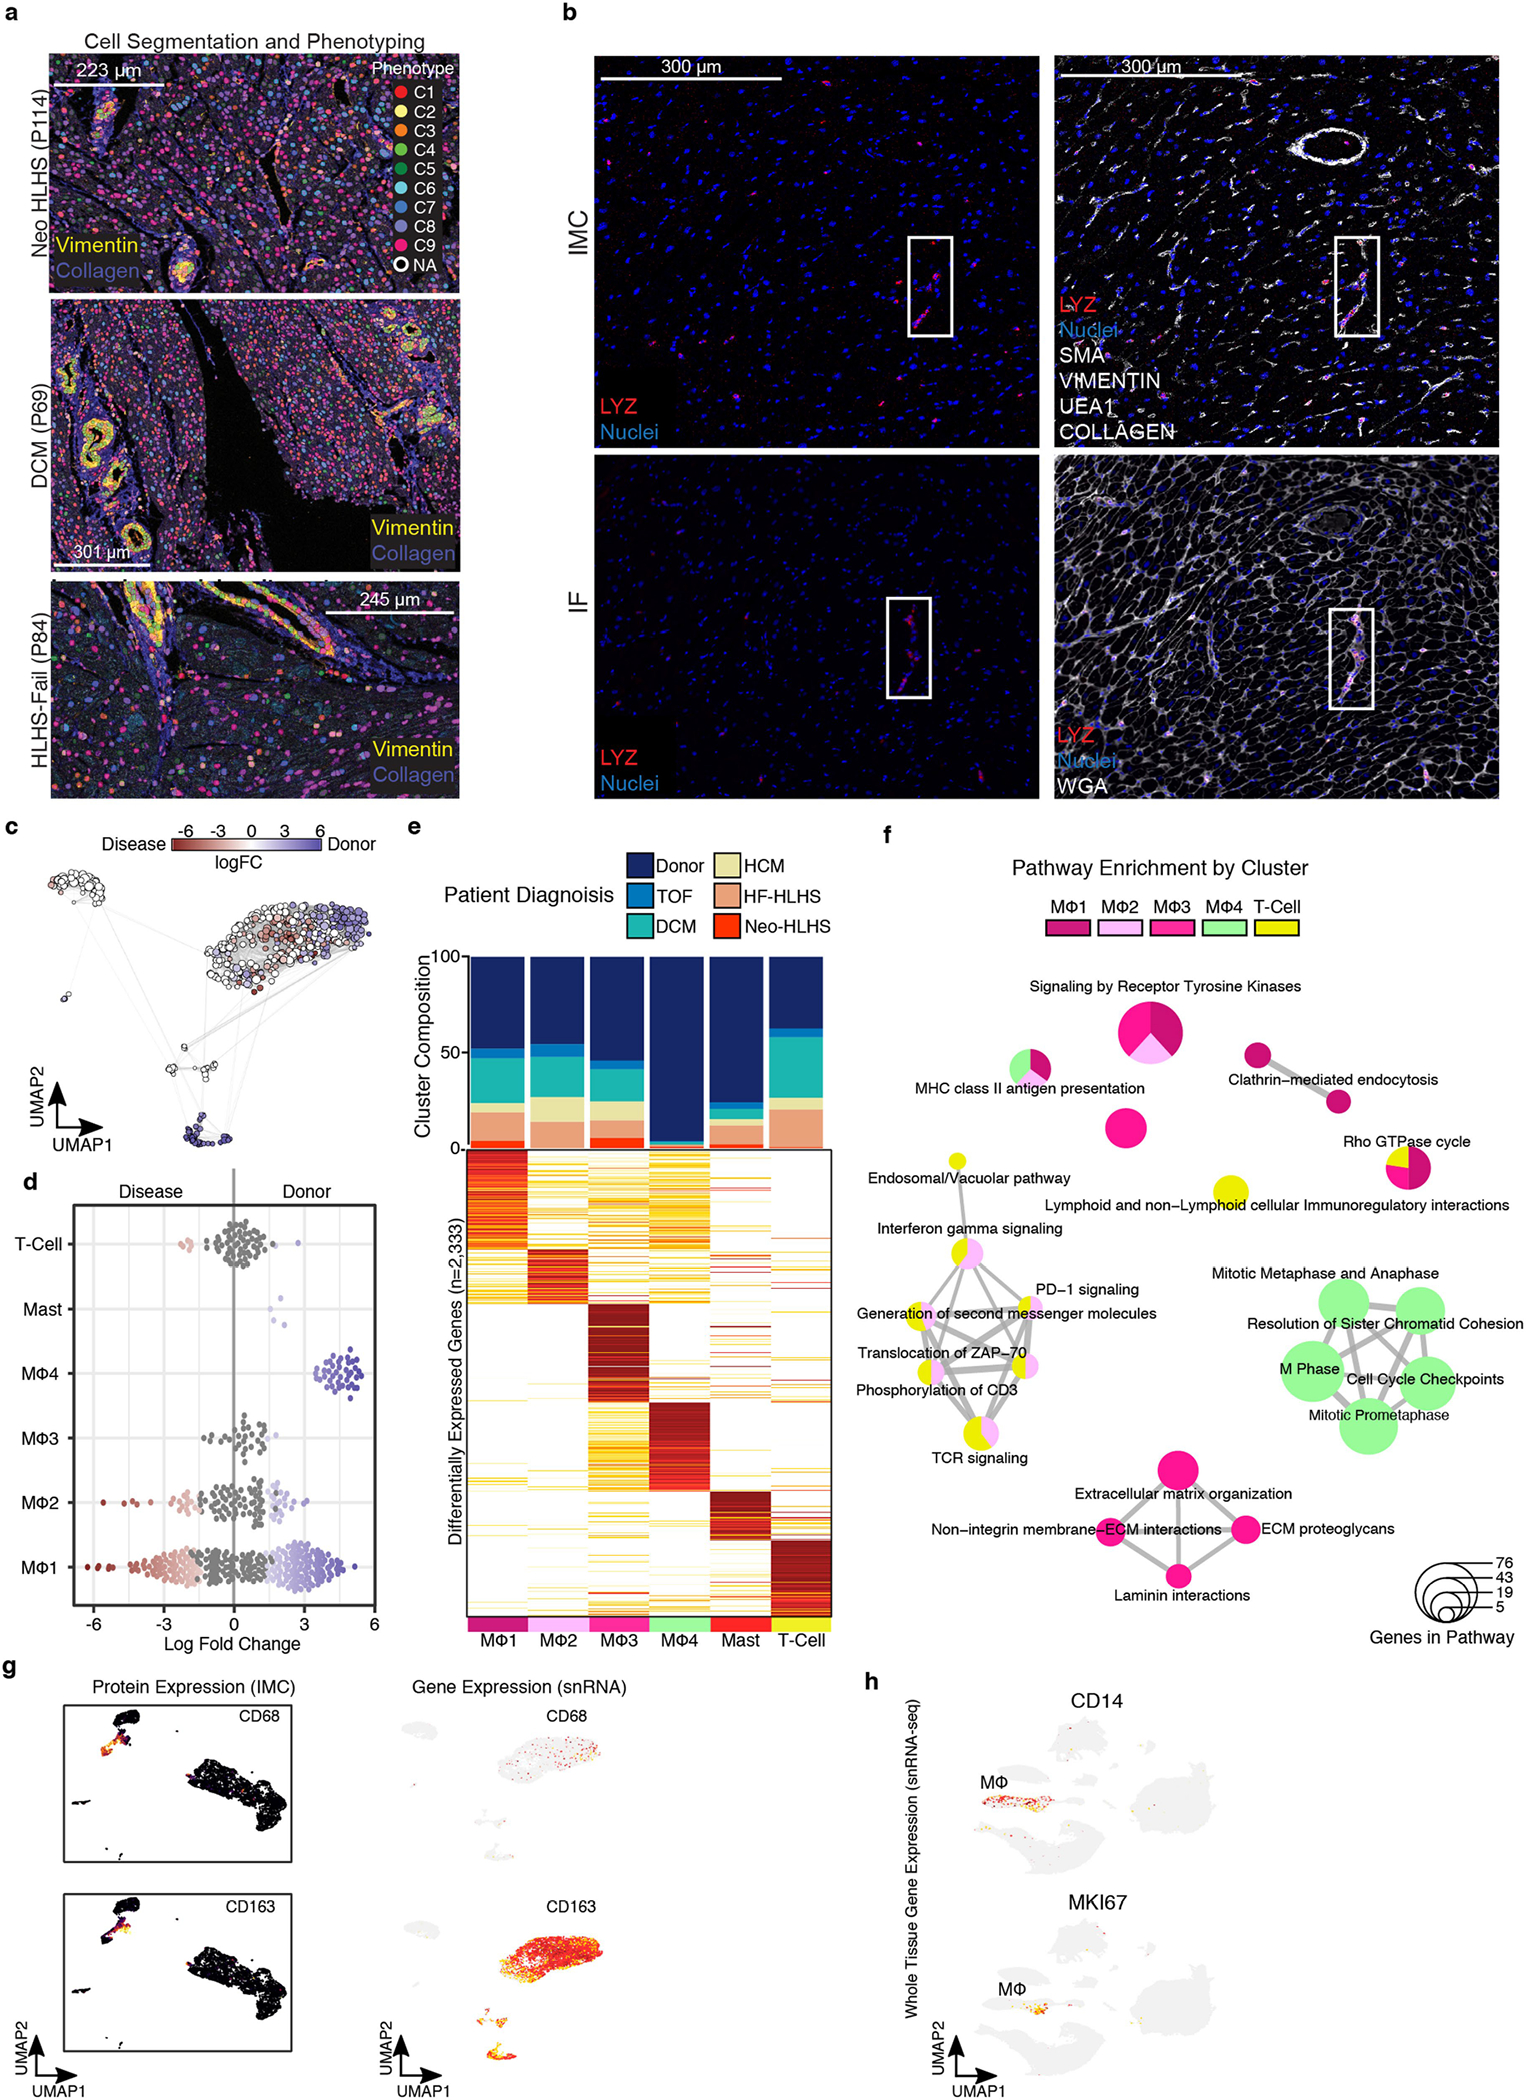
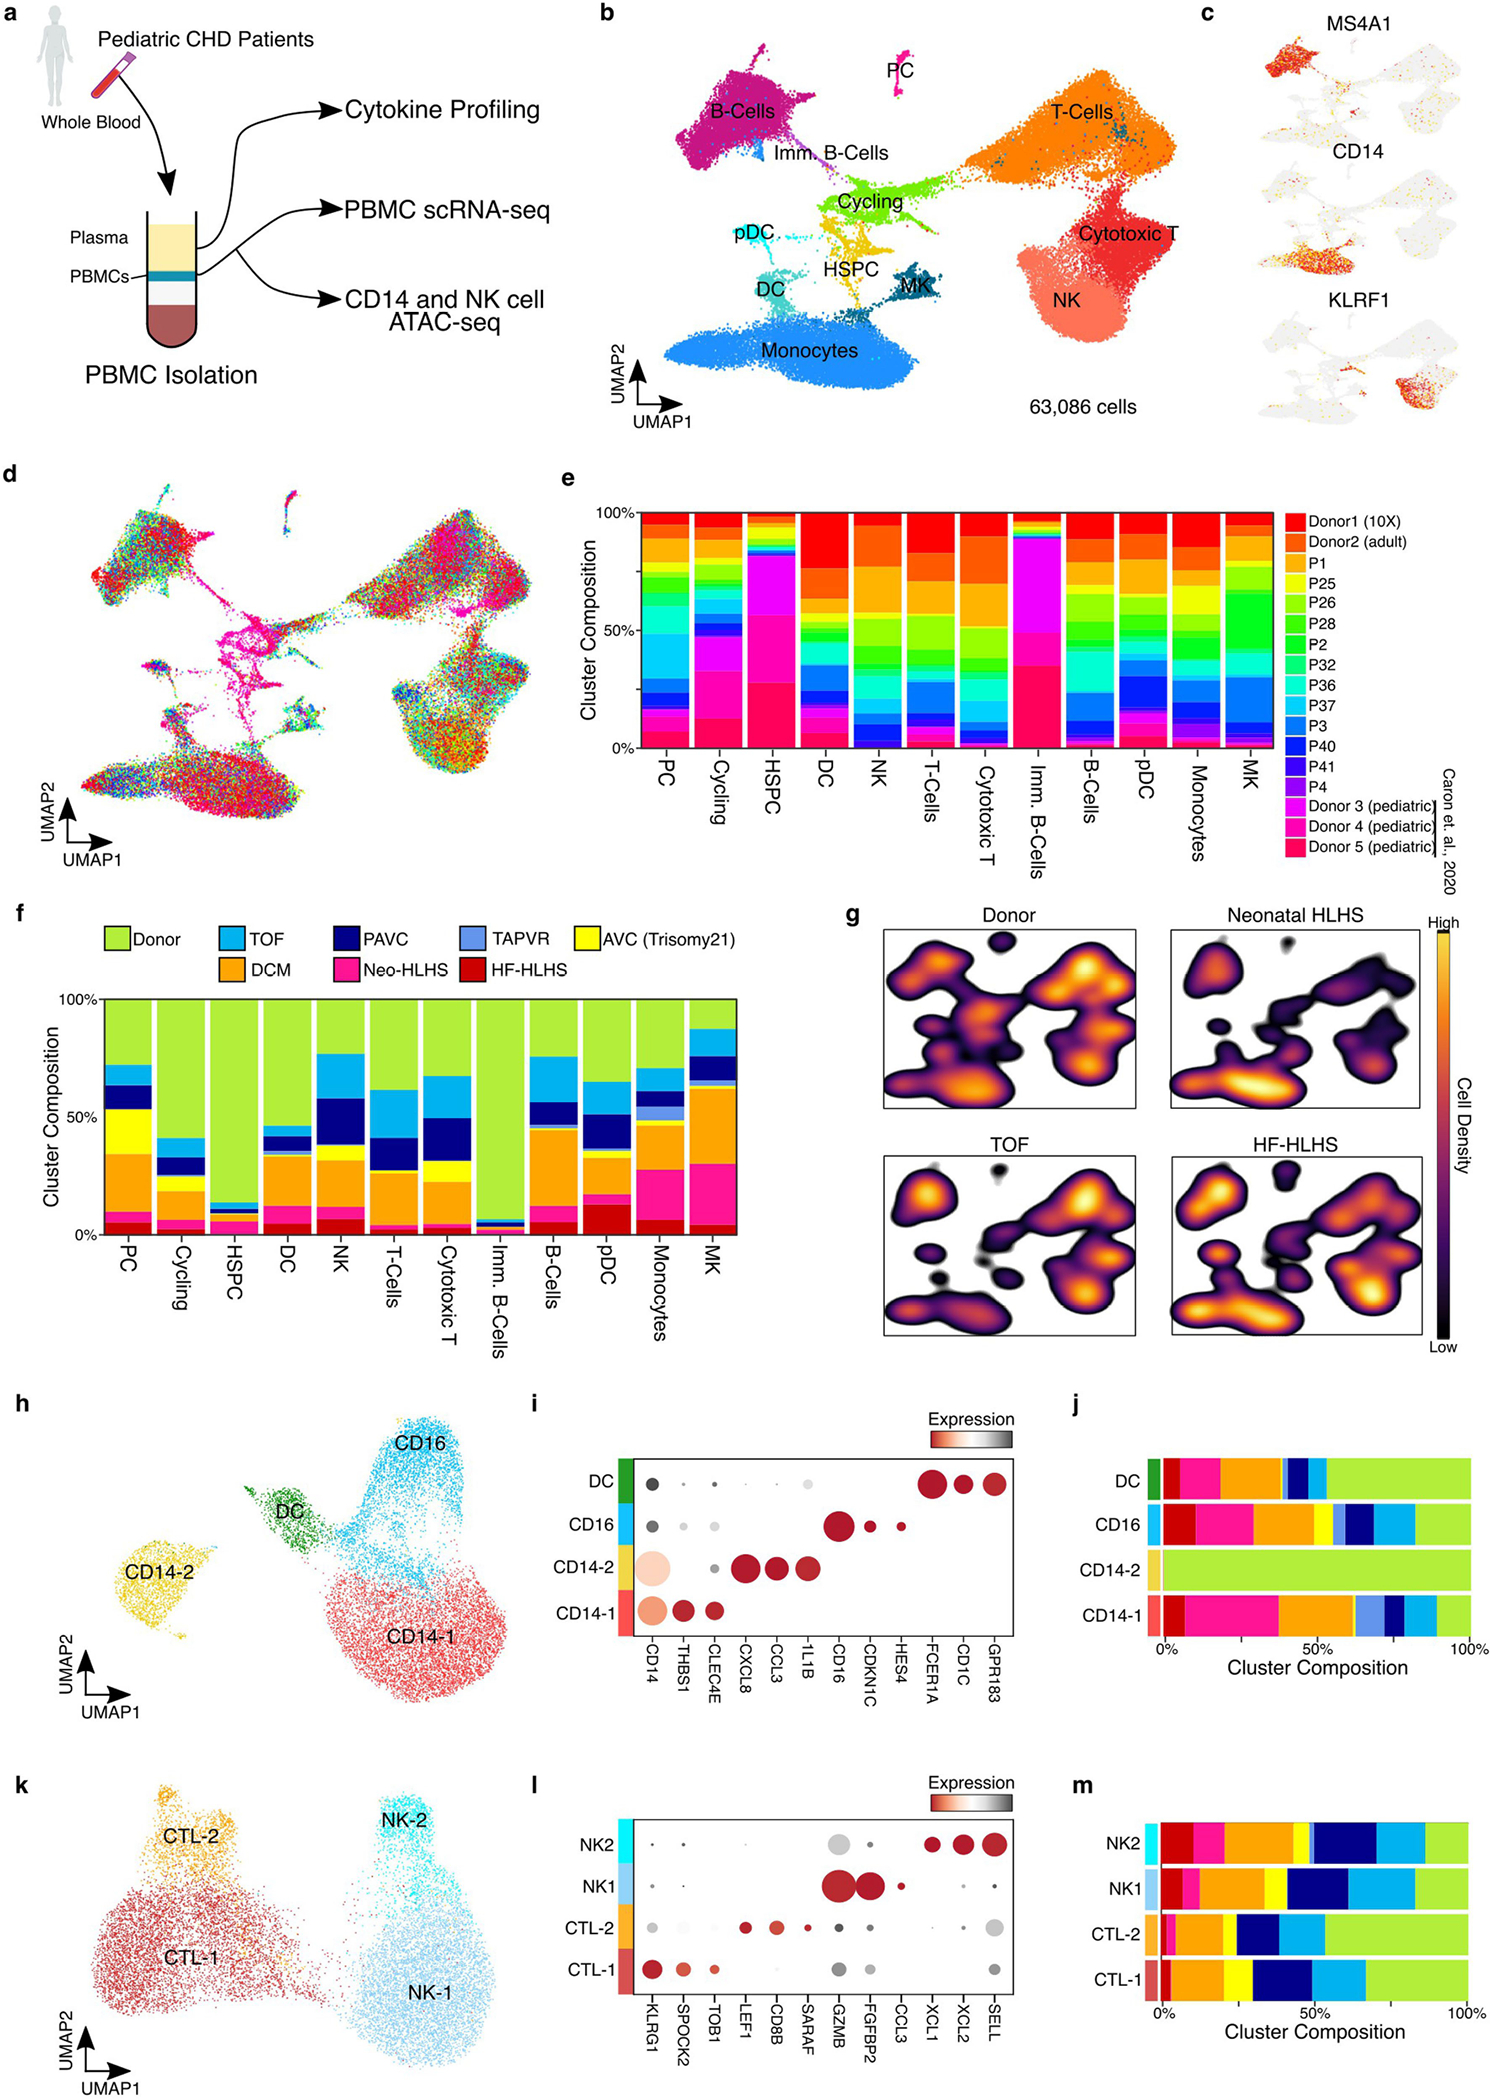
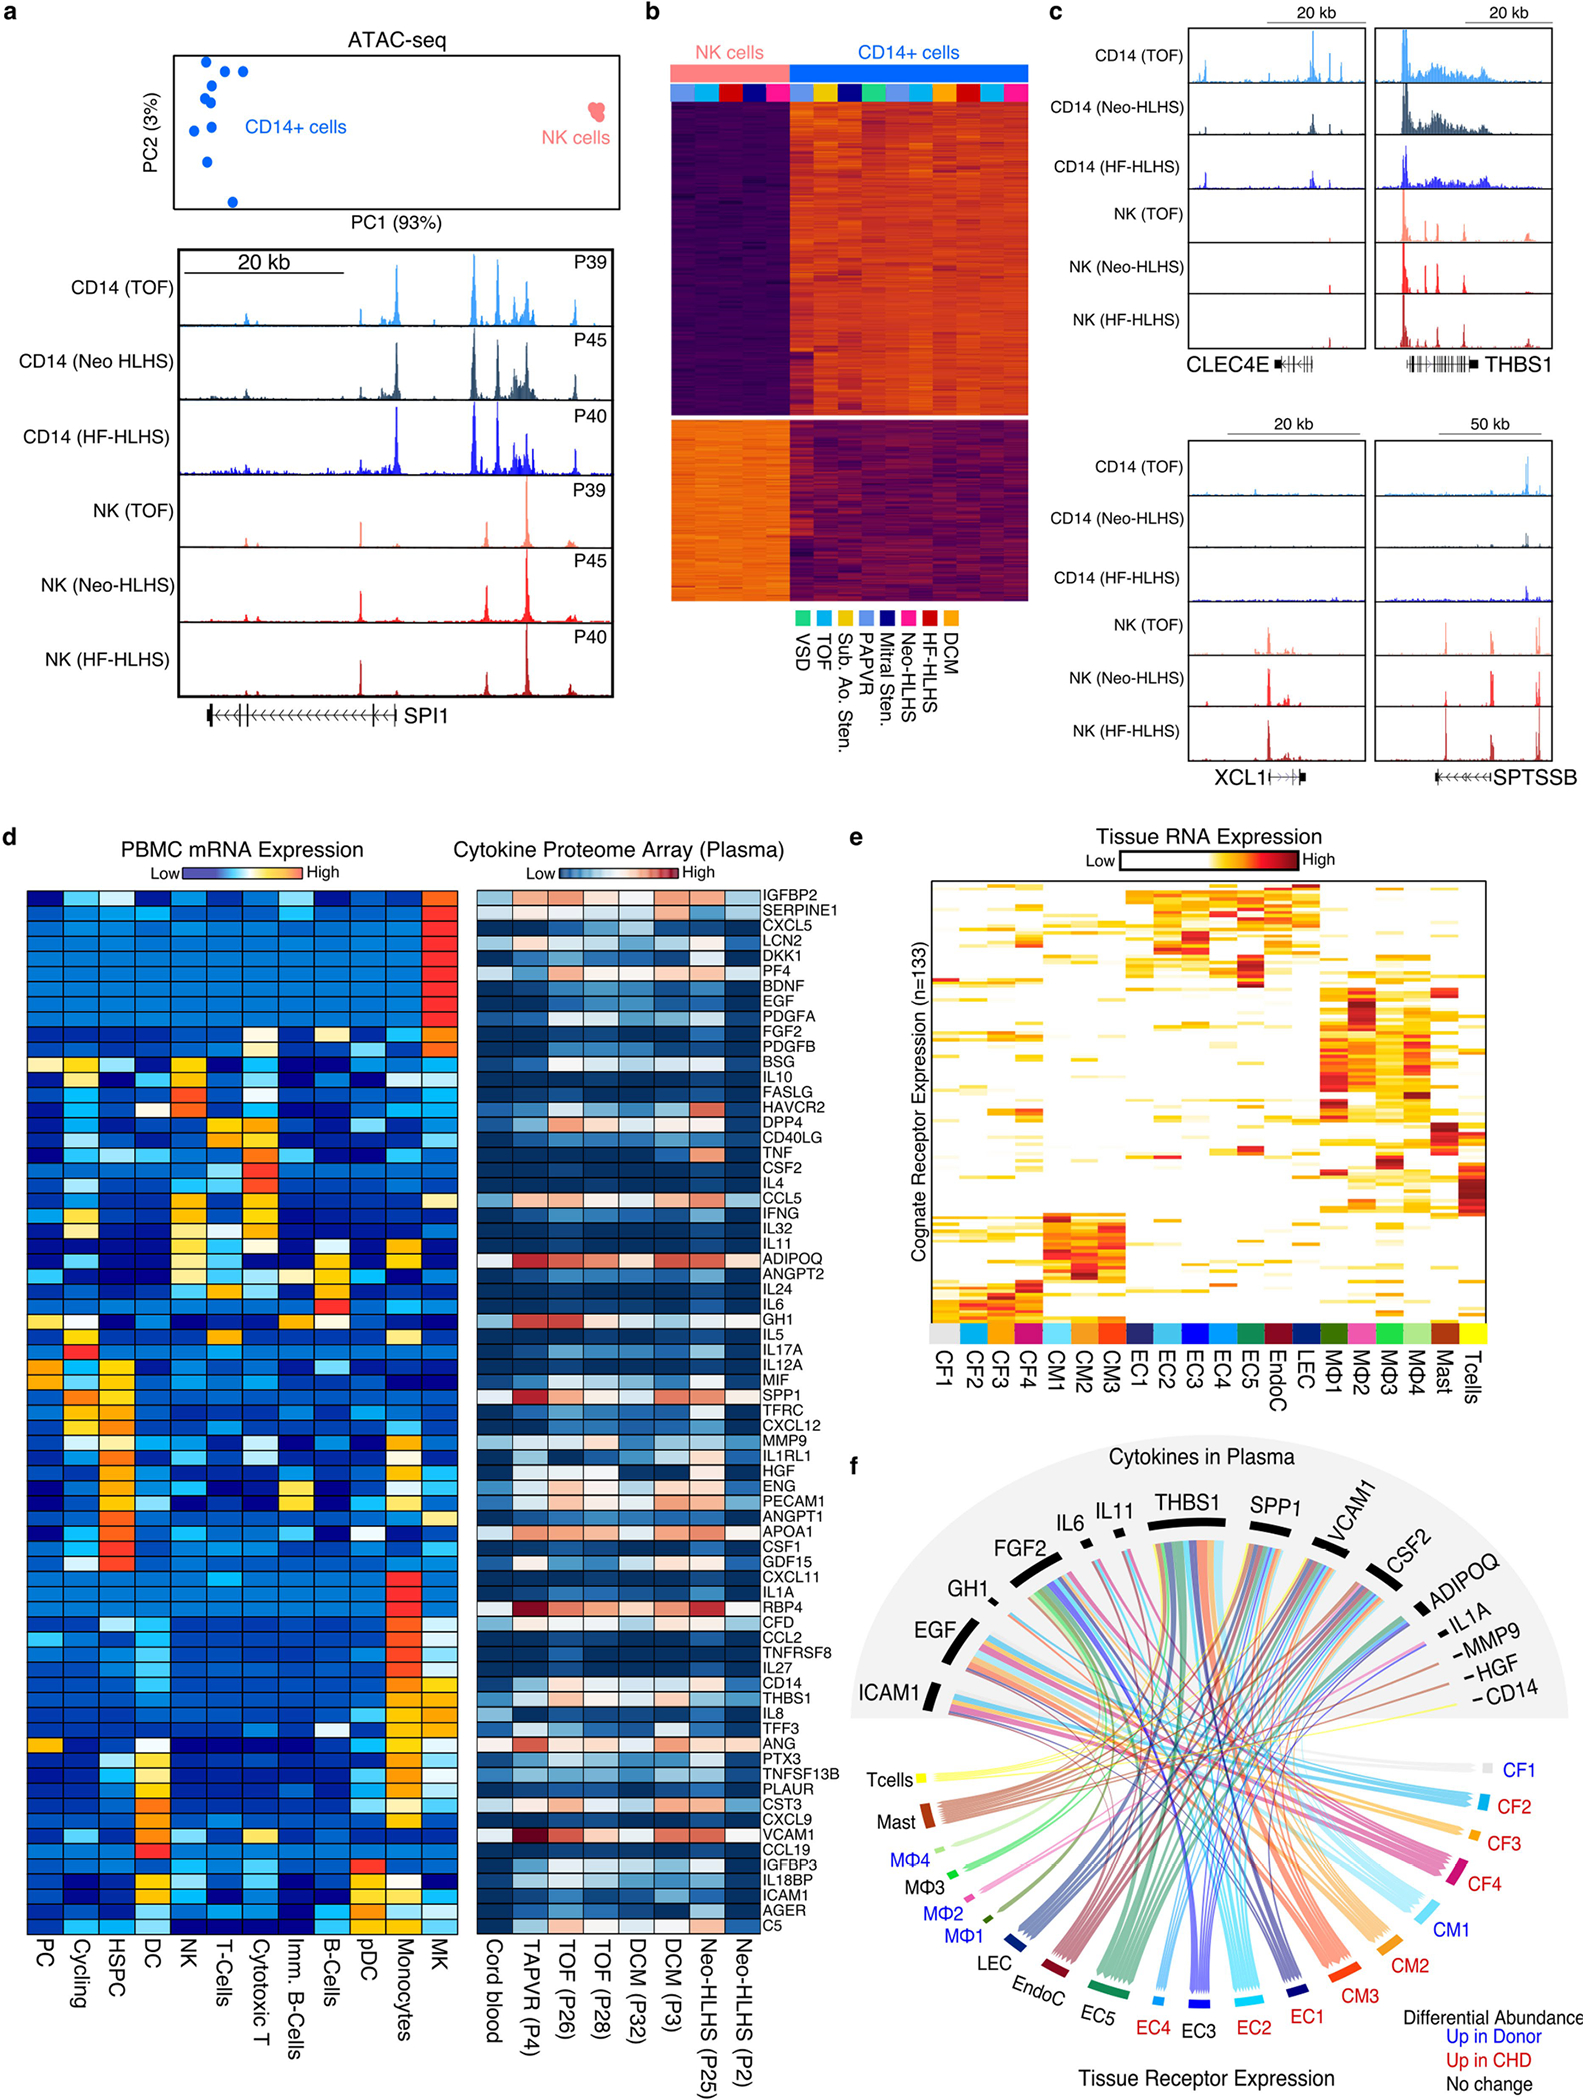
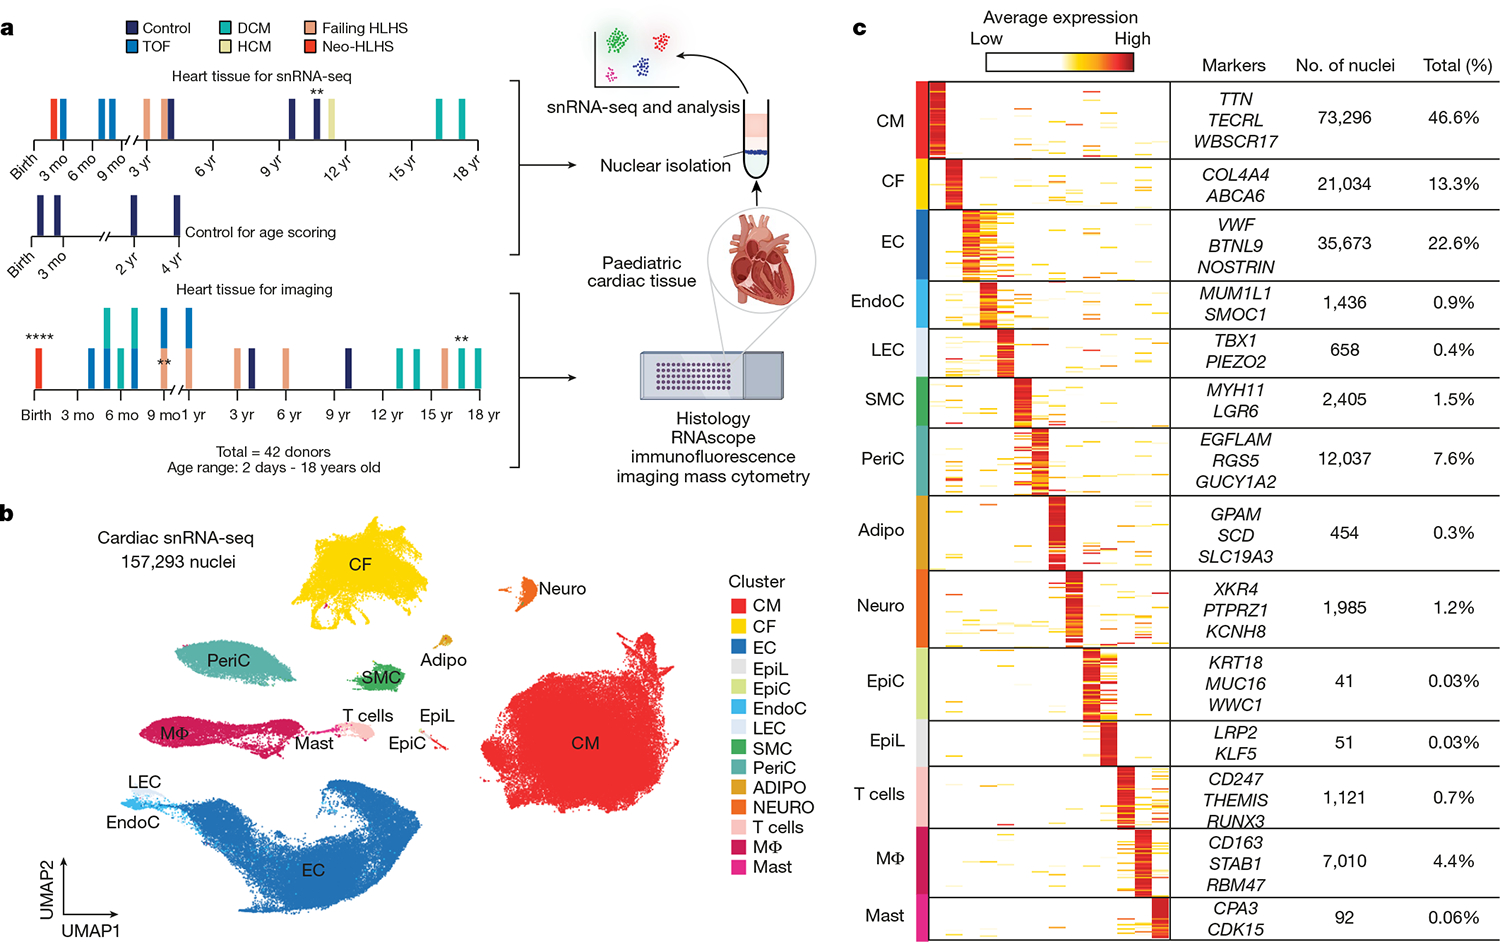
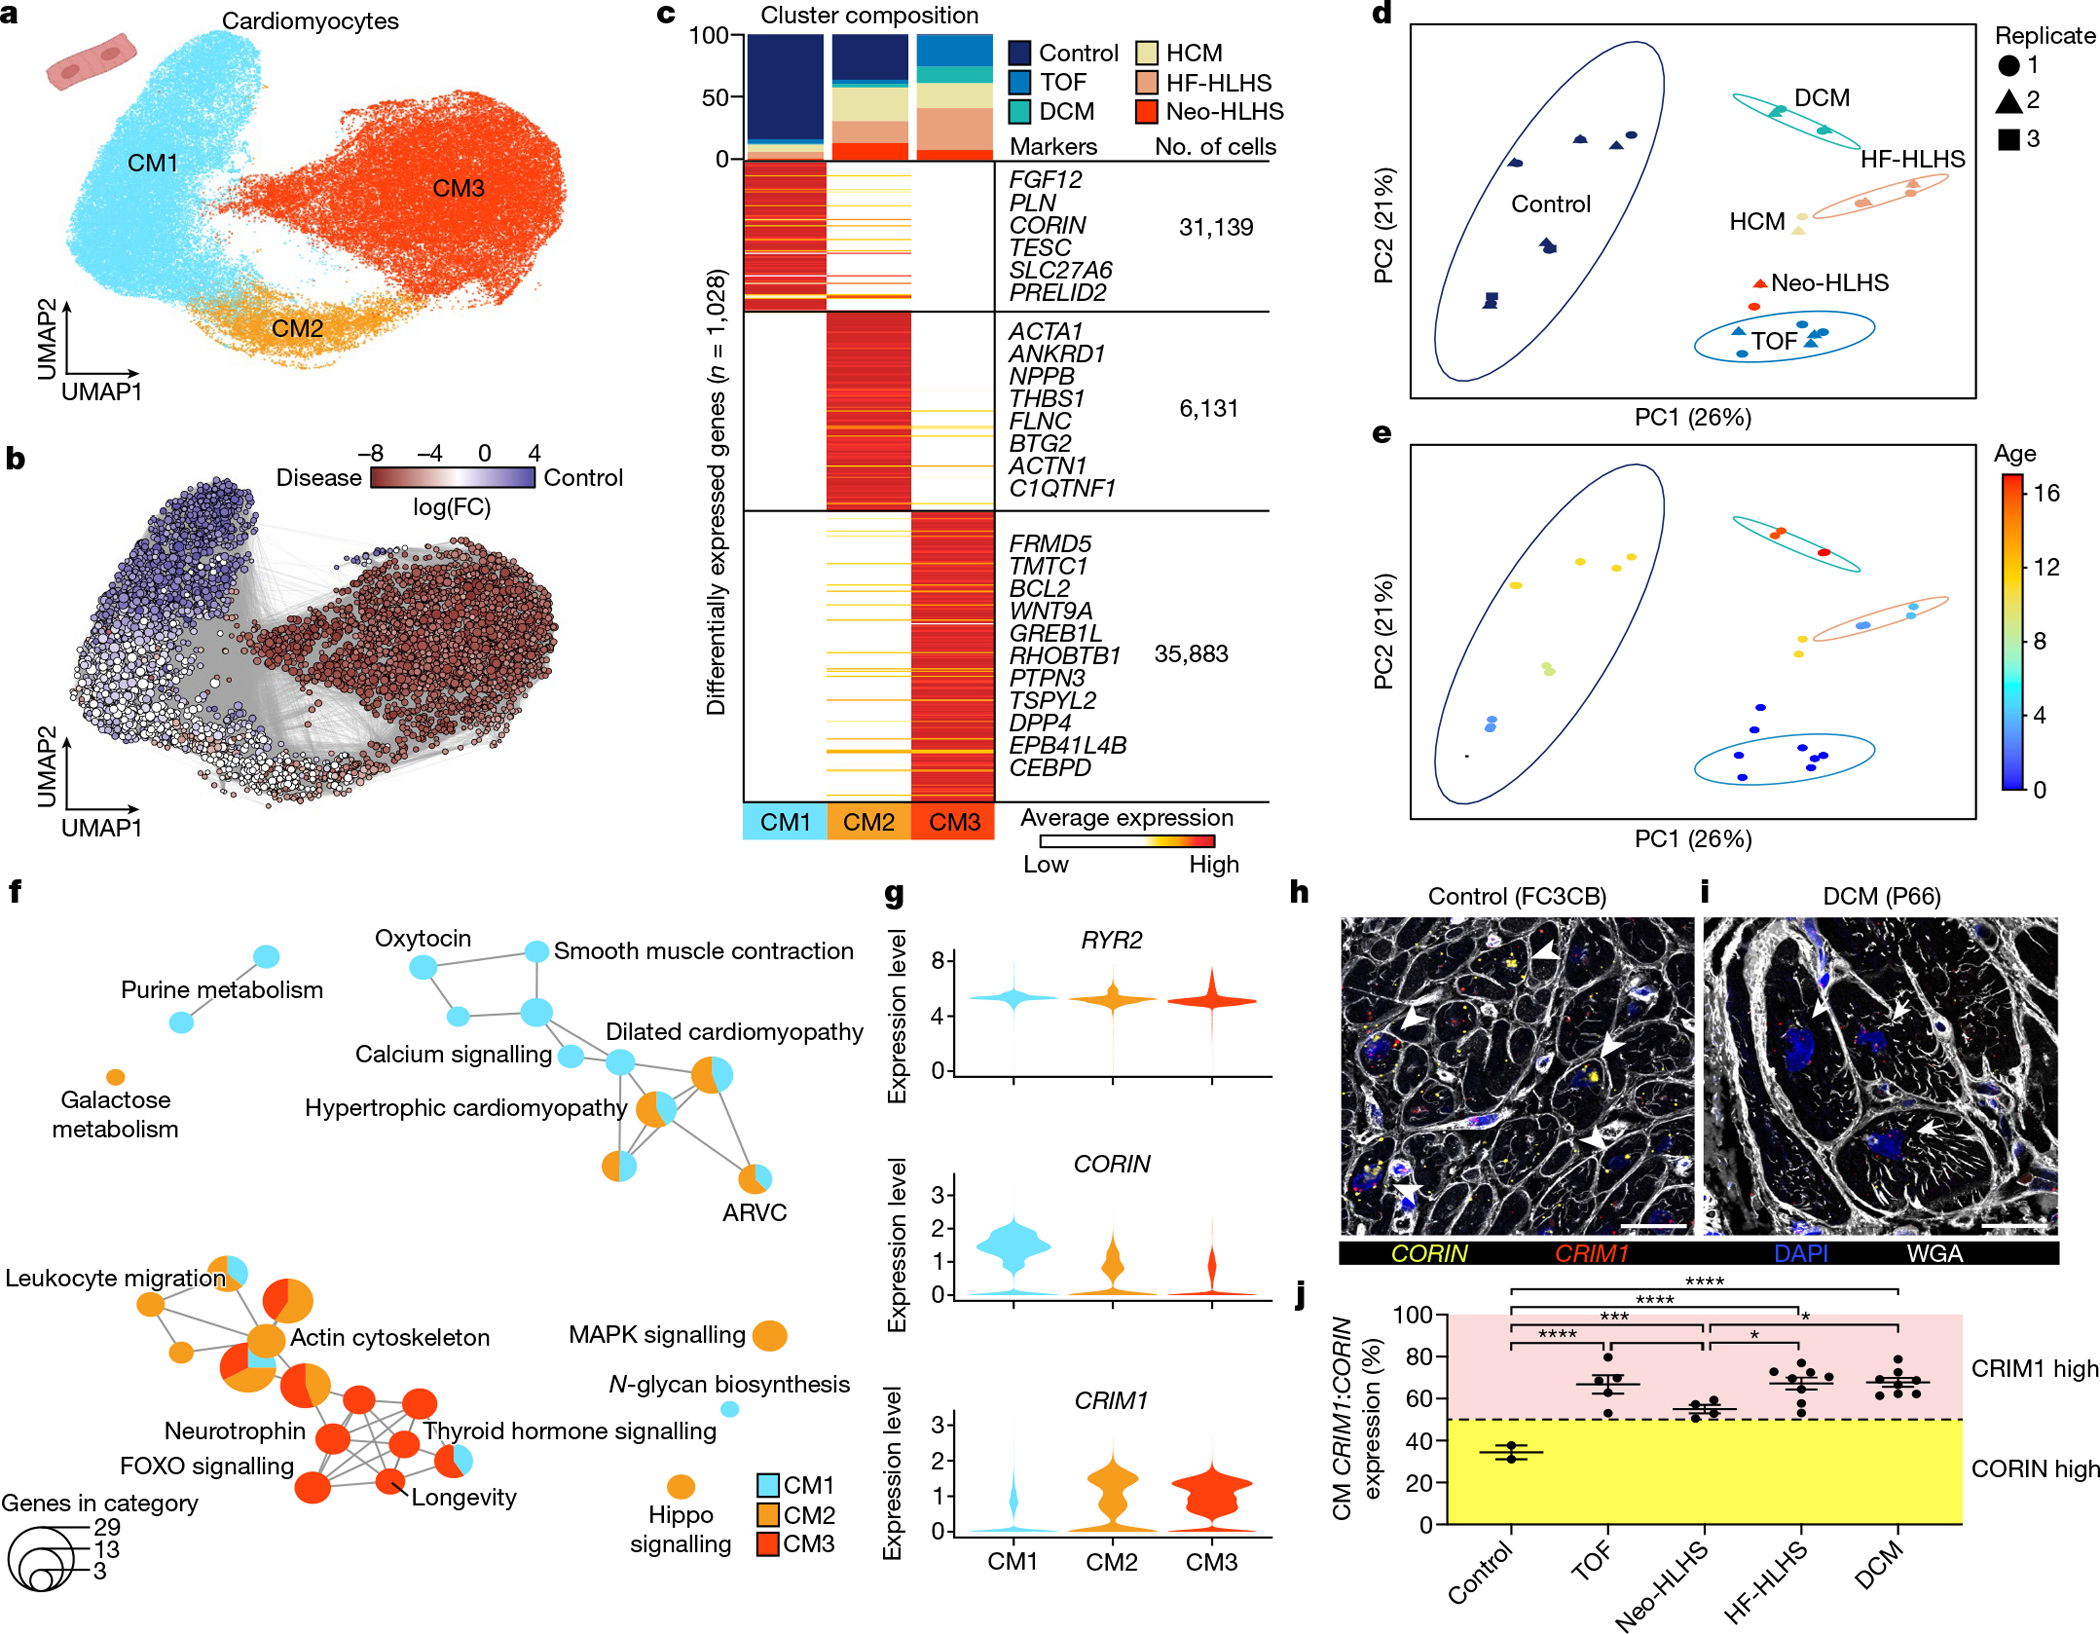
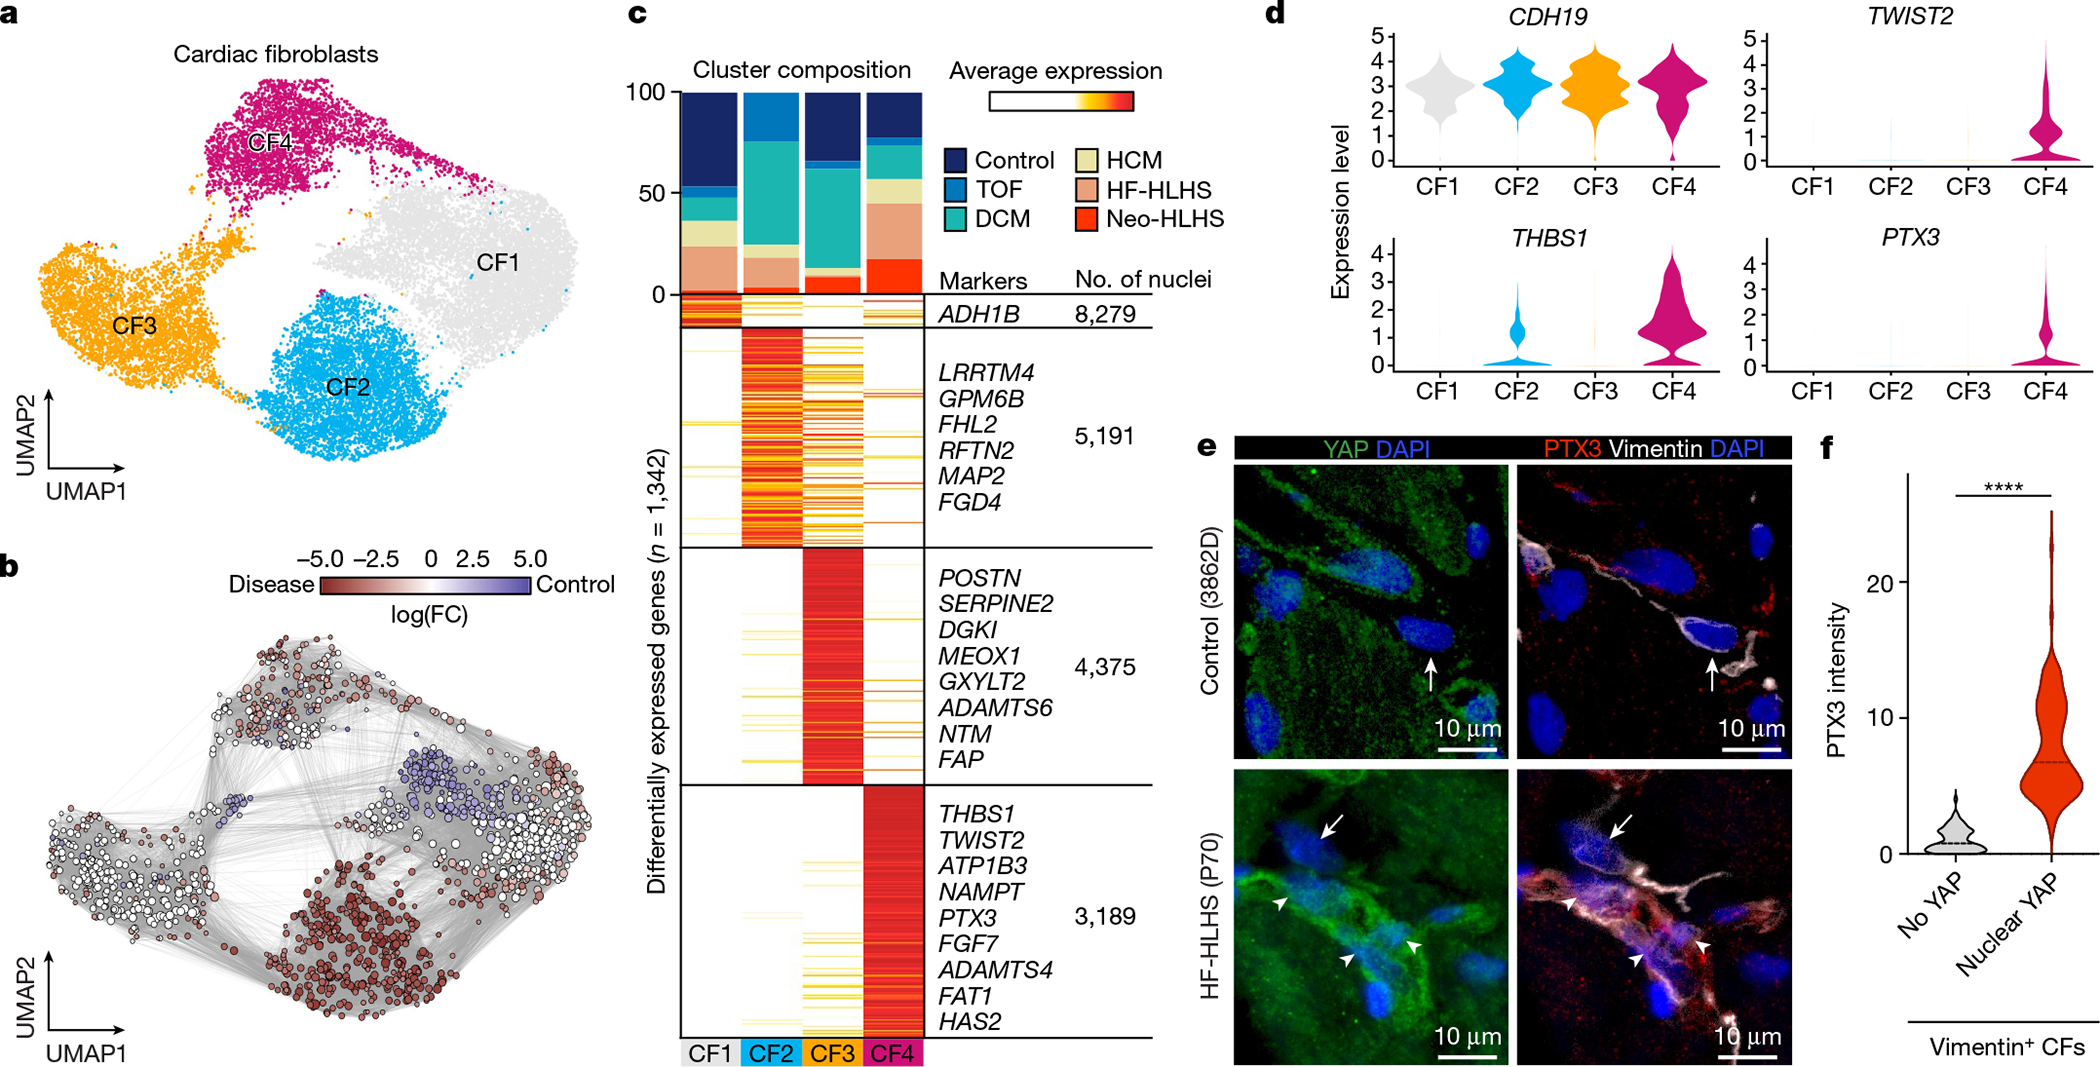
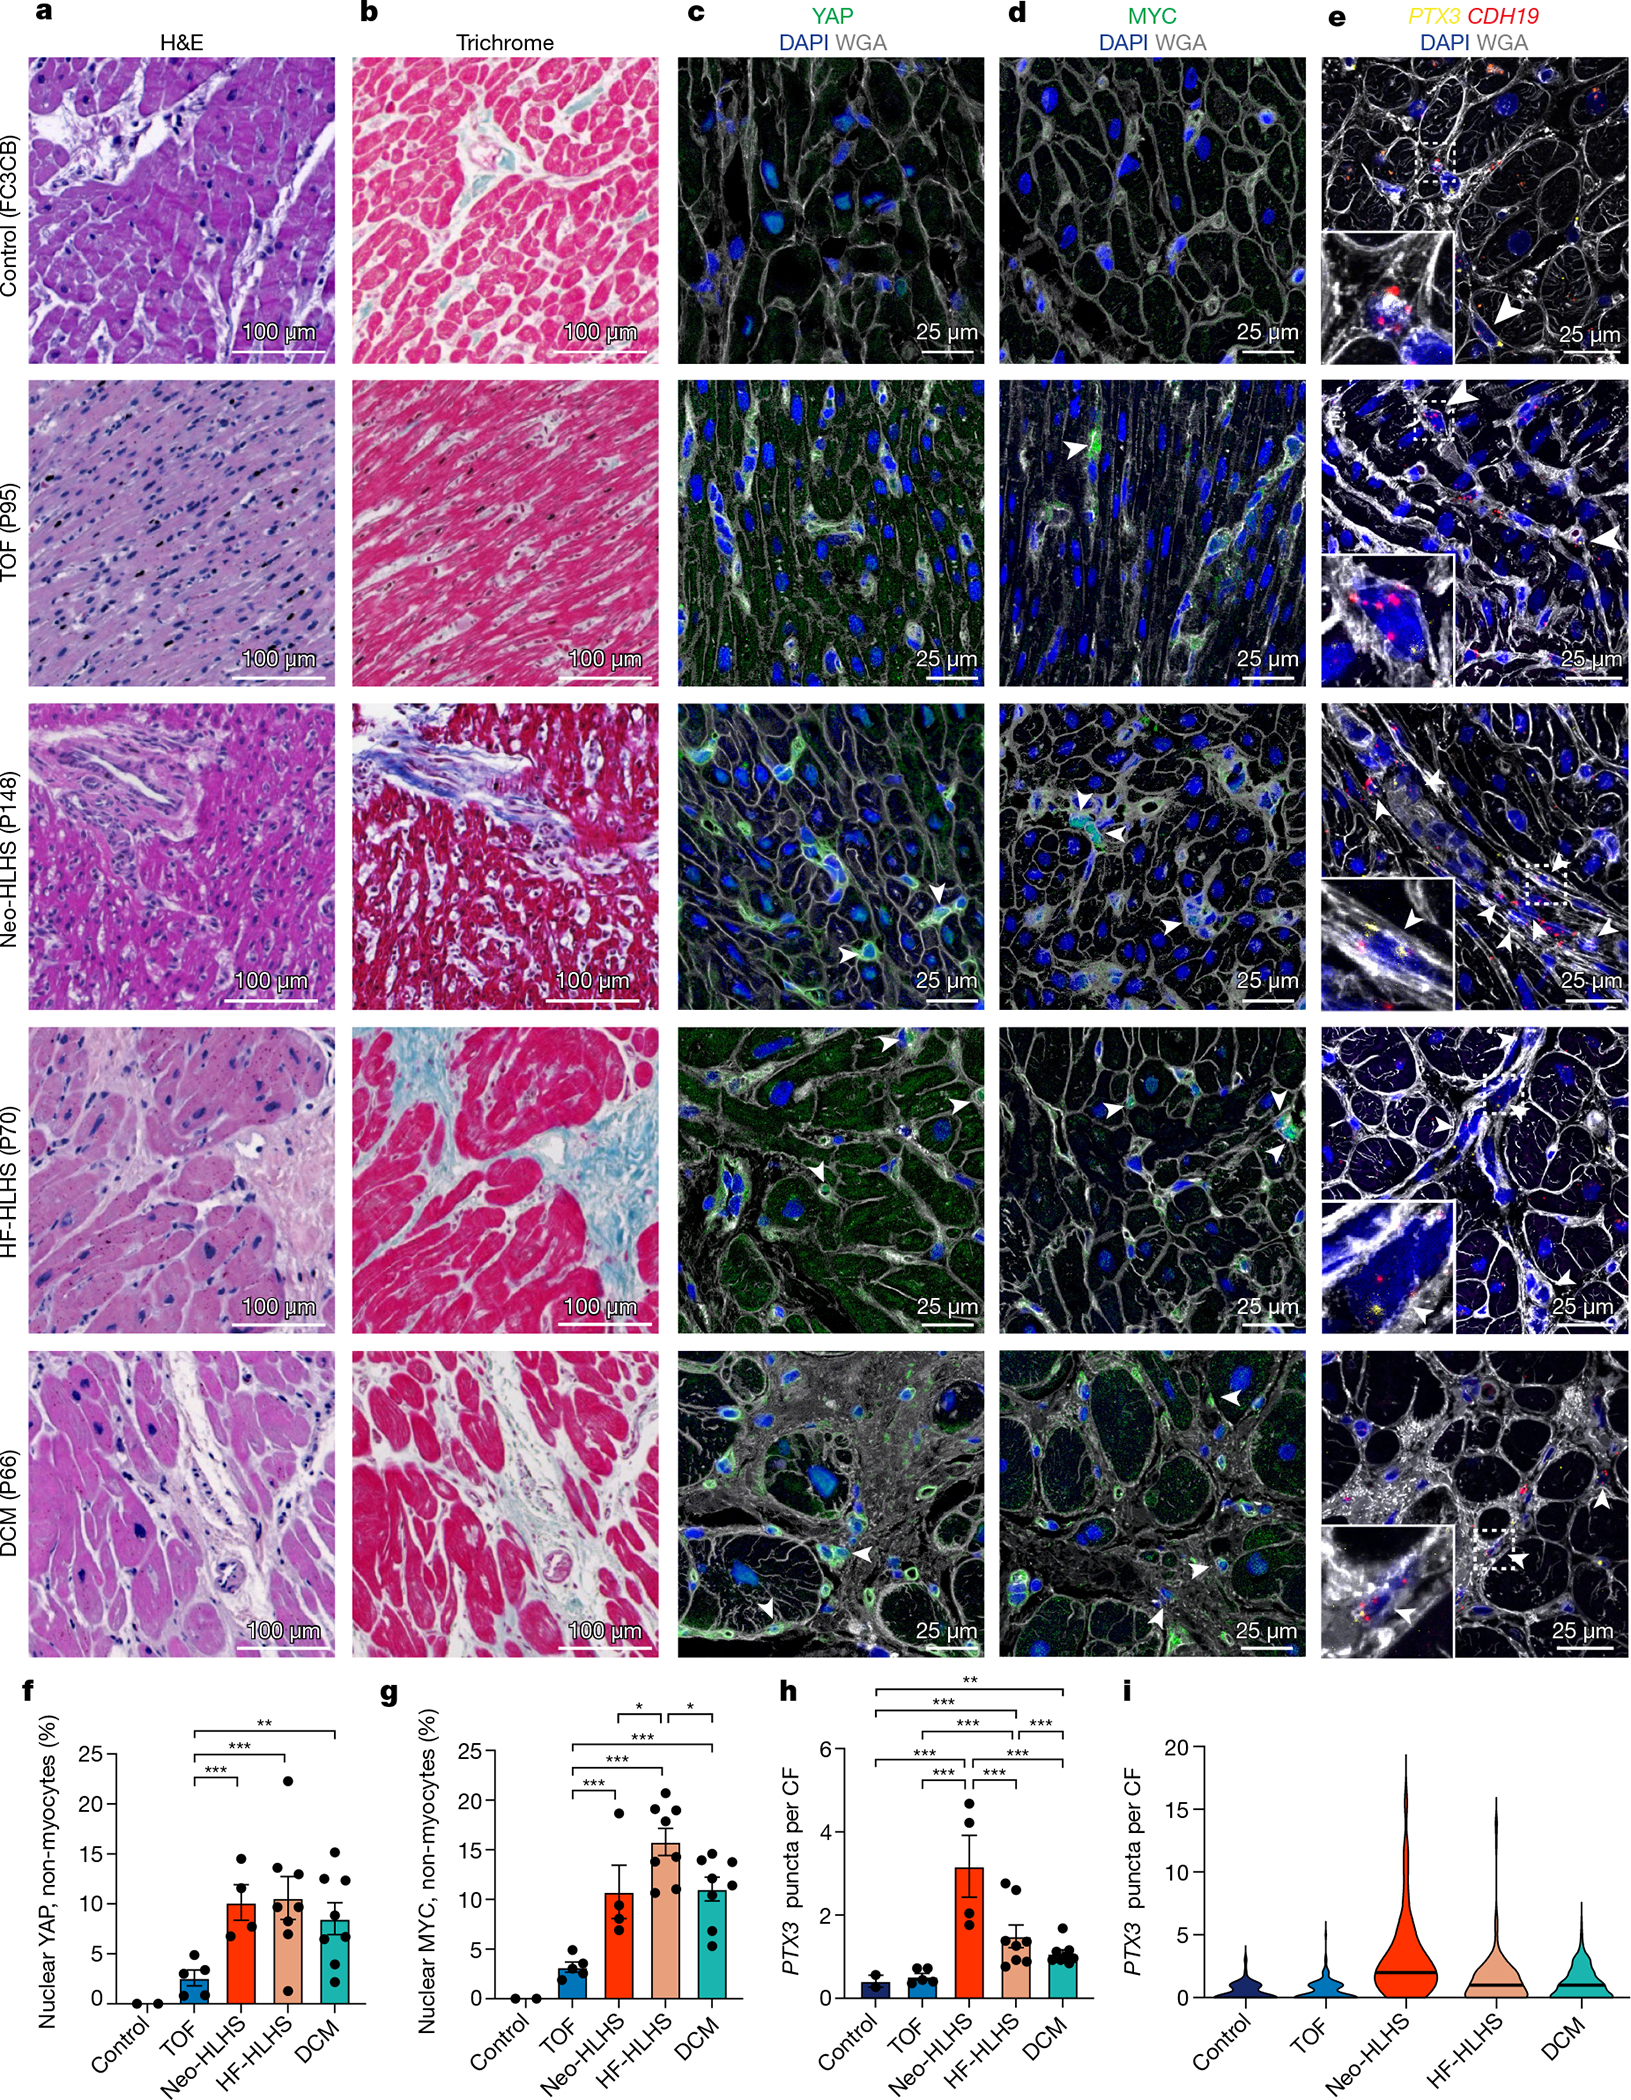
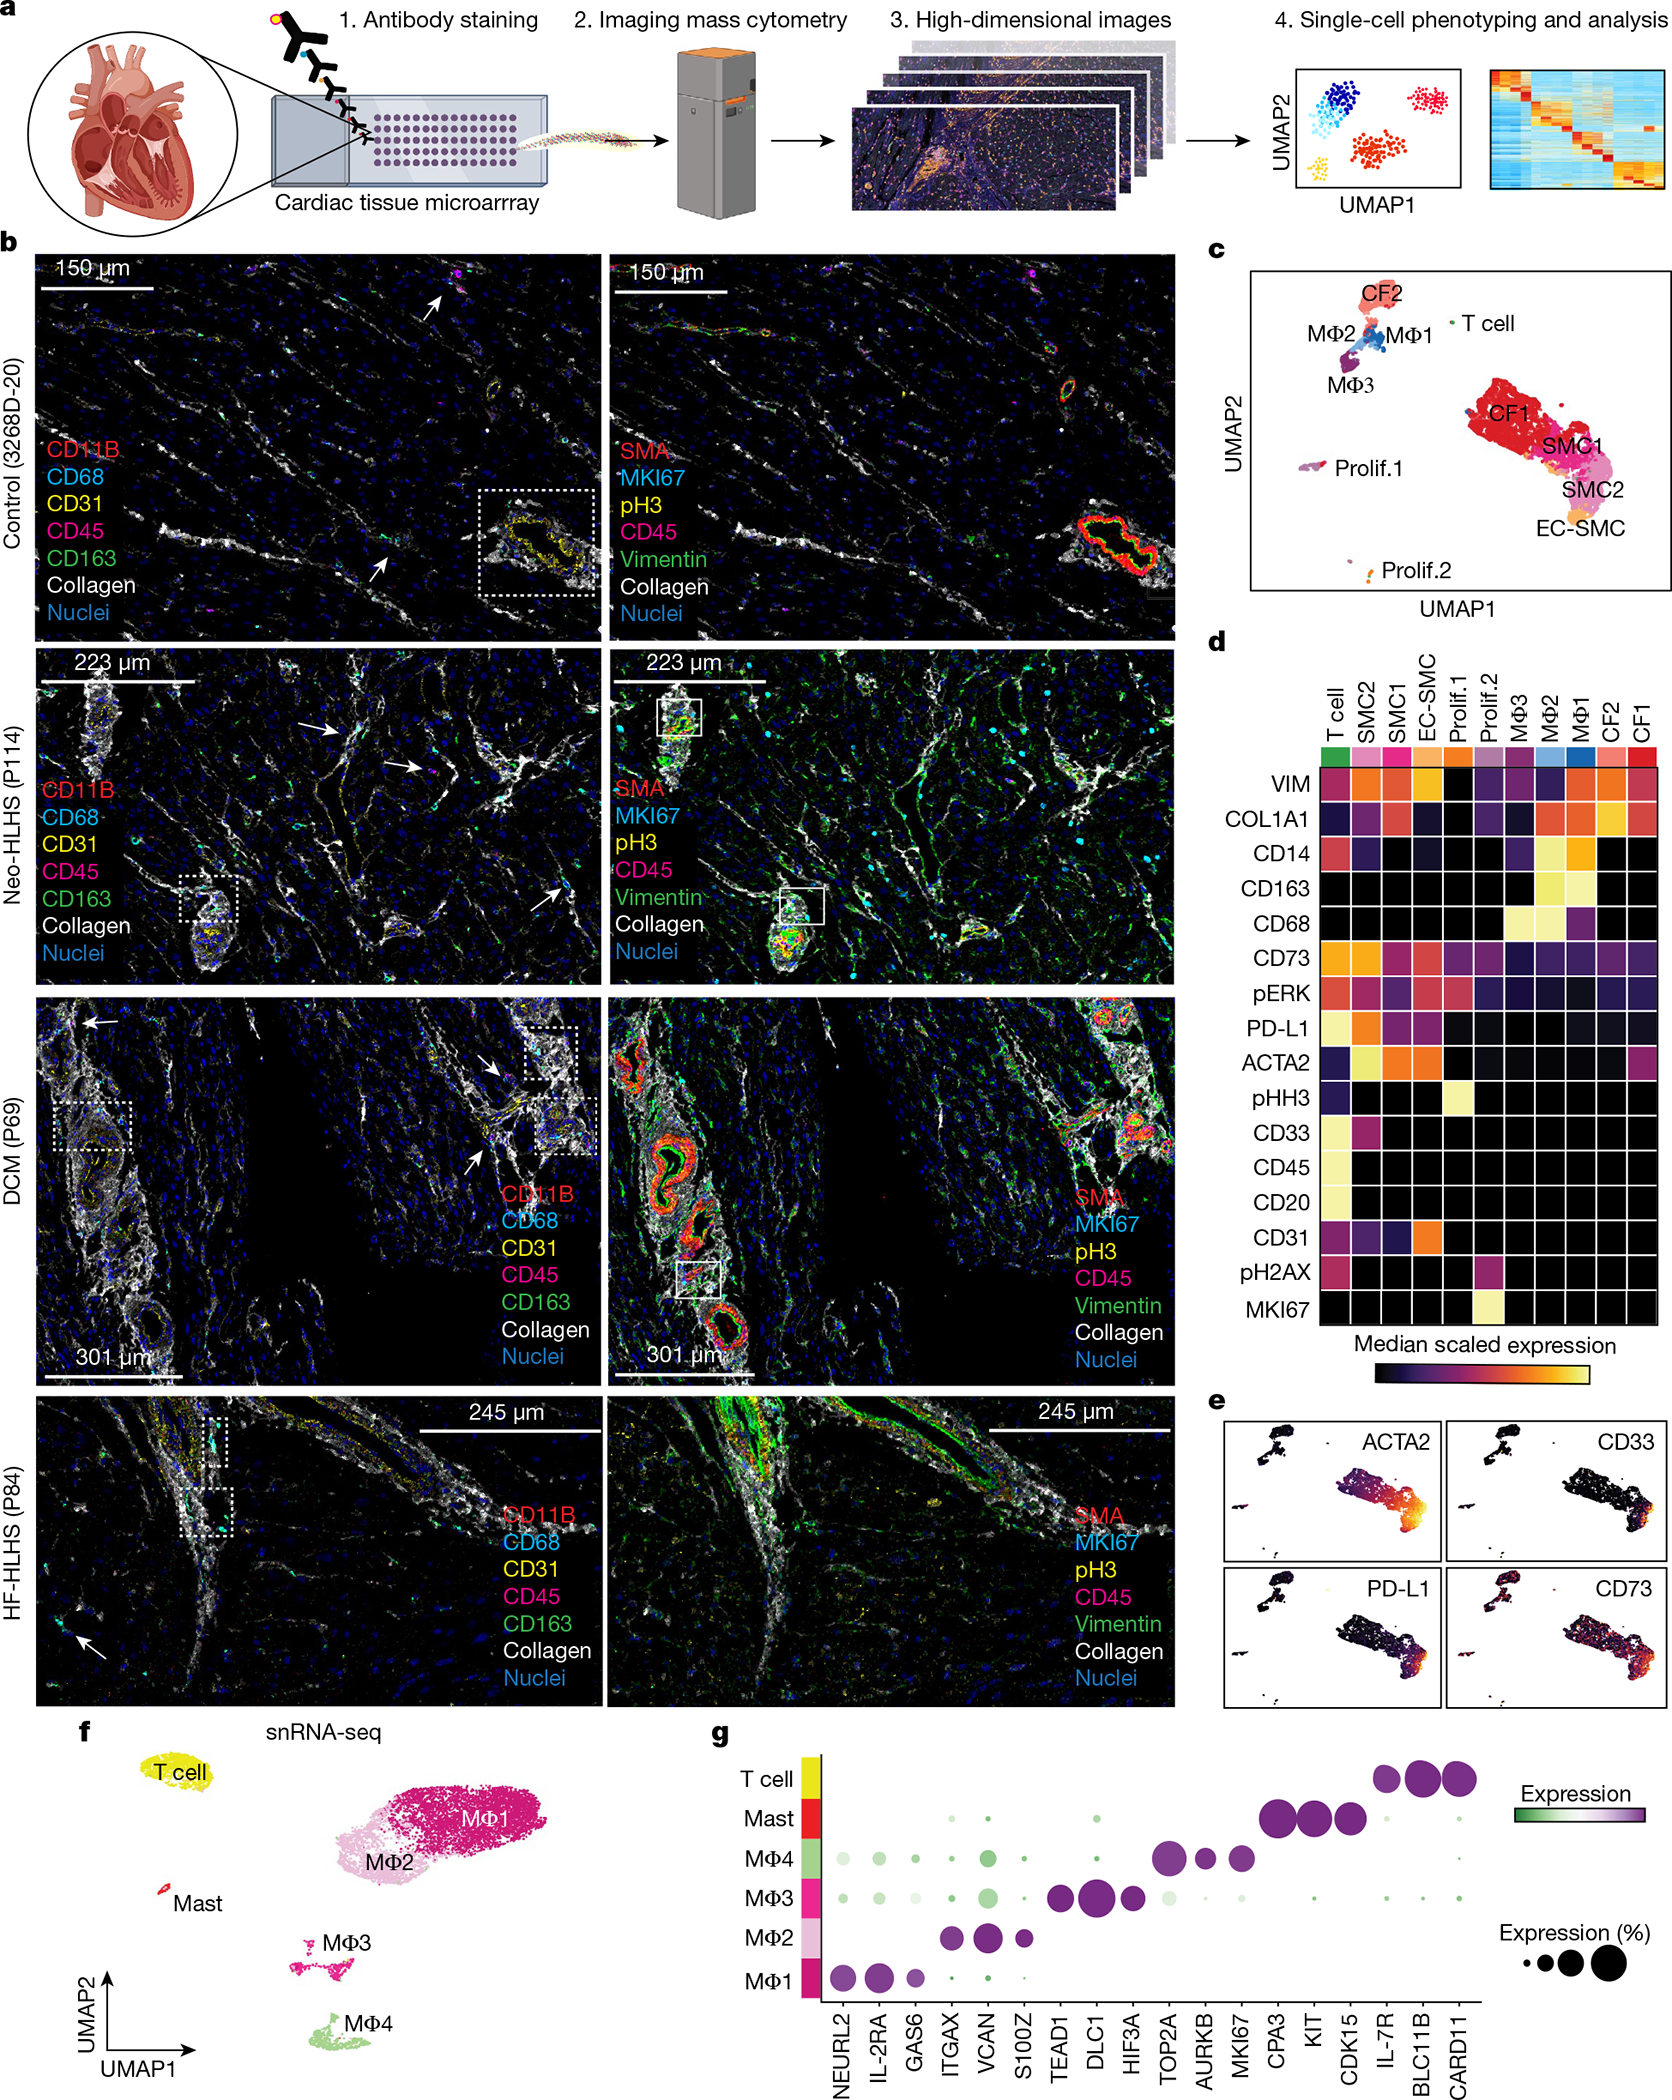
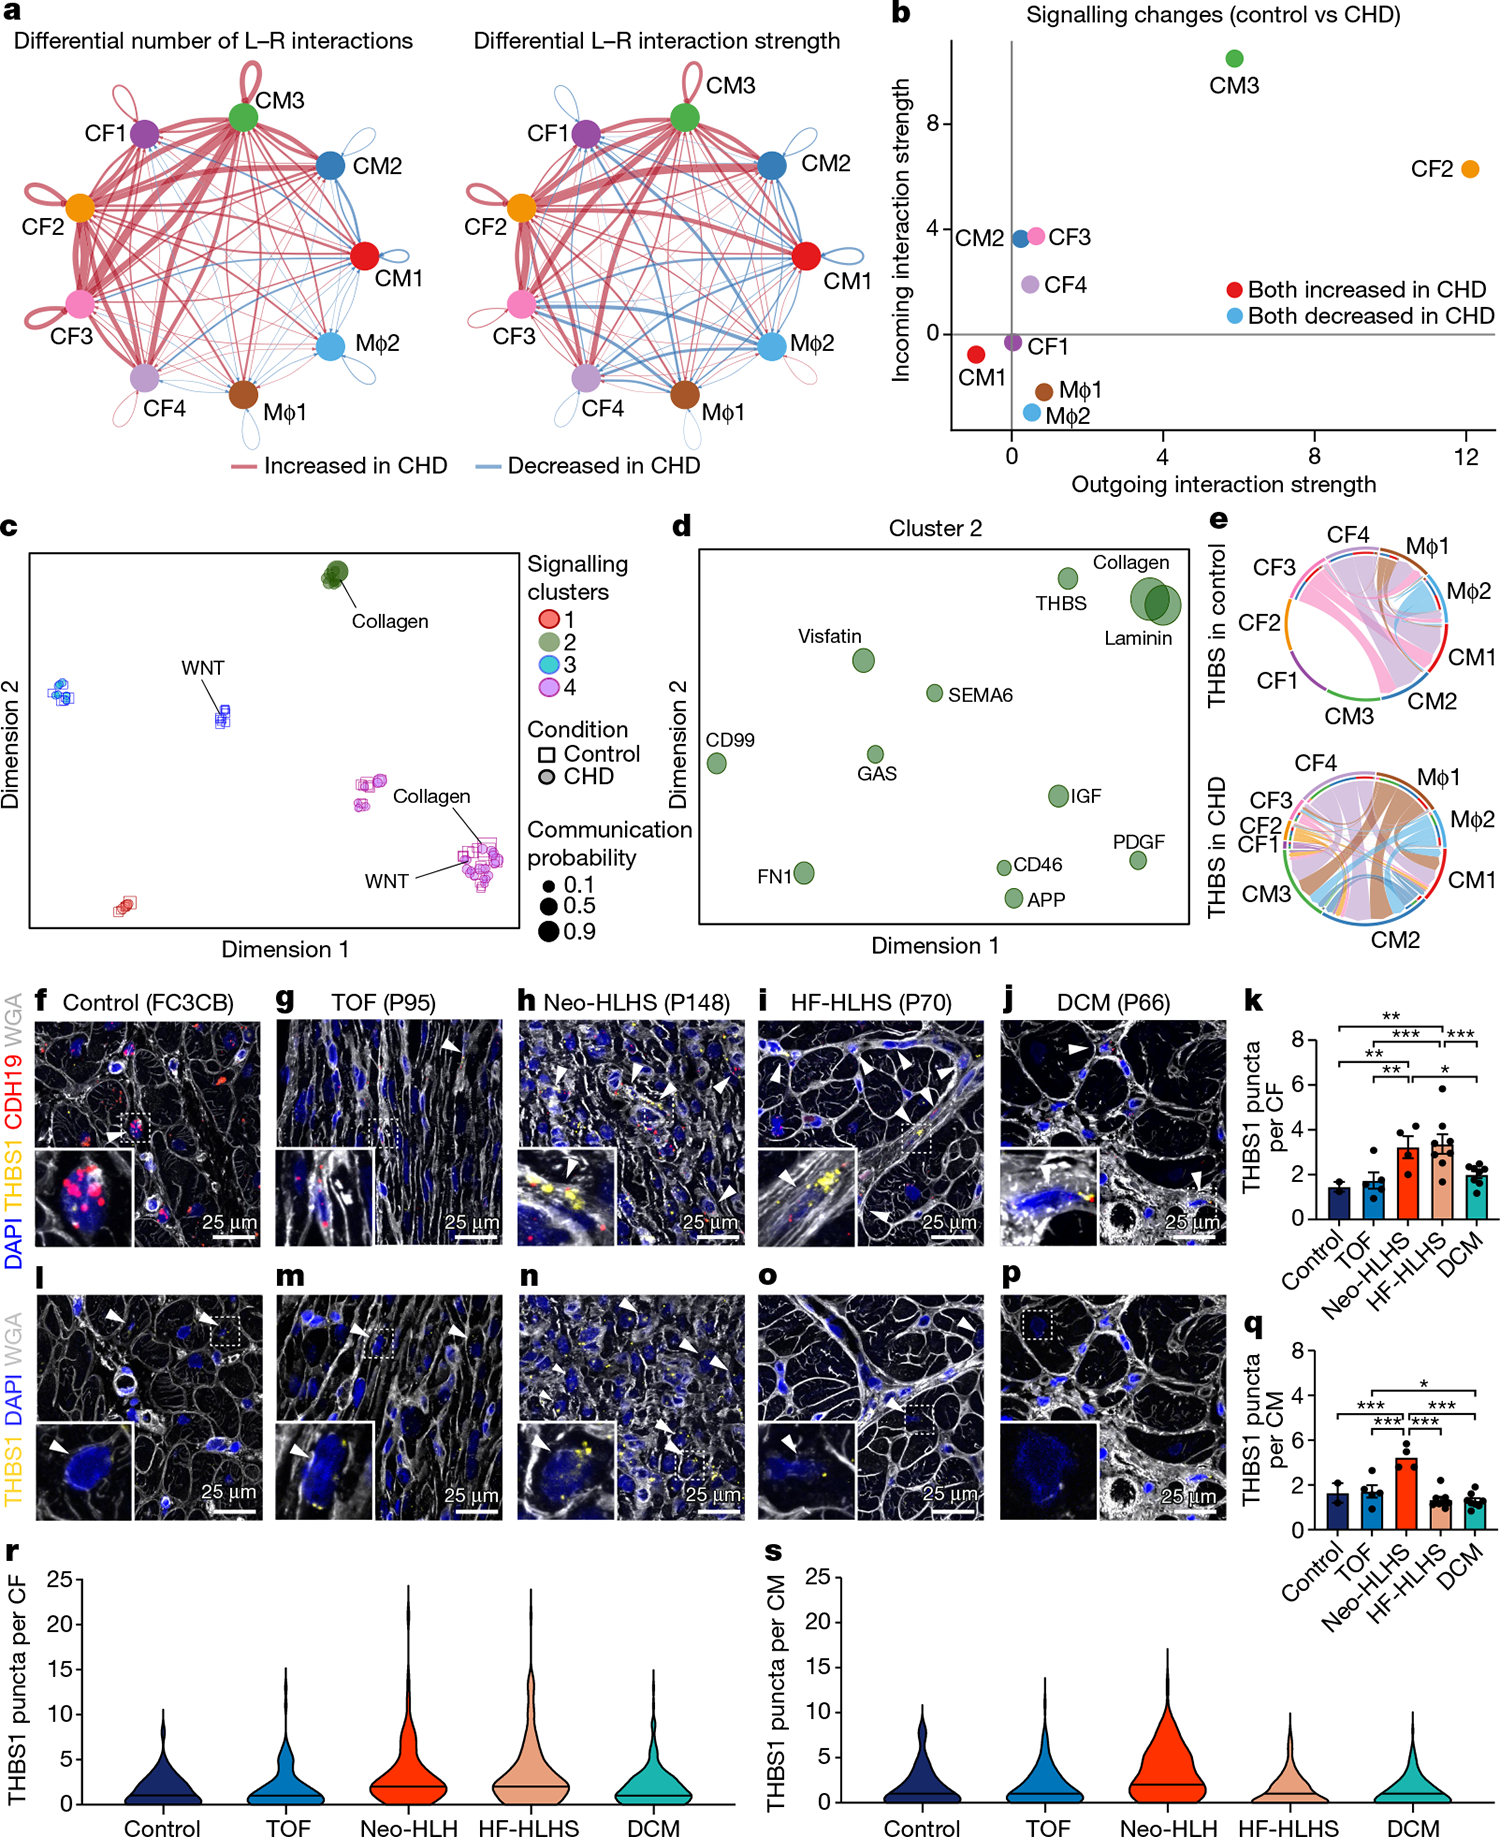
The heart, the first organ to develop in the embryo, undergoes complex morphogenesis that when defective results in congenital heart disease (CHD). With current therapies, more than 90% of patients with CHD survive into adulthood, but many suffer premature death from heart failure and non-cardiac causes1. Here, to gain insight into this disease progression, we performed single-nucleus RNA sequencing on 157,273 nuclei from control hearts and hearts from patients with CHD, including those with hypoplastic left heart syndrome (HLHS) and tetralogy of Fallot, two common forms of cyanotic CHD lesions, as well as dilated and hypertrophic cardiomyopathies. We observed CHD-specific cell states in cardiomyocytes, which showed evidence of insulin resistance and increased expression of genes associated with FOXO signalling and CRIM1. Cardiac fibroblasts in HLHS were enriched in a low-Hippo and high-YAP cell state characteristic of activated cardiac fibroblasts. Imaging mass cytometry uncovered a spatially resolved perivascular microenvironment consistent with an immunodeficient state in CHD. Peripheral immune cell profiling suggested deficient monocytic immunity in CHD, in agreement with the predilection in CHD to infection and cancer2. Our comprehensive phenotyping of CHD provides a roadmap towards future personalized treatments for CHD.


Conflict of interest statement

Competing interests The authors declare no competing interests.

Figures

Extended Data Fig. 1 |
Extended Data Fig. 1 |. Cardiac tissue snRNA-seq profiling.
a, The number of nuclei detected per sample. Calculations for cell (nuclei) per library performed be dividing total number of nuclei by the number of technical replicates (libraries). b, UMAP showing sample identity. Colored according to Extended Data Fig. 1a. c, Cluster composition across cell types. (Top) Number of samples detected per cluster. (Bottom) Stacked bar graph indicating the percentage of each samples contribution to the indicated cluster. Colored according to Extended Data Fig. 1a. d, Pseduobulk RNA-seq from all cell types collapsed. All technical and biological and technical replicates (libraries) are shown. e, Feature plot showing expression of marker genes across global UMAP from Fig. 1b.
Extended Data Fig. 2 |
Extended Data Fig. 2 |. Characterization of pediatric cardiomyocytes.
a, Bar plot indicating the number of cardiomyocyte nuclei detected from each pediatric human sample. b, Stacked bar plot showing the composition of each patient sample across the indicated CM clusters. c, Beeswarm plot showing the log-fold distribution of changes across disease and donors in neighborhoods from different cardiomyocyte clusters. Differentially abundant neighborhoods are shown in color. d, A scree plot displaying the proportion of explained variance for all principal components derived from the pseudo-bulk RNA-seq analysis of CMs. e, Bar plot showing the significance of relation with PC1 (red) and PC2 (blue). f, Venn diagram for the intersection of all individual Diagnoses from pseudobulk RNA-seq analysis. g, Venn diagram for the intersection of all age-related and diagnosis-related genes from pseudo-bulk analysis of CM nuclei. h, Gene signature scores projected across UMAP embedding of CM nuclei. i, Violin plot of CM maturation gene module scores for all CMs separated by patient. The patients are ordered by age, from youngest (left) to oldest (right). j, Violin plot of CM maturation gene module scores for all CMs derived from Sim et. al.
Extended Data Fig. 3 |
Extended Data Fig. 3 |. Cardiomyocyte transcriptomic Maturation.
a, Heatmap of log2 foldchange values from pseudo-bulk RNA-seq analysis of CMs. Adjusted p-value < 0.01. b, Gene ontology (GO) analysis of mature and young gene signatures identified in Extended Data Fig.2j.
Extended Data Fig. 4 |
Extended Data Fig. 4 |. Epigenomic characterization of cardiomyocytes in CHD.
a, Feature plots showing gene expression in cardiomyocytes. bd, RNAscope for CRIM1 and CORIN. e, Genome browser tracks displaying cardiomyocyte-specific ATAC-seq data. f, Venn diagram showing the overlap of genes annotated from ATAC-seq peaks and snRNA-seq clusters.
Extended Data Fig. 5 |
Extended Data Fig. 5 |. Transcriptional profiling of pediatric cardiac fibroblasts and endothelial cells.
a, Bar plot indicating the number of fibroblast nuclei detected from each sample. b, Stacked bar plot showing the composition of each sample across the indicated CF clusters. c, Stacked bar graph displaying the total number of detected CF nuclei from each patient group. The composition of each CF cluster is highlighted. d, Enrichment map for gene pathway overrepresentation analysis colored by CF cluster. e, UMAP manifold of cardiac ECs colored by cluster. (f) Dot plot of snRNA-seq expression for EC marker genes. g, Embedding of the Milo K-NN differential abundance testing results for ECs. All nodes represent neighborhoods, colored by their log fold changes for disease versus donor. Neighborhoods with insignificant log fold changes (FDR 10%) are white. Layout of nodes determined by UMAP embedding, shown in Extended Data Fig. 5e. h, Beeswarm plot showing the log-fold distribution of changes across disease and donors in neighborhoods from different EC clusters. Differentially abundant neighborhoods are shown in color. i, Top, cluster composition bar plot colored by patient diagnosis. Bottom, heatmap displaying average expression for all differentially expressed genes for EC clusters. j, Enrichment map for gene pathway over-representation analysis colored by EC cluster.
Extended Data Fig. 6 |
Extended Data Fig. 6 |. Additional tissue histology.
ae, H&E and trichrome staining of additional myocardial samples from donor (a), TOF (b), Neo-HLHS (c), HF-HLHS (d), and DCM (e) patients. Left image is a 2-mm core, and the dashed box outlines the highlighted perivascular region at high magnification in the right image.
Extended Data Fig. 7 |
Extended Data Fig. 7 |. Transcriptional profiling of pediatric cardiac immune cell populations.
a, Representative images of cell-segmentation and phenotyping analysis performed on imaging mass cytometry (IMC) images. b, Representative images of IMC (top) and immunofluorescence (bottom)of LYZ marker expression. Solid boxes indicate same regions with LYZ expression. c, Embedding of the Milo K-NN differential abundance testing results for cardiac immune cell populations. All nodes represent neighborhoods, colored by their log fold changes for disease versus Donor. Neighborhoods with insignificant log fold changes (FDR 10%) are white. Layout of nodes determined by UMAP embedding, shown in Fig. 6f. d, Beeswarm plot showing the log-fold distribution of changes across disease and donors in neighborhoods from different immune cell clusters. Differentially abundant neighborhoods are shown in color. Compiled from Extended Data Fig. 7a. (e) Top, cluster composition bar plot colored by patient diagnosis. Bottom, heatmap displaying average expression for all differentially expressed genes for myeloid and lymphoid cell clusters. (f) Enrichment map for gene pathway overrepresentation analysis colored by cardiac immune cell cluster. (g) Left, protein expression from IMC data across UMAP embedding. Right, feature plot displaying gene expression from snRNA-seq. (h) Feature plot displaying gene expression from snRNA-seq. Related to Fig. 1b.
Extended Data Fig. 8 |
Extended Data Fig. 8 |. Single-cell transcriptomic analysis of PBMCs from pediatric patients with CHD.
a, Diagram depicting the overall study design for hematological profiling in CHD patients. b, UMAP embedding of PBMCs colored by cell type. c, Feature plots showing the expression of marker genes. d, UMAP embedding of PBMC scRNA-seq data colored by patient sample Identification number. e, Cluster composition analysis of PBMC scRNA-seq data. f, Cluster composition stacked-bar plot highlighting the percent of cells from each diagnosis group within each single cell cluster. g, Density plot for each indicated diagnosis over the UMAP embedding from Extended Data Fig. 8b. h, UMAP embedding of peripheral monocyte cells. i, Dot plot displaying marker gene expression from monocyte cell clusters. j, Cluster composition analysis of monocyte clusters colored by patient diagnosis. k, UMAP embedding of peripheral NK cells. l, Dot plot displaying marker gene expression from NK cell clusters. m, Cluster composition analysis of NK cell clusters colored by patient diagnosis.
Extended Data Fig. 9 |
Extended Data Fig. 9 |. Transcriptomic and epigenomic characterization of peripheral immune cell populations in CHD.
a, Top, PCA plot of NK and CD14+ cell ATAC-seq data. Bottom, Genome Browser tracks for NK cell and CD14+ cell ATAC-seq data. Each track is patient matched by diagnosis. b, Heatmap displaying differential chromatin accessibility analysis of NK cells versus CD14+ monocytes. c, Genome browser tracks displaying genes identified from differential expression analysis in scRNA-seq. d, Left, heatmap displaying the average mRNA expression per cluster of each cytokine (rows) detected in the plasma of CHD patients. Right, heatmap showing the protein expression of each cytokine (row) detected in CHD patient-derived plasma (columns). e, Heatmap depicting the expression of each cognate receptor from the putative ligands identified in Extended Data Fig. 9d from the cardiac snRNA-seq data. f, receptor-ligand map showing the highly expressed receptors identified in Extended Data Fig. 9e with their respective ligands identified in patient plasma. Connections colored by snRNA-seq cluster.
Fig. 1 |
Fig. 1 |. Profiling of tissues from paediatric controls and patients with CHD or heart failure.
a, Overview of the tissue profiling strategy and the use of available datasets for age scoring. Cardiac tissues collected from paediatric patients were flash-frozen or fixed in formalin. Control data were from Sim et al. (2021). Formalin-fixed tissue sections were used for histology and imaging. **n = 2, ****n = 4; mo, month. b, Uniform manifold approximation and projection (UMAP) embedding of 157,293 paediatric cardiac nuclei. CM, cardiomyocyte; CF, cardiac fibroblast; EC, endothelial cell; EpiL, epithelial-like; EpiC, epicardial cell; EndoC, endocardial cell; LEC, lymphatic endothelial cell; PeriC, pericyte; Adipo, adipocyte; Neuro, neuron; MΦ, macrophage. c, Heat map displaying DEGs for each cluster. Clusters are coloured according to Fig. 1b. The signal indicates the average expression for each cluster. Representative genes are displayed on the right. WBSCR17 is also known as GALNT17; MUM1L1 is also known as PWWP3B.
Fig. 2 |
Fig. 2 |. snRNA-seq showing the unique transcriptional signature of cardiomyocytes in paediatric patients with CHD.
a, UMAP embedding of reiterative clustering of cardiomyocytes. b, Embedding the Milo k-nearest neighbour differential abundance testing results for cardiomyocytes. All nodes represent neighbourhoods, coloured by log fold changes for CHD versus control samples. Neighbourhoods with insignificant log fold changes (false discovery rate (FDR) < 10%) are shown in white. The layout of nodes is determined by UMAP embedding, as shown in a. c, Top, cluster composition plot indicating the percentage of cells from each diagnosis that contribute to each cluster. Bottom, average expression heat map with representative genes shown on the right. d, PCA plot for pseudo-bulk RNA-seq analysis of all cardiomyocytes by diagnosis. Plots are coloured by diagnosis as in c. Ellipses indicate the 95% confidence interval. Replicates (libraries) from each sample indicated by a different shape. e, PCA plot for pseudo-bulk RNA-seq analysis of all cardiomyocytes from d, coloured by donor age. The colours highlight the gross pattern of age progression from youngest to oldest. Ellipses indicate the 95% confidence interval. f, Cluster enrichment map displaying the proportional KEGG pathways analysis for all cardiomyocyte clusters. The size of each node indicates the number of genes within each KEGG category. g, Violin plots showing expression levels for each cardiomyocyte cluster, coloured according to the cluster designations in a. h,i, RNA fluorescence in situ hybridization for CRIM1 and CORIN, co-stained with DAPI and wheat germ agglutinin (WGA). Arrowheads show cardiomyocytes with high CORIN expression and arrows show cardiomyocytes with high CRIM1 expression. j, CRIM1:CORIN expression ratio (n = 672) across 27 individuals (2 control, 5 TOF, 4 Neo-HLHS, 8 HF-HLHS and 8 DCM), each data point is the average relative expression in a sample from one individual. *P < 0.05, ***P < 0.001, ****P < 0.0001 with mixed-effect model. Data are mean values ± s.e.m.
Fig. 3 |
Fig. 3 |. Profiling of cardiac fibroblasts in paediatric patients.
a, UMAP embedding of cardiac fibroblast reiterative clustering. b, Embedding of Milo k-nearest neighbour differential abundance testing results for cardiac fibroblasts. All nodes represent neighbourhoods, coloured by log fold change for CHD versus controls. Neighbourhoods with insignificant log fold changes (FDR <10%) are shown in white. The layout of nodes is determined by UMAP embedding shown in a. c, Top, cluster composition plot indicating the percentage of cells from each diagnosis that contribute to each cluster. Bottom, average expression heat map with representative genes shown on the right. d, Violin plots showing expression levels for each cardiac fibroblast cluster, coloured according to the cluster designations in a.e, Representative YAP and PTX3 expression in vimentin-positive cardiac fibroblasts in an HF-HLHS sample. Arrows show cardiac fibroblasts without nuclear YAP and arrowheads denote nuclear YAP. f, Quantification of PTX3 intensity in cardiac fibroblasts that are negative (n = 73) and positive (n = 101) for nuclear YAP across fifteen samples (2 controls, 3 TOF, 2 neo-HLHS, 4 HF-HLHS and 4 DCM). Two-tailed Mann–Whitney test. ****P < 0.0001.
Fig. 4 |
Fig. 4 |. Tissue histology and validation of tissue snRNA-seq results across paediatric cardiac diseases.
a, Haematoxylin and eosin (H&E) staining of myocardial samples. b, Masson’s trichrome staining of myocardial samples. c,d, Tissue immunohistochemistry for YAP (c) and MYC (d), co-stained with DAPI and WGA to visualize tissue composition. Arrowheads indicate cells with a nuclear expression pattern of the protein of interest. e, RNAscope for PTX3 and CDH19, co-stained with DAPI and WGA to visualize tissue composition. Arrowheads show co-expression of PTX3 and CDH19. f,g, Quantification of nuclear localization of YAP (f) and MYC (g) in non-myocytes (n = 5,897 for YAP, n = 5,149 for MYC). Each data point shows the percentage of cells with nuclear expression in one sample (2 control, 5 TOF, 4 Neo-HLHS, 8 HF-HLHS and 8 DCM). h, Quantification of relative PTX3 expression in CDH19+ fibroblasts (n = 668). Each data point is the average expression from an individual sample (2 control, 5 TOF, 4 Neo-HLHS, 8 HF-HLHS and 8 DCM). i, Violin plot of PTX3 expression in cardiac fibroblasts (n = 668). *P < 0.05, **P < 0.01, ***P < 0.001; mixed-effects model. Data are mean ± s.e.m.
Fig. 5 |
Fig. 5 |. High-dimensional histopathology of paediatric cardiac diseases.
a, Schematic of the IMC experimental and analytical workflow. b, Representative IMC images from the indicated patient samples. Dashed boxes indicate immune infiltrates in perivascular regions. Arrows indicate cells expressing immune marker CD45 and macrophage-specific markers (CD163, CD68 and CD11B). Solid boxes indicate cells expressing the proliferation marker MKI67 in perivascular regions. c, UMAP embedding of all IMC data, coloured by cluster. Prolif., proliferating cells. Total samples: 20 (1 Neo-HLHS, 8 HF-HLHS, 3 TOF, 8 DCM). d, Heat map displaying biomarker expression across each cell cluster. e, Plots showing biomarker expression from IMC. f, UMAP embedding of immune cell populations derived from cardiac tissue. g, Dot plot showing highly expressed markers for each immune cell population.
Fig. 6 |
Fig. 6 |. Intercellular communication in paediatric cardiovascular disease.
a, Circle plot highlighting the differential number of ligand–receptor (L–R) interactions between control and CHD nuclei. b, Comparison of major targets and source shifts between control and CHD samples. Positive values indicate an increase in signal in CHD. c, Joint projection and clustering of signalling pathways from control and CHD datasets according to topological pathway similarities. Each data point represents an individual signalling pathway. The size of each point is proportional to the communication probability of that network. Representative pathways are highlighted. d, Magnified view of cluster 2 from c. The size of each point is proportional to the communication probability. e, Circle plot showing THBS signalling network activity in control and CHD cardiac tissue. Each link indicates an intercellular connection. The root of each arrow is the ligand-expressing cell type, and the tip of each arrow is the receiving cell. fj, RNAscope for THBS1 and CDH19 in control (f), TOF (g), Neo-HLHS (h), HF-HLHS (i) and DCM (j) tissue, co-stained with DAPI and WGA to visualize tissue composition. Arrowheads show co-expression of THBS1 and CDH19 in cardiac fibroblasts. k, TBHS1 expression in CDH19+ fibroblasts (n = 640). Each data point represents average expression from one sample (2 control, 5 TOF, 4 Neo-HLHS, 8 HF-HLHS and 8 DCM). lp, RNAscope for THBS1 in control (l), TOF (m), Neo-HLHS (n), HF-HLHS (o) and DCM (p) tissue. Arrowheads show THBS1 expression in cardiomyocytes. q, Relative TBHS1 expression in cardiomyocytes (n = 611). Each data point represents average expression from one sample (2 control, 5 TOF, 4 Neo-HLHS, 8 HF-HLHS and 8 DCM). r, Violin plot of THBS1 expression in cardiac fibroblasts (n = 640). s, Violin plot of THBS1 expression in cardiomyocytes (n = 611). *P < 0.05, **P < 0.01, ***P < 0.001; mixed-effects model. Data are mean ± s.e.m.

Comment in

  • Single-cell profiles of CHD and CM.
    Huynh K. Huynh K. Nat Rev Cardiol. 2022 Sep;19(9):575. doi: 10.1038/s41569-022-00753-2. Nat Rev Cardiol. 2022. PMID: 35817872 No abstract available.

References

    1. Raissadati A, Nieminen H, Jokinen E & Sairanen H Progress in late results among pediatric cardiac surgery patients: a population-based 6-decade study with 98% follow-up. Circulation 131, 347–353 (2015). - PubMed
    1. Diller GP et al. Survival prospects and circumstances of death in contemporary adult congenital heart disease patients under follow-up at a large tertiary centre. Circulation 132, 2118–2125 (2015). - PubMed
    1. Hsu DT & Pearson GD Heart failure in children: part II: diagnosis, treatment, and future directions. Circ. Heart. Fail. 2, 490–498 (2009). - PubMed
    1. Friedberg MK & Reddy S Right ventricular failure in congenital heart disease. Curr. Opin. Pediatr. 31, 604–610 (2019). - PMC - PubMed
    1. Gurvitz M et al. Emerging research directions in adult congenital heart disease: A report from an NHLBI/ACHA working group. J. Am. Coll. Cardiol. 67, 1956–1964 (2016). - PMC - PubMed

MeSH terms

Substances