. 2022 Jun;10(6):e004133.
doi: 10.1136/jitc-2021-004133.

BCG hydrogel promotes CTSS-mediated antigen processing and presentation, thereby suppressing metastasis and prolonging survival in melanoma

Affiliations

BCG hydrogel promotes CTSS-mediated antigen processing and presentation, thereby suppressing metastasis and prolonging survival in melanoma

Mirela Kremenovic et al. J Immunother Cancer. 2022 Jun.

Abstract

Background: The use of intralesional Mycobacterium bovis BCG (intralesional live BCG) for the treatment of metastatic melanoma resulted in regression of directly injected, and occasionally of distal lesions. However, intralesional-BCG is less effective in patients with visceral metastases and did not significantly improve overall survival.

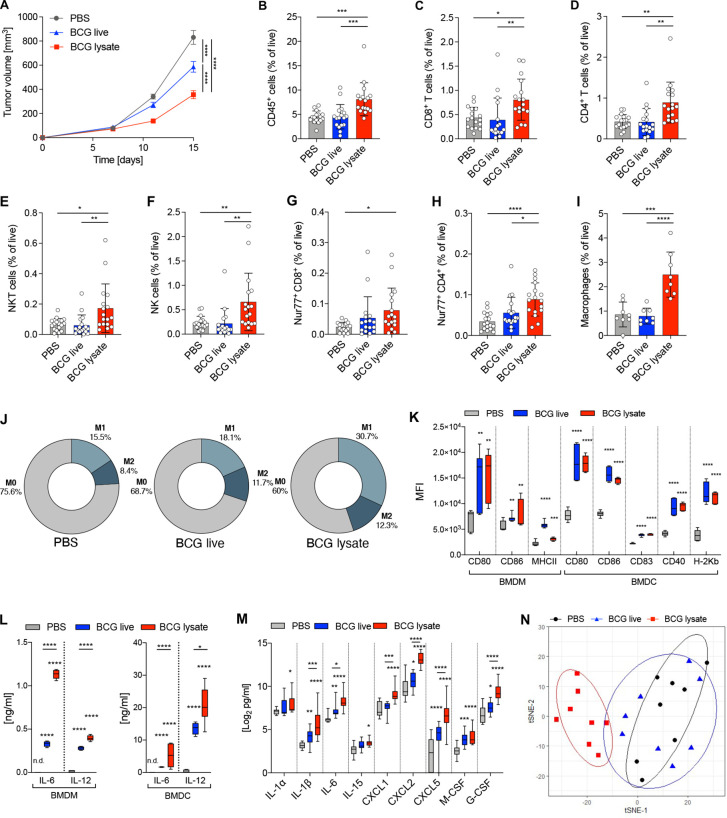
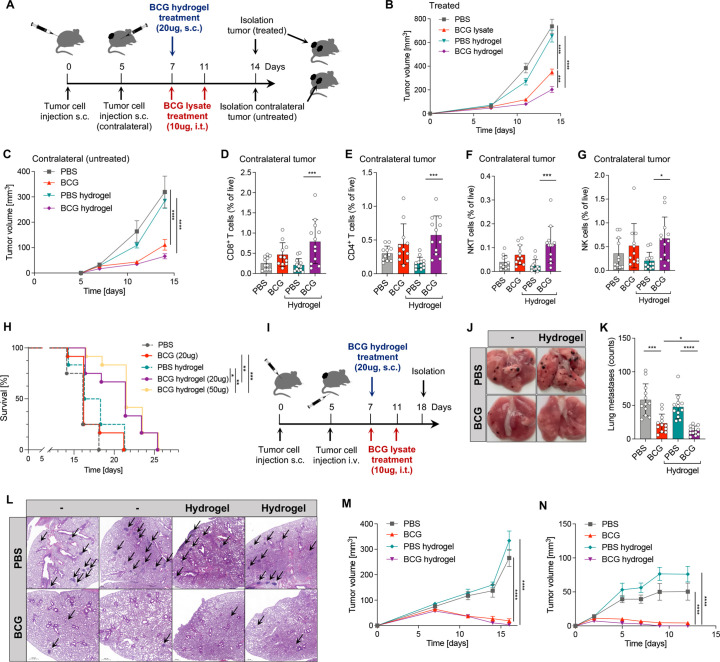
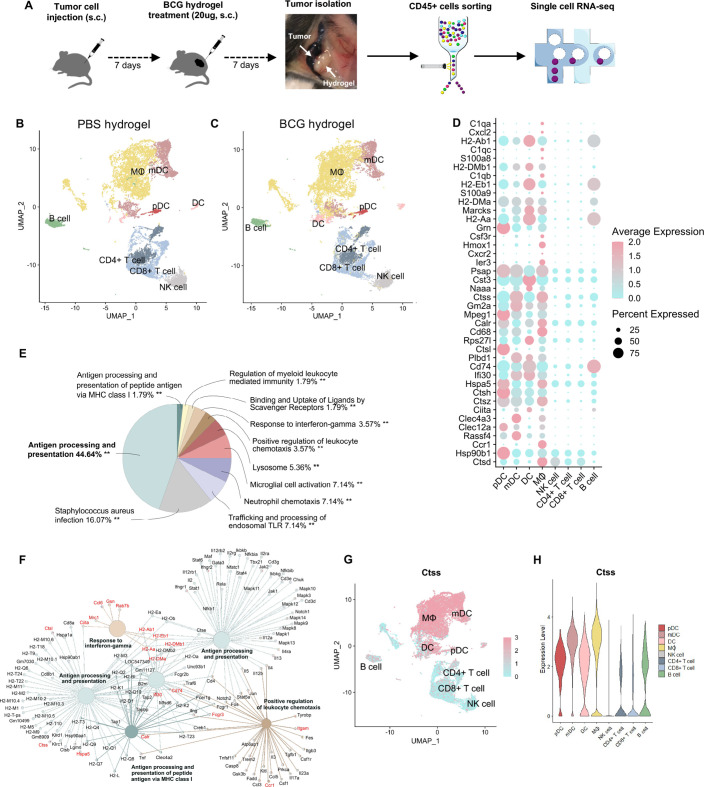
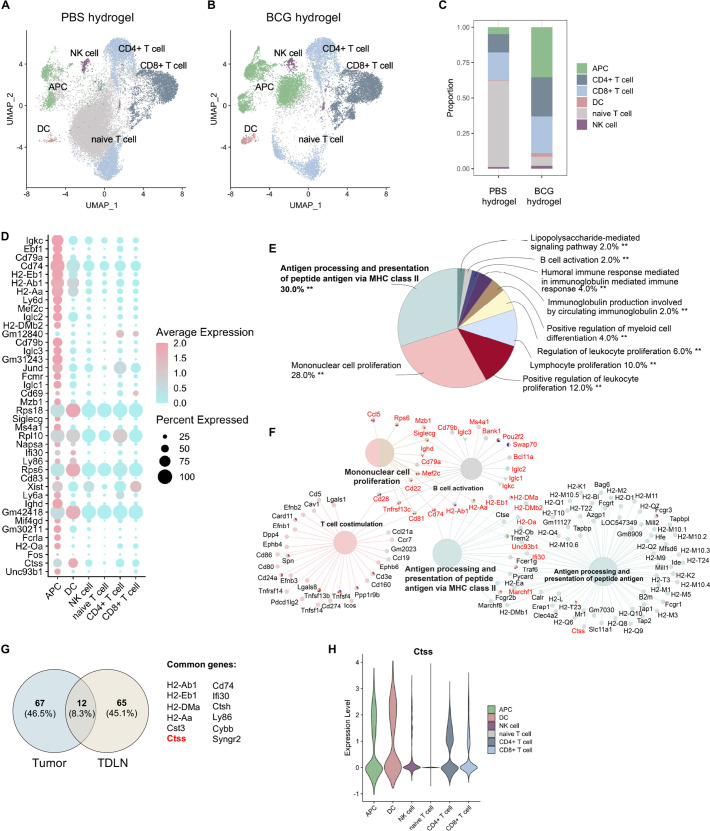
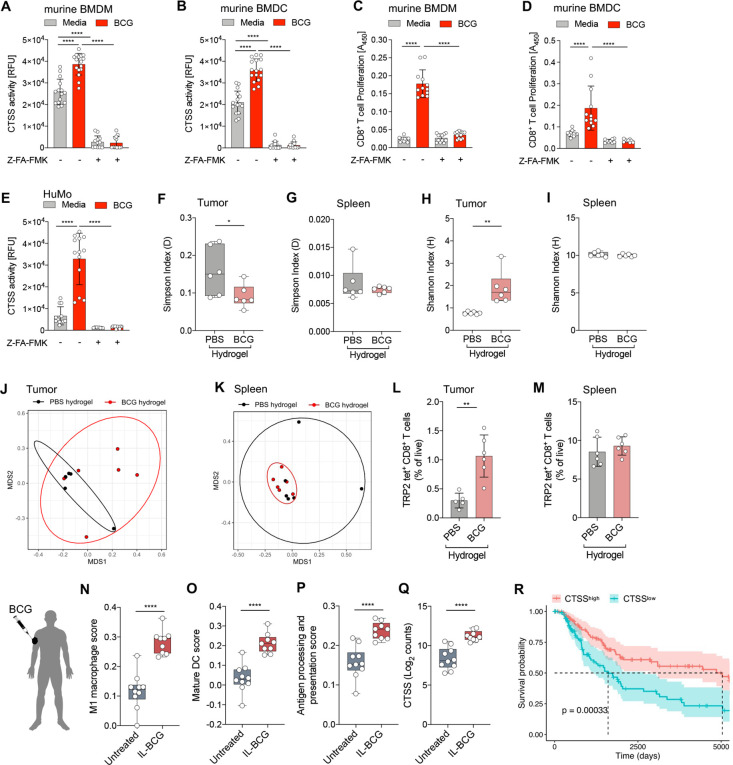
Methods: We generated a novel BCG lysate and developed it into a thermosensitive PLGA-PEG-PLGA hydrogel (BCG hydrogel), which was injected adjacent to the tumor to assess its antitumor effect in syngeneic tumor models (B16F10, MC38). The effect of BCG hydrogel treatment on contralateral tumors, lung metastases, and survival was assessed to evaluate systemic long-term efficacy. Gene expression profiles of tumor-infiltrating immune cells and of tumor-draining lymph nodes from BCG hydrogel-treated mice were analyzed by single-cell RNA sequencing (scRNA-seq) and CD8+ T cell receptor (TCR) repertoire diversity was assessed by TCR-sequencing. To confirm the mechanistic findings, RNA-seq data of biopsies obtained from in-transit cutaneous metastases of patients with melanoma who had received intralesional-BCG therapy were analyzed.

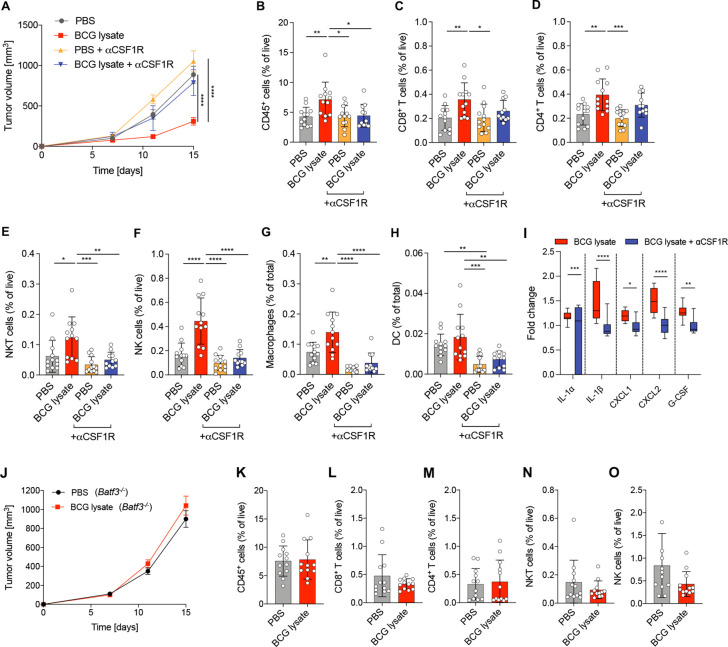
Results: Here, we show that BCG lysate exhibits enhanced antitumor efficacy compared to live mycobacteria and promotes a proinflammatory tumor microenvironment and M1 macrophage (MΦ) polarization in vivo. The underlying mechanisms of BCG lysate-mediated tumor immunity are dependent on MΦ and dendritic cells (DCs). BCG hydrogel treatment induced systemic immunity in melanoma-bearing mice with suppression of lung metastases and improved survival. Furthermore, BCG hydrogel promoted cathepsin S (CTSS) activity in MΦ and DCs, resulting in enhanced antigen processing and presentation of tumor-associated antigens. Finally, BCG hydrogel treatment was associated with increased frequencies of melanoma-reactive CD8+ T cells. In human patients with melanoma, intralesional-BCG treatment was associated with enhanced M1 MΦ, mature DC, antigen processing and presentation, as well as with increased CTSS expression which positively correlated with patient survival.

Conclusions: These findings provide mechanistic insights as well as rationale for the clinical translation of BCG hydrogel as cancer immunotherapy to overcome the current limitations of immunotherapies for the treatment of patients with melanoma.

Keywords: antigen presentation; dendritic cells; immunotherapy; macrophages; melanoma.


Conflict of interest statement

Competing interests: None declared.

Figures

Figure 1
Figure 1
BCG lysate mediates tumor growth inhibition, immune cell-infiltration and a proinflammatory TME. (A) Growth curve of treated and untreated B16F10 melanoma. Data are represented as mean±SEM using two-way ANOVA followed by Šidák’s multiple comparisons test (n=25 per group, four independent experiments). (B–I) Relative frequencies of cell subsets measured by flow cytometry: (B) CD45+ cells, (C) CD8+ T cells, (D) CD4+ T cells, (E) NKT cells, (F) NK cells, (G) Nur77+ CD8+ T cells, (H) Nur77+ CD4+ T cells (n=17 per group, three independent experiments) and (I) MΦ (n=8 per group). Data are shown as mean±SD using one-way ANOVA, followed by Tukey’s multiple comparisons test. (J) Donut charts representing mean percentages of M0 MΦ, M1 MΦ and M2 MΦ within treated and untreated tumors. (K, L) BMDM and BMDC were stimulated or left untreated (media) for 48 hours. (K) Mean fluorescence intensity of maturation and activation markers as measured by flow cytometry (n=6–9 per group, three independent experiments). (L) Production of IL-6 and IL-12 measured by ELISA. Data are shown as box-and-whisker plot; the box extends between 25% and 75% and the whiskers extend to the minimum and maximum values, using two way-ANOVA followed by Šidák’s multiple comparisons test (n=4–7 per group, two independent experiments). (M) Protein expression levels of the indicated cytokines and chemokines from tumor lysates on day 12 post tumor injection (24 hours after last treatment). Data are shown as box-and-whisker plots; the box extends between 25% and 75% and the whiskers extend to the minimum and maximum values with a log2 cut-off >2.5, using two way-ANOVA followed by Šidák’s multiple comparisons test (n=10 per group). (N) Gene expression profiles of tumor lysates shown as ordination plots with 80% CI ellipses (n=8 per group). p≤0.05 (*), p≤0.01 (**), p≤0.001 (***), p≤0.0001 (****). ANOVA, analysis of variance; BMDC, bone marrow dendritic cell; BMDM, bone marrow derived microphages; MΦ, macrophage; TME, tumor microenvironment.
Figure 2
Figure 2
Tumoricidal effect of BCG lysate is dependent on TAM and DC. (A) Growth curve of treated and untreated B16F10 melanoma with and without MΦ depletion. Data are represented as mean±SEM using two-way-ANOVA followed by Šidák’s multiple comparisons test (n=12 per group except BCG +anti-CSF1R, n=11; two independent experiments). (B–H) Relative frequencies of cell subsets measured by flow cytometry: (B) CD45+ cells, (C) CD8+ T cells, (D) CD4+ T cells, (E) NKT cells, (F) NK cells, (G) MΦ and (H) DC. (I) BCG lysate-induced fold change of the indicated cytokines and chemokines from tumor lysates on day 12 after tumor injection. Data are shown as box-and-whisker plot; the box extends between 25% and 75% and the whiskers extend to the minimum and maximum values (BCG, n=11; BCG +anti-CSF1R, n=9; two independent experiments). Statistical significance was determined using two way-ANOVA followed by Šidák’s multiple comparisons test. (J) Growth curves of BCG lysate-treated or PBS-treated B16F10 tumors in Batf3–/– mice, represented as mean±SEM using two-way-ANOVA followed by Šidák’s multiple comparisons test (n=12 per group, two independent experiments). (K–O) Relative frequencies of cell subsets measured by flow cytometry: (K) CD45+ cells, (L) CD8+ T cells, (M) CD4+ T cells, (N) NKT cells and (O) NK cells. Data are represented as mean±SD using one-way ANOVA followed by Tukey’s multiple comparisons test (n=12 per group, two independent experiments). p≤0.05 (*), p≤0.01 (**), p≤0.001 (***), p≤0.0001 (****). ANOVA, analysis of variance; DC, dendritic cell; MΦ, macrophage; TAM, tumor-associated microphage.
Figure 3
Figure 3
BCG hydrogel treatment prolonged survival and reduced the formation of lung metastases. (A) Scheme of the experimental set-up. (B, C) Growth curves of treated and contralateral (untreated) tumors. Data are represented as mean±SEM using two-way ANOVA followed by Šidák’s multiple comparisons test (n=12 per group, two independent experiments). (D–G) Relative frequencies of cell subsets measured by flow cytometry in contralateral tumors: (D) CD8+ T cells, (E) CD4+ T cells (F) NKT cells and (G) NK cells. Data are shown as mean±SD using one-way ANOVA, followed by Tukey’s multiple comparisons test (n=12 per group, two independent experiments). (H) Kaplan-Meier survival curves. Significance was determined by log-rank (Mantel-Cox) test (n=12 per group except PBS, n=4). (I) Experimental set-up scheme of lung metastasis model. (J) Representative images of B16F10 lung metastases on day 18 post tumor injection. (K) Visual quantification of the metastatic foci on lung surfaces. Data are represented as mean±SD (n=12 per group, two independent experiments). (L) Representative H&E staining of lung metastases. Black arrows indicate metastatic foci. (M) Growth curve of MC38 tumors treated with intratumoral BCG or BCG hydrogel. (N) Growth curve of tumors after re-challenge with MC38 cells. Data are represented as mean±SEM using two-way-ANOVA followed by Šidák’s multiple comparisons test (PBS, n=10; BCG, n=12; PBS hydrogel, n=6; BCG hydrogel, n=12; two independent experiments). p≤0.05 (*), p≤0.01 (**), p≤0.001 (***), p≤0.0001 (****). ANOVA, analysis of variance.
Figure 4
Figure 4
ScRNA-seq analysis of BCG hydrogel-treated tumors showed enhanced antigen processing and presentation in DC and MΦ. (A) Scheme of experimental workflow. (B, C) Uniform Manifold Approximation and Projection(UMAP) plot demonstrating clustering and cell type identities obtained for both treatment groups. Cluster annotations: B cell, CD4+ T cell, CD8+ T cell, DC, mDC, pDC, MΦ and NK cell. (D) Top 40 differentially upregulated genes between BCG hydrogel-treated and PBS hydrogel-treated tumors within identified cell types. Sorted from highest log2 fold change (top) to lowest (bottom), log2 fold change cut-off=0.25 and false discovery rate (FDR)=0.05. (E, F) Gene ontology analysis of biological processes for genes upregulated in BCG hydrogel-treated versus PBS hydrogel-treated tumors. (E) Pie charts demonstrating percentages of biological processes from upregulated genes and (F) net plots showing the relationships between genes associated with selected GO terms. (G) UMAP plot showing distribution of CTSS expression. (H) Violin plot demonstrating CTSS expression level in distinct cell populations. CTSS, Cathepsin S; DC, dendritic cell, GO, gene ontology; mDC, myeloid DC; MΦ, macrophage; pDC, plasmacytoid DC; scRNA, single-cell RNA.
Figure 5
Figure 5
BCG hydrogel promoted antigen processing and presentation in TDLN. (A, B) UMAP plot demonstrating clustering and cell type identities obtained for both treatment groups. Cluster annotations: APC, DC, NK cell, naive T cell, CD4+ T cell, CD8+ T cell. (C) Bar plot demonstrating proportion of identified cell types across treatment groups. (D) Top 40 differentially upregulated genes between BCG hydrogel and PBS hydrogel treatment groups within identified cell types. Sorted from highest log2 fold change (top) to lowest (bottom), log2 fold change cut-off=0.25 and FDR=0.05. (E, F) GO analysis of biological processes for genes upregulated in BCG hydrogel-treated versus PBS hydrogel-treated TDLN. (E) Pie charts demonstrating percentages of biological processes from upregulated genes and (F) net plots showing the relationships between genes associated with selected GO terms. (G) Venn diagram of BCG hydrogel-induced genes in tumors and TDLN and common genes. (H) Violin plot demonstrating CTSS expression level within cell subsets. APC, antigen-presenting cell; CTSS, Cathepsin S; DC, dendritic cell; GO, gene ontology; TDLN, tumor-draining lymph node.
Figure 6
Figure 6
BCG-induced CTSS activity mediates antigen processing and presentation and is associated with improved survival in patients with melanoma. (A, B) CTSS activity in cell lysates from (A) BMDM and (B) BMDC (n=12–16 per group, two independent experiments). (C, D) Proliferation of OT-I cells co-cultured with BCG-stimulated and OVA-pulsed (C) murine BMDM or (D) BMDC. Data are shown as mean±SD using one-way ANOVA and followed by Tukey’s multiple comparisons test (n=9–12 per group, two independent experiments). (E) CTSS activity in cell lysates from huMo. Data are represented as mean±SD using one-way ANOVA and followed by Tukey’s multiple comparisons test (n=10–13 per group, four individual replicates, two independent experiments). (F, G) Simpson’s index of clonality in (F) tumor and (G) spleen as assessed by TCRß sequencing. (H, I) Shannon index of diversity in (H) tumor and (I) spleen. Data are represented as mean±SD using unpaired, two-tailed Student’s t-test (n=6 per group). (J, K) MDS ordination plots using Morisita-Horn dissimilarity distance metrics of TCR clones in (J) tumor and (K) spleen with 80% CI ellipses. (L, M) Relative frequencies of TRP-2 tetramer-positive CD8+ T cells, as a proportion of total CD8+ T cells in (L) tumor (PBS hydrogel, n=5; BCG hydrogel, n=6) and (M) spleen (n=6 per group). (N–Q) RNA-seq data from punch biopsies of BCG-injected tumors (n=9) and uninjected tumors (n=11) from patients with intransit melanoma cutaneous metastases. (N–P) Signature scores of (N) M1 MΦ, (O) mature DC and (P) antigen presentation pathway (KEGG) in BCG-injected and uninjected lesions. (Q) CTSS expression of BCG-injected and uninjected nodules shown as normalized, log2 transformed counts. Data are shown as box-and-whisker plots using two-tailed Student’s t-test. The box extends between 25% and 75%, and the whiskers extend to the minimum and maximum. (R) Kaplan-Meier survival curves for CTSShigh and CTSSlow SKCM patients (overall survival). p≤0.05 (*), p≤0.01 (**), p≤0.001 (***), p≤0.0001 (****). ANOVA, analysis of variance; BMDC, bone marrow dendritic cell; BMDM, bone marrow derived macrophage; CTSS, Cathepsin S; DC, dendritic cell; huMo, human monocytes; MDS, multidimensional scaling; MΦ, macrophage; SKCM, skin cutaneous melanoma; TCR, T cell receptor; TRP, tyrosinase-related protein.

References

    1. Karimkhani C, Green AC, Nijsten T, et al. . The global burden of melanoma: results from the global burden of disease study 2015. Br J Dermatol 2017;177:134–40. 10.1111/bjd.15510 - DOI - PMC - PubMed
    1. Sharma P, Hu-Lieskovan S, Wargo JA, et al. . Primary, adaptive, and acquired resistance to cancer immunotherapy. Cell 2017;168:707–23. 10.1016/j.cell.2017.01.017 - DOI - PMC - PubMed
    1. Benitez MLR, Bender CB, Oliveira TL, et al. . Mycobacterium bovis BCG in metastatic melanoma therapy. Appl Microbiol Biotechnol 2019;103:7903–16. 10.1007/s00253-019-10057-0 - DOI - PubMed
    1. Kremenovic M, Schenk M, Lee DJ. Clinical and molecular insights into BCG immunotherapy for melanoma. J Intern Med 2020;288:625–40. 10.1111/joim.13037 - DOI - PubMed
    1. Azuma I, Ribi EE, Meyer TJ, et al. . Biologically active components from mycobacterial cell walls. I. Isolation and composition of cell wall skeleton and component P3. J Natl Cancer Inst 1974;52:95–101. 10.1093/jnci/52.1.95 - DOI - PubMed

Publication types