. 2022 Jul 27;42(30):5944-5955.
doi: 10.1523/JNEUROSCI.2129-21.2022. Epub 2022 Jun 22.

Exploring Information Flow from Posteromedial Cortex during Visuospatial Working Memory: A Magnetoencephalography Study

Affiliations

Exploring Information Flow from Posteromedial Cortex during Visuospatial Working Memory: A Magnetoencephalography Study

Erin Goddard et al. J Neurosci. .

Abstract

The posteromedial cortex (PMC) is a major hub of the brain's default mode network, and is implicated in a broad range of internally driven cognitions, including visuospatial working memory. However, its precise contribution to these cognitive processes remains unclear. Using MEG, we measured PMC activity in healthy human participants (young adults of both sexes) while they performed a visuospatial working memory task. Multivariate pattern classification analyses revealed stimulus-related information during encoding and retrieval in a set of a priori defined cortical ROIs, including prefrontal, occipital, and ventrotemporal cortices, in addition to PMC. We measured the extent to which this stimulus information was exchanged between areas in an information flow analysis, measuring Granger-causal relationships between areas over time. Consistent with the visual nature of the task, information from occipital cortex shaped other regions across most epochs. However, the PMC shaped object representations in occipital and prefrontal cortices during visuospatial working memory, influencing occipital cortex during retrieval and PFC across all task epochs. Our findings are consistent with a proposed role for the PMC in the representation of internal content, including remembered information, and in the comparison of external stimuli with remembered material.SIGNIFICANCE STATEMENT The human brain operates as a collection of highly interconnected regions. Mapping the function of this interconnectivity, as well as the specializations within different regions, is central to understanding the neural processes underlying cognition. The posteromedial cortex (PMC) is a highly connected cortical region, implicated in visuospatial working memory, although its precise contribution remains unclear. We measured the activity of PMC during a visuospatial working memory task, testing how different regions represented the stimuli, and whether these representations were driven by other cortical regions. We found that PMC influenced stimulus information in other regions across all task phases, suggesting that PMC plays a key role in shaping stimulus representations during visuospatial working memory.

Keywords: MEG; episodic memory; information flow analysis; posterior cingulate cortex; visuospatial memory.


Figures

Figure 1.
Figure 1.
Stimuli and participant's task. In the visuospatial memory task, each stimulus was 1 of 8 abstract images (A) at 1 of 9 locations (B). On each trial, the participant was presented with 4 stimuli, serially presented, that were to be encoded in memory, followed by a dynamic noise screen for 800 ms (maintenance period) and then a single retrieval stimulus (C). The participant then responded via keypress whether the retrieval stimulus was present in the encoding stimulus set.
Figure 2.
Figure 2.
Behavioral performance. A, Illustration of a single participant's data (blue line) with fitted psychometric function, showing fitted point of 75% correct (235 ms). Error bars indicate 95% CIs on the average performance across trials. B, Each participant's performance in the MEG experiment against the encoding stimulus duration. Red dashed line indicates target value of 75% correct.
Figure 3.
Figure 3.
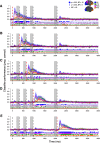
Classifier performance decoding item location, for each of the 4 encoding items (A–D) and the retrieval item (E), for each ROI. Shaded error bars indicate 95% CIs of the between subject mean (n = 11). Shaded gray distribution represents the 95% CIs of a bootstrapped null distribution (see Materials and Methods). Vertical dashed lines indicate the onsets of each stimulus, with the stimulus being decoded highlighted in red in each plot. Shaded regions of the plot represent times where the data are averaged across <11 participants because of the individualized stimulus durations (see Materials and Methods). Dots along the 4 colored lines below the x axis represent the statistical results for the data from each ROI. In each case, colored dots above the line represent times where the mean was significantly greater than the bootstrapped null distribution (FDR-corrected, q < 0.05), and there was a moderate or strong effect indicated by the BF (BF > 3, small dots, or BF > 10, large dots, respectively). Small gray dots below each line represent times at which there was at least moderate evidence against the presence of above-chance decoding (BF < 1/3). Top right, Legend shows each ROI as a shaded region on an uninflated cortical surface from a medial (top) and lateral (bottom) view.
Figure 4.
Figure 4.
Classifier performance decoding item identity, for each of the 4 encoding items (A–D) and the retrieval item (E), for each ROI. Plotting conventions as in Figure 3.
Figure 5.
Figure 5.
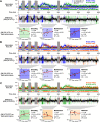
IFA between PMC (magenta) and occipital (A, blue), ventrotemporal (B, green), and frontal (C, orange) cortices. In each case, the uppermost plot represents the information flow to and from PMC to the other area, and the middle plot represents the difference between these information flows. The background of the plot is colored according to the dominant information flow (e.g., darkest magenta represents times of strongest bias from PMC to the other area). Dots below the uppermost plots, and above and below the middle plots represent the BF results. Vertical dashed red lines indicate the onsets of each stimulus; for each time sample, information flow was calculated using classifier decoding of only the most recent stimulus. Shaded regions of the plot represent times where there were data for <11 participants because of the individualized stimulus durations (see Materials and Methods). In the bottom part of each plot, the scatter plots represent the relationship between participant's performance on the task (d′) and the information flow bias (Diff). For each participant, we calculated their average Diff value by averaging across time samples within the epoch where there was at least a moderate effect (BF > 3) of information flow in at least one direction between the pair (i.e., time samples with at least one colored dot in the uppermost plot). Each scatterplot includes a line of best fit (in red); and beside each correlation plot, the correlation value (Pearson's r) is given, along with the range of the central 95% of null r values, and the p value derived from this null distribution (none of these survived FDR correction at q < 0.05). Backgrounds of the scatter plots are colored according to the slope of the line of best fit (e.g., darkest magenta represents the strongest positive relationship between participant performance and information flow from PMC).
Figure 6.
Figure 6.
IFA between remaining cortices (excluding PMC). IFA between occipital and ventrotemporal cortices (A), occipital and frontal cortices (B), and ventrotemporal and frontal cortices (C). Plotting conventions are as in Figure 5.

References

    1. Andrews-Hanna JR (2012) The brain's default network and its adaptive role in internal mentation. Neuroscientist 18:251–270. 10.1177/1073858411403316 - DOI - PMC - PubMed
    1. Benjamini Y, Hochberg Y (1995) Controlling the false discovery rate: a practical and powerful approach to multiple testing. J R Stat Soc Ser B Methodol 57:289–300. 10.1111/j.2517-6161.1995.tb02031.x - DOI
    1. Bird CM, Keidel JL, Ing LP, Horner AJ, Burgess N (2015) Consolidation of complex events via reinstatement in posterior cingulate cortex. J Neurosci 35:14426–14434. 10.1523/JNEUROSCI.1774-15.2015 - DOI - PMC - PubMed
    1. Bocincova A, Johnson JS (2019) The time course of encoding and maintenance of task-relevant versus irrelevant object features in working memory. Cortex 111:196–209. 10.1016/j.cortex.2018.10.013 - DOI - PMC - PubMed
    1. Brainard DH (1997) The Psychophysics Toolbox. Spat Vis 10:433–436. 10.1163/156856897X00357 - DOI - PubMed

Publication types

LinkOut - more resources