. 2022 Jul 27;42(30):5843-5859.
doi: 10.1523/JNEUROSCI.2475-21.2022. Epub 2022 Jun 22.

Corticotropin Releasing Factor Mediates KCa3.1 Inhibition, Hyperexcitability, and Seizures in Acquired Epilepsy

Affiliations

Corticotropin Releasing Factor Mediates KCa3.1 Inhibition, Hyperexcitability, and Seizures in Acquired Epilepsy

Manindra Nath Tiwari et al. J Neurosci. .

Abstract

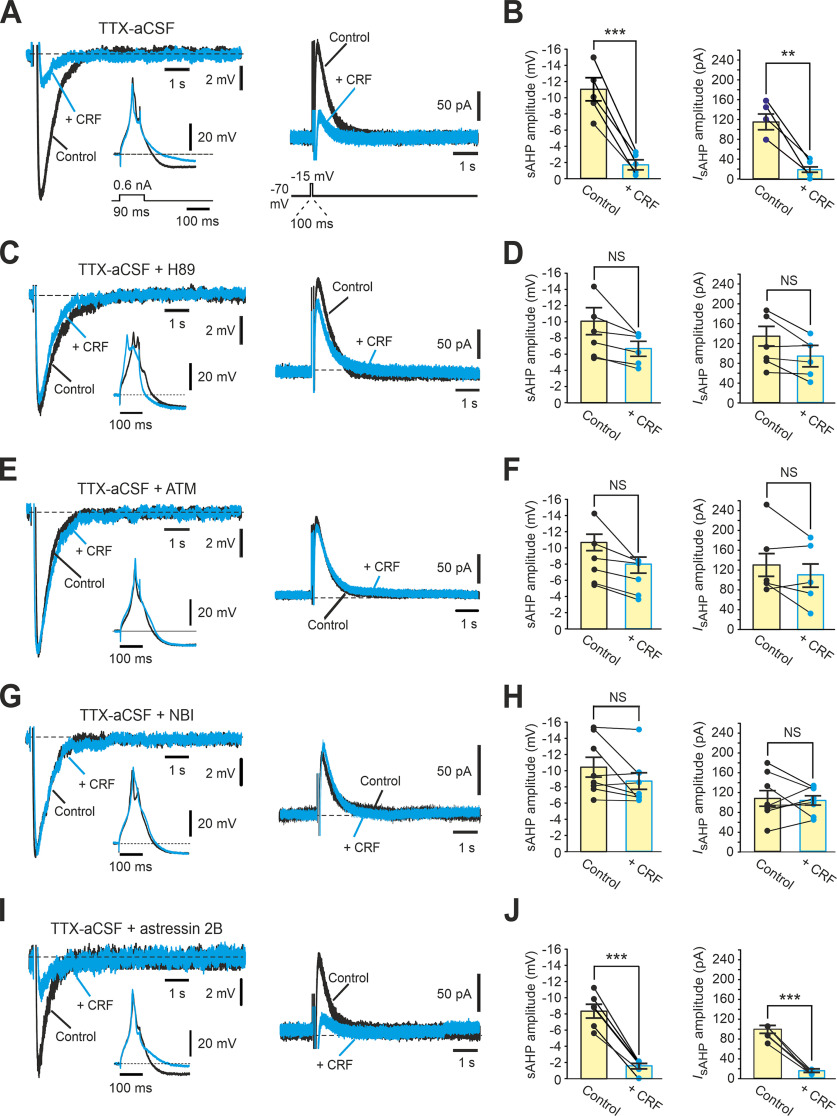
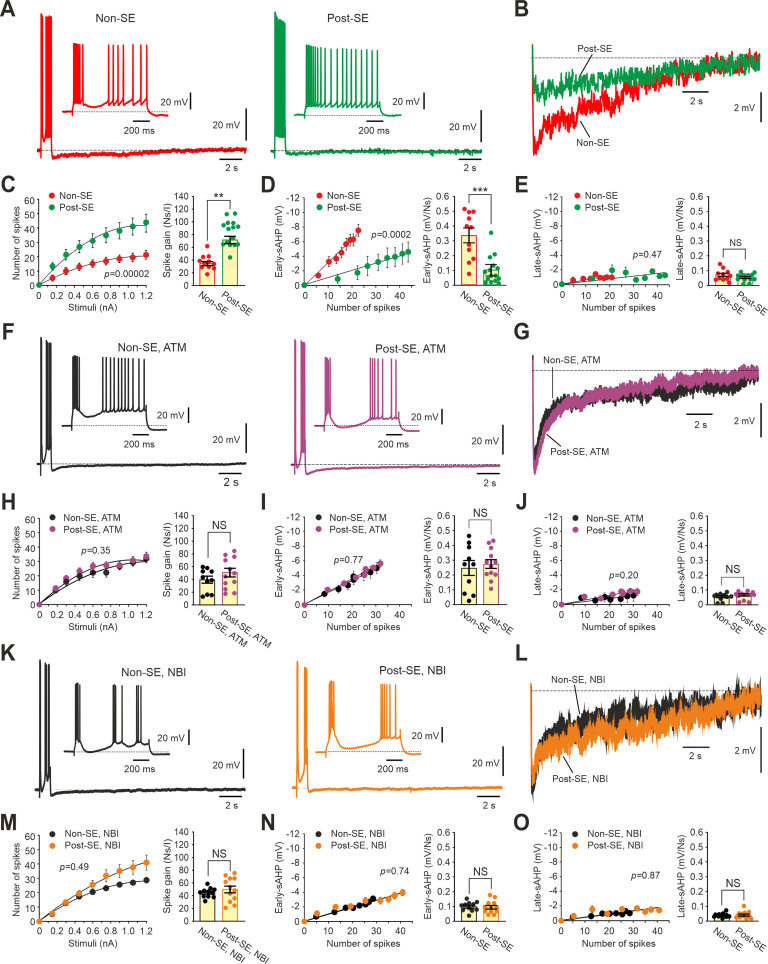
Temporal lobe epilepsy (TLE), the most common focal seizure disorder in adults, can be instigated in experimental animals by convulsant-induced status epilepticus (SE). Principal hippocampal neurons from SE-experienced epileptic male rats (post-SE neurons) display markedly augmented spike output compared with neurons from nonepileptic animals (non-SE neurons). This enhanced firing results from a cAMP-dependent protein kinase A-mediated inhibition of KCa3.1, a subclass of Ca2+-gated K+ channels generating the slow afterhyperpolarizing Ca2+-gated K+ current (IsAHP). The inhibition of KCa3.1 in post-SE neurons leads to a marked reduction in amplitude of the IsAHP that evolves during repetitive firing, as well as in amplitude of the associated Ca2+-dependent component of the slow afterhyperpolarization potential (KCa-sAHP). Here we show that KCa3.1 inhibition in post-SE neurons is induced by corticotropin releasing factor (CRF) through its Type 1 receptor (CRF1R). Acute application of CRF1R antagonists restores KCa3.1 activity in post-SE neurons, normalizing KCa-sAHP/IsAHP amplitudes and neuronal spike output, without affecting these variables in non-SE neurons. Moreover, pharmacological antagonism of CRF1Rs in vivo reduces the frequency of spontaneous recurrent seizures in post-SE chronically epileptic rats. These findings may provide a new vista for treating TLE.SIGNIFICANCE STATEMENT Epilepsy, a common neurologic disorder, often develops following a brain insult. Identifying key cellular mechanisms underlying acquired epilepsy is critical for developing effective antiepileptic therapies. In an experimental model of acquired epilepsy, principal hippocampal neurons manifest hyperexcitability because of downregulation of KCa3.1, a subtype of Ca2+-gated K+ ion channels. We show that KCa3.1 downregulation is mediated by corticotropin releasing factor (CRF) acting through its Type 1 receptor (CRF1R). Congruently, acute application of selective CRF1R antagonists restores KCa3.1 channel activity, leading to normalization of neuronal excitability. In the same model, injection of a CRF1R antagonist to epileptic animals markedly decreases the frequency of electrographic seizures. Therefore, targeting CRF1Rs may provide a new strategy in the treatment of acquired epilepsy.

Keywords: CRF; KCa3.1; channelopathy; hippocampus; intrinsic excitability; temporal lobe epilepsy.


Figures

Figure 1.
Figure 1.
CRF increases spike output while suppressing the early-sAHP phase of the dual-component sAHP in ordinary CA1 pyramidal cells. A, Representative traces represent at two time scales the firing of a CA1 pyramidal cells stimulated by a 1-s-long depolarizing current pulses (0.3 nA) before (Control) and after application of 250 nm CRF (+ CRF). B, Overlaid enlarged traces of the sAHPs shown in A. Arrows indicate the time points used to measure the early- and slow-sAHP amplitudes (1 and 7 s after stimulus offset, respectively). C, The neurons were stimulated by a series of 1-s-long pulses, increasing in amplitudes (I) from 0 to 1.2 nA in steps of 150 pA. The summary plots depict the number of evoked spikes (Ns) as a function of stimulus intensity (I) before (Control) and after CRF application (+ CRF). Bar diagram represents the spike response gains (Ns/I) in the two conditions (n = 9). The gain is significantly increased by CRF. D, Same experiments as in C. Summary plots of early-sAHP amplitudes versus Ns. Bar diagram represents the early sAHP/Ns slopes before (Control) and after CRF application (+ CRF). The early-sAHP/Ns slope is significantly decreased by CRF. E, Same as in D, but the summary plot and bar diagram represent the late-sAHP amplitudes and late-sAHP/Ns slopes (n = 9). The late-sAHP/Ns slope is not affected by CRF. Data are mean ± SEM. **p < 0.01. NS, not significant.
Figure 2.
Figure 2.
CRF suppresses the early, Ca2+-dependent, sAHP phase of the dual-component sAHP in ordinary CA1 pyramidal cells. A, A representative dual-component sAHP evoked by a stereotyped spike train stimulus (150 spikes at 50 Hz, for 3 s). The time points used to measure the early- and slow-sAHP amplitudes, as well as the “area under the curve” (integral) are depicted. B, Representative overlaid traces of dual-component sAHPs evoked before (Control) and after CRF application (+ CRF). C, Summary bar diagrams represent the early- and late-sAHP amplitudes, as well as the sAHP area, in the two conditions (n = 8). The early-sAHP amplitudes and the sAHP areas are significantly suppressed by CRF, but the late-sAHP amplitudes are unaffected. D, Same as in B, but the sAHPs were evoked in Cd+Ni-aCSF to block the KCa-sAHP component. E, same as in C, but bar diagrams apply to the experiments in Cd+Ni-aCSF (n = 5). In this condition, the sAHPs were unaffected by CRF. Data are mean ± SEM. *p < 0.05. **p < 0.01. NS, not significant.
Figure 3.
Figure 3.
CRF suppresses KCa-sAHP/IsAHP via CRF1R and PKA in CA1 pyramidal cells. A, The effect of CRF on KCa-sAHP/IsAHP in a representative ordinary neuron. Left, Overlaid traces of KCa-sAHPs before (black) and after application of 250 nm CRF (blue). Inset, The respective Ca2+ spikes generating the sAHPs (evoked, here and below, by 90-ms-long 0.6 nA depolarizing current pulses). Right, The overlaid traces represent the IsAHPs in the same neuron (evoked, here and below, by 100-ms-long depolarizing pulses to −15 mV from a holding potential of −70 mV) before (black) and after CRF application (blue). The KCa-sAHP and the IsAHP are markedly suppressed by CRF, while the Ca2+ spike is unaffected. B, Summary bar diagrams represent the suppressant effect of CRF on KCa-sAHP and IsAHP amplitudes in ordinary neurons (n = 5). C, Same as in A, but CRF was applied to slices treated with 10 μm H89, which prevented KCa-sAHP/IsAHP suppression. D, Summary bar diagrams represent the null effect of CRF on KCa-sAHP and IsAHP amplitudes in ordinary neurons in H89-treated slices (n = 6). E, Same as in A, but CRF was applied to slices treated with 1 μm ATM, which prevented KCa-sAHP/IsAHP suppression. F, Summary bar diagrams represent the null effect of CRF on KCa-sAHP (n = 6) and IsAHP amplitudes (n = 5) in ordinary neurons in ATM-treated slices. G, Same as in A, but CRF was applied to slices treated with 1 μm NBI27914, which prevented KCa-sAHP/IsAHP suppression. H, Summary bar diagrams represent the null effect of CRF on KCa-sAHP and IsAHP amplitudes in ordinary neurons in NBI27914-treated slices (n = 8). I, Same as in A, but CRF was applied to slices treated with 250 nm astressin 2B, which did not prevent KCa-sAHP/IsAHP suppression. J, Summary bar diagrams represent the suppressant effect of CRF on KCa-sAHP and IsAHP amplitudes in ordinary neurons in astressin 2B-treated slices (n = 6). Data are mean ± SEM. **p < 0.01. ***p < 0.001. NS, not significant.
Figure 4.
Figure 4.
Upregulation of CRF/CRF1R protein expression in epileptogenesis accounts for KCa-sAHP/IsAHP suppression in post-SE neurons and occludes the action of exogenous CRF. A, Summary bar diagram represents CRF protein expression measured by ELISA in hippocampal tissue of non-SE and post-SE rats (5 rats in each group). CRF expression is significantly upregulated in the latter group. B, Left, Representative Western blots of CRF1R protein (47 kDa) and GAPDH protein (serving as control; 37 kDa) obtained from hippocampal tissue of non-SE and post-SE rats. Note higher band density of CRF1R protein in post-SE hippocampal tissue. Right, Summary bar diagram represents the CRF1R/GAPDH band density ratios in non-SE (8 rats) and post-SE hippocampal tissues (8 rats). The ratio is significantly higher in the post-SE tissue, indicating significant CRF1R protein upregulation. C, Summary bar diagrams comparing KCa-sAHP amplitudes (left) and IsAHP amplitudes (right) in non-SE versus post-SE neurons. D, The effect of CRF on a representative non-SE neuron. Left, Overlaid traces of KCa-sAHPs before (red) and after application of 250 nm CRF (blue). Inset, The respective Ca2+ spikes generating the sAHPs. Right, The overlaid traces represent the IsAHPs in the same neuron before (red) and after CRF application (blue). The KCa-sAHP and the IsAHP are markedly suppressed by CRF, while the Ca2+ spike is unaffected. E, Summary bar diagrams represent the suppressant effect of CRF on KCa-sAHP (n = 5) and IsAHP amplitudes (n = 5) in non-SE neurons (n = 5). F, Same as in D, but CRF was applied to post-SE neurons. The control KCa-sAHP/IsAHP amplitudes (green) are smaller than in non-SE neurons because of epileptogenesis, occluding the effect of exogenous CRF (blue). G, Summary bar diagrams represent the lack of additional effect of CRF on KCa-sAHP and IsAHP amplitudes in post-SE neurons (n = 5). Data are mean ± SEM. ***p < 0.001. NS, not significant.
Figure 5.
Figure 5.
CRF1R antagonists restore KCa-sAHP/IsAHP in post-SE neurons. A, The KCa-sAHP (left) and the IsAHP (right) recorded in representative non-SE (top traces, black) and post-SE neurons (bottom traces, violet) in slices treated with 1 μm ATM. Insets, The Ca2+ spikes evoking the KCa-sAHP. B, Summary bar diagrams of KCa-sAHP (top) and IsAHP amplitudes (bottom) recorded in non-SE (n = 12 and n = 12, respectively) and post-SE neurons (n = 13 and n = 11, respectively) in ATM-treated slices. In both diagrams, the amplitudes in post-SE neurons are significantly smaller than in non-SE nears, implying only a partial KCa-sAHP/IsAHP restoration by ATM. C, Same as in A, but for neurons recorded in slices treated with 1 μm NBI. D, Summary bar diagrams KCa-sAHP (top) and IsAHP amplitudes (bottom) recorded in non-SE (n = 9 and n = 9, respectively) and post-SE neurons (n = 14 and n = 13, respectively) in NBI-treated slices. In both diagrams, the KCa-sAHP/IsAHP amplitudes recorded in non-SE and post-SE neurons are the same, implying a complete KCa-sAHP/IsAHP restoration by NBI. E, Summary bar diagrams of KCa-sAHP (left) and IsAHP amplitudes (right) recorded in non-SE neurons in untreated (n = 25 and n = 20, respectively), in ATM-treated (n = 12 in both) and in NBI-treated slices (n = 9 in both). NBI, but not ATM, significantly reduces IsAHP amplitudes in non-SE neurons. F, Summary bar diagrams of KCa-sAHP (left) and IsAHP amplitudes (right) recorded in post-SE neurons in untreated (n = 22 and n = 20, respectively), in ATM-treated (n = 13 and n = 11, respectively) and in NBI-treated slices (n = 14 and n = 13, respectively). Application of either ATM or NBI significantly restores KCa-sAHP/IsAHP in post-SE neurons. Data are mean ± SEM. *p < 0.05. **p < 0.01. ***p < 0.001. NS, not significant.
Figure 6.
Figure 6.
TRAM-34 similarly suppresses native KCa-sAHP/IsAHP in non-SE neurons and restored KCa-sAHP/IsAHP in post-SE neurons. A, The effect of TRAM-34 on native KCa-sAHP/IsAHP in a representative non-SE neuron in slices treated with 1 μm ATM. Left, Overlaid traces of KCa-sAHPs before (black) and after application of 5 μm TRAM-34 (gray). The respective Ca2+ spikes generating the sAHPs are shown in the inset. Right, The overlaid traces represent the IsAHPs in the same neuron before (black) and after TRAM-34 application (gray). The KCa-sAHP and the IsAHP are markedly suppressed by TRAM-34, while the Ca2+ spike is unaffected. B, Summary bar diagrams represent the suppressant effect of TRAM-34 on native KCa-sAHP and IsAHP amplitudes in ATM-treated non-SE neurons (n = 6). C, Same as in A, but TRAM-34 was applied to ATM-treated post-SE slices. The restored KCa-sAHPs and IsAHPs (violet traces) were suppressed by TRAM-34 (gray traces). D, Summary bar diagrams represent the suppressant effect of CRF on restored KCa-sAHP and IsAHP amplitudes in ATM-treated post-SE slices (n = 6). E, Same as in A, but TRAM-34 was applied to non-SE slices treated with 1 μm NBI. The native KCa-sAHPs and IsAHPs (blue traces) were suppressed by TRAM-34 (gray traces). F, Summary bar diagrams represent the suppressant effect of CRF on native KCa-sAHP and IsAHP amplitudes in NBI-treated post-SE slices (n = 6). G, Same as in A, but TRAM-34 was applied to NBI-treated post-SE slices. The restored KCa-sAHPs and IsAHPs (orange traces) were suppressed by TRAM-34 (gray traces). H, Summary bar diagrams represent the suppressant effect of CRF on restored KCa-sAHP and IsAHP amplitudes in NBI-treated post-SE slices (n = 7). **p < 0.01. ***p < 0.001.
Figure 7.
Figure 7.
CRF1R antagonists restore the early-sAHP component of dual-component sAHPs evoked by stereotyped spike-trains in post-SE neurons. A, The dual-component sAHPs (evoked by a train of 150 spikes, 50 Hz) recorded in representative non-SE (top trace, red) and post-SE neurons (bottom trace, green). B, Summary bar diagrams comparing (from left to right) the amplitudes of the early-sAHP, the late-sAHP, and the sAHP area, in untreated non-SE (n = 27) and post-SE neurons (n = 37). The early-sAHPs in post-SE neurons are smaller in amplitude than their non-SE counterparts. C, Same as in A, but for neurons recorded in slices treated with 1 μm ATM. D, Same as in B, but for non-SE (n = 10) and post-SE neurons (n = 15) in ATM-treated slices. The early-sAHP is normalized by ATM. E, Same as in A, but for neurons recorded in slices treated with 1 μm NBI. F, Same as in B, but for non-SE (n = 15) and post-SE neurons (n = 12) in NBI-treated slices. The early-sAHP is normalized by NBI. ***p < 0.001. NS, not significant.
Figure 8.
Figure 8.
CRF1R antagonists normalize the excitability of post-SE neurons while restoring early-sAHP. A, Representative traces depict at two time scales the firing of a non-SE (left) and a post-SE CA1 pyramidal cell (right) stimulated by a 1-s-long depolarizing current pulse (0.3 nA). B, Overlaid enlarged traces of the sAHPs generated by the non-SE (red) and post-SE (green) neurons shown in A. C, Summary plots represent the number of evoked spikes (Ns) as a function of stimulation intensity (I) in non-SE (n = 11) and post-SE neurons (n = 15). Bar diagram represents the spike response gains (Ns/I) in the two groups of neurons. The gain is significantly larger in the post-SE than in the non-SE neurons. D, Summary plots of early-sAHP amplitudes versus the number of spikes evoked by the depolarizing current pulses in the non-SE and post-SE neurons. Bar diagram represents the early-sAHP/Ns slopes in the two groups of neurons. The smaller early-sAHP/Ns slope in post-SE than in non-SE neurons implies that the early-sAHP is smaller in the former neurons. E, Summary plots of late-sAHP amplitudes versus the number of spikes evoked by the depolarizing current pulses in the non-SE and post-SE neurons. Bar diagram represents the slow-sAHP/Ns slopes in the two groups of neurons. The two groups of neurons do not differ in late-sAHP amplitudes. F-J, Same as in A-E, but for non-SE (n = 10) and post-SE neurons (n = 12) in slices treated with 1 μm ATM. In this condition, the spike response gains and early-sAHP amplitudes in post-SE neurons resemble those of non-SE neurons. K-O, Same as in A-E, but for non-SE (n = 11) and post-SE neurons (n = 12) in slices treated with 1 μm NBI. In this condition also, the spike response gains and early-sAHP amplitudes in post-SE neurons resemble those of non-SE neurons. **p < 0.01. ***p < 0.001. NS, not significant
Figure 9.
Figure 9.
The CRF1Rs antagonist ATM reduces SRSs frequency in post-SE rats. The SRSs were monitored in post-SE rats using continuous telemetric EEG recordings 24 h before and 24 h after injecting the vehicle alone (DMSO) or the vehicle containing ATM (20 mg/kg i.p.). A, Representative electrographic SRSs recoded before and after vehicle injection in 2 post-SE rats. B, Same as in A, but examples drawn from ATM-injected post-SE rats. C, A heat map describing the frequency per hour of SRSs during each of the 48 h of recording for each rat injected either with the vehicle (Rats 1-6) or with ATM (Rats a-g). It is evident that all and only ATM-injected rats display a reduction in SRSs frequency lasting several hours after injection. D, Left, Summary plot displaying the average SRSs frequencies in the 6 vehicle-injected rats throughout the 48-h-long recording period. Arrow indicates the time of injection. Each point represents the average frequency of SRSs detected during a bin of 1 h, normalized to the average hourly frequency of SRSs detected in all rats during the 24 h before injection (mean fb; dashed line). Also depicted is the average hourly frequency of SRSs detected in all rats during the 24 h after injection (mean fa; dotted line). Right, Summary bar diagram showing the fb and fa values for each rat. The mean fb and fa do not differ significantly. E, Same as in D, but for the 7 ATM-injected rats. The mean fa is significantly small than the mean fb. **p < 0.01. NS, not significant.

References

    1. Aldenhoff JB, Gruol DL, Rivier J, Vale W, Siggins GR (1983) Corticotropin releasing factor decreases postburst hyperpolarizations and excites hippocampal neurons. Science 221:875–877. 10.1126/science.6603658 - DOI - PubMed
    1. Azouz R, Jensen MS, Yaari Y (1994) Muscarinic modulation of intrinsic burst firing in rat hippocampal neurons. Eur J Neurosci 6:961–966. 10.1111/j.1460-9568.1994.tb00590.x - DOI - PubMed
    1. Baram TZ, Schultz L (1991) Corticotropin-releasing hormone is a rapid and potent convulsant in the infant rat. Brain Res Dev Brain Res 61:97–101. 10.1016/0165-3806(91)90118-3 - DOI - PMC - PubMed
    1. Basu T, Maguire J, Salpekar JA (2021) Hypothalamic-pituitary-adrenal axis targets for the treatment of epilepsy. Neurosci Lett 746:135618. - PubMed
    1. Becker AJ (2018) Review: animal models of acquired epilepsy: insights into mechanisms of human epileptogenesis. Neuropathol Appl Neurobiol 44:112–129. 10.1111/nan.12451 - DOI - PubMed

Publication types

MeSH terms

Substances