. 2022 Jun 22;8(1):79.
doi: 10.1038/s41531-022-00341-8.

Longitudinal trimodal imaging of midbrain-associated network degeneration in Parkinson's disease

Affiliations

Longitudinal trimodal imaging of midbrain-associated network degeneration in Parkinson's disease

Kenan Steidel et al. NPJ Parkinsons Dis. .

Abstract

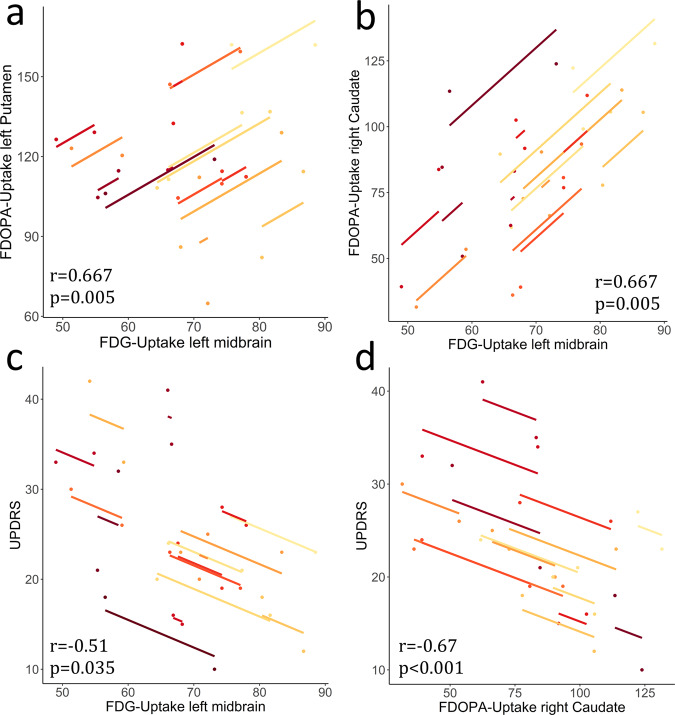
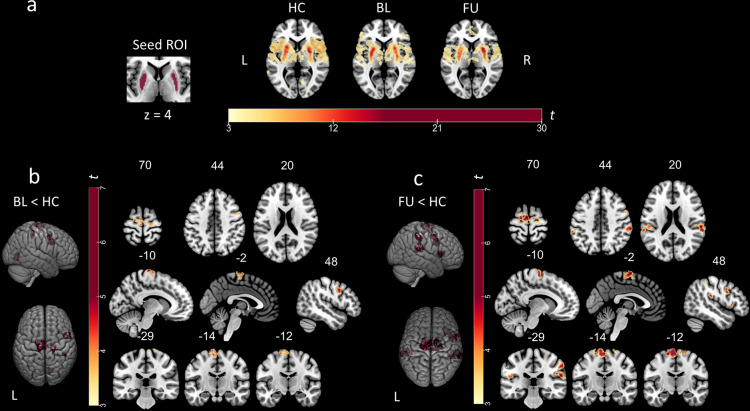
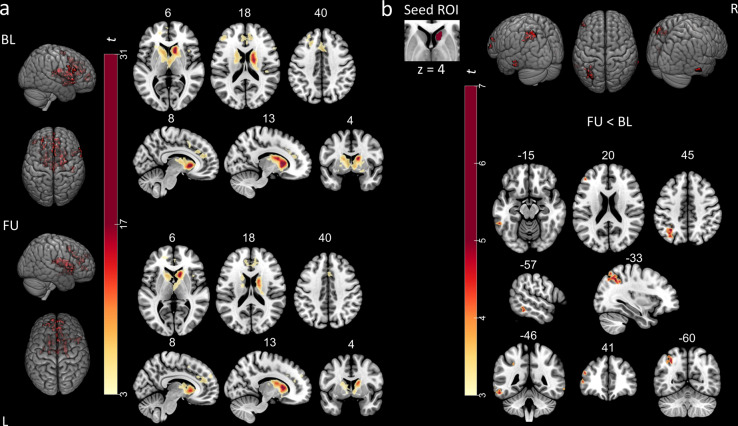
The prevailing network perspective of Parkinson's disease (PD) emerges not least from the ascending neuropathology traceable in histological studies. However, whether longitudinal in vivo correlates of network degeneration in PD can be observed remains unresolved. Here, we applied a trimodal imaging protocol combining 18F-fluorodeoxyglucose (FDG)- and 18F-fluoro-L-Dopa- (FDOPA)-PET with resting-state functional MRI to assess longitudinal changes in midbrain metabolism, striatal dopamine depletion and striatocortical dysconnectivity in 17 well-characterized PD patients. Whole-brain (un)paired-t-tests with focus on midbrain or striatum were performed between visits and in relation to 14 healthy controls (HC) in PET modalities. Resulting clusters of FDOPA-PET comparisons provided volumes for seed-based functional connectivity (FC) analyses between visits and in relation to HC. FDG metabolism in the left midbrain decreased compared to baseline along with caudatal FDOPA-uptake. This caudate cluster exhibited a longitudinal FC decrease to sensorimotor and frontal areas. Compared to healthy subjects, dopamine-depleted putamina indicated stronger decline in striatocortical FC at follow-up with respect to baseline. Increasing nigrostriatal deficits and striatocortical decoupling were associated with deterioration in motor scores between visits in repeated-measures correlations. In summary, our results demonstrate the feasibility of in-vivo tracking of progressive network degeneration using a multimodal imaging approach. Specifically, our data suggest advancing striatal and widespread striatocortical dysfunction via an anterior-posterior gradient originating from a hypometabolic midbrain cluster within a well-characterized and only mild to moderately affected PD cohort during a relatively short period.


Conflict of interest statement

The authors declare no competing interests.

Figures

Fig. 1
Fig. 1. Between-group differences in FDG and FDOPA uptake versus healthy controls.
T-maps were generated in SPM12 by voxel-vise t-tests with the above displayed contrasts. a Patients with Parkinson’s disease showed FDG hypometabolism at baseline and follow-up visit in comparison to healthy controls. Extracted normalized FDG uptake (b) and FDOPA uptake (d) values from respective clusters (FU < HC) are shown as boxplots with individual data points in a direct comparison between baseline, follow-up, and healthy controls (*p < 0.05, **p < 0.01, ***p < 0.001, ****p < 0.0001, central line = median, bounds of box = 25th to 75th percentile, whiskers = smallest to highest value within 1.5 times interquartile range below 25th percentile respectively above 75th percentile). c Patients exhibited dopaminergic deficits in the bilateral posterior putamen compared to healthy controls at both visits. Results are shown at pFWE < 0.05 cluster-level corrected using SVC for a midbrain (a) or striatum (c) ROI. T-values of resulting clusters are indicated by the colorbar. Boxplots contain extracted normalized FDG and FDOPA values with proportional scaling. BL = baseline, FU = follow up, HC = healthy controls, PUTl = left putamen, PUTr = right putamen, CAUr = right caudate nucleus.
Fig. 2
Fig. 2. Direct comparison of FDG and FDOPA uptake between follow-up and baseline.
Patients showed significantly reduced FDG uptake in the left midbrain (a) and significantly reduced FDOPA uptake in the right caudate (c) at follow-up visits compared to baseline. Both clusters are displayed in binarized form. Results were obtained by applying the above stated contrasts, thresholded at pFWE < 0.05 cluster-level corrected with SVC for midbrain (a) or striatum (c), respectively. Progression plots show the decrement of tracer uptakes between both visits for each patient individually for left midbrain FDG uptake (b) and right caudate FDOPA uptake (d). Progression plots contain extracted normalized FDG and FDOPA values with proportional scaling. BL = baseline, FU = follow up, HC = healthy controls.
Fig. 3
Fig. 3. Repeated measure correlations between changes in FDG or FDOPA uptake and clinical deterioration.
Rmcorr plots indicating a significantly associated decline in tracer uptake of midbrain and striatal clusters. Each colored dot represents one of the two separate variables of normalized tracer uptake (proportional scaling) for a patient; observations from the same patient are similarly colored. The corresponding lines represent the rmcorr fit for each participant. Positive slopes indicate a positive linear correlation and vice versa. a Concomitance in progression of hypometabolism in left midbrain and dopaminergic deficit of the left putamen (r = 0.667, p = 0.005) and b likewise, between left midbrain and right caudate (r = 0.667, p = 0.005). Correlation between worsening in UPDRS-III OFF and changes in glucose metabolism in left midbrain (c) (r = −0.51, p = 0.035) and d increasing dopaminergic deficiency of the right caudate (r = −0.67, p < 0.001).
Fig. 4
Fig. 4. Within- and between-group striatocortical functional connectivity of dopamine-depleted putamina.
Top: a Putaminal seed-to-voxel functional connectivity maps of healthy controls and patients with PD at baseline and follow-up visit. Scaled colorbar indicates t-values. b Bottom left: Significant differences in putaminal functional connectivity between healthy controls and patients at baseline visit. Bottom right: Significant differences in putaminal functional connectivity between healthy controls and patients at follow-up visit. Study-specific seed ROIs were provided by clusters derived from the FDOPA-PET comparison (FU < HC). SPM t-maps are overlaid on a T1 MNI template. All results were thresholded at pFWE < 0.05 cluster level. The numbers above the slices represent MNI x-, y-, or z-coordinates, respectively.
Fig. 5
Fig. 5. Direct comparison of caudato-cortical functional connectivity between follow-up and baseline.
a Caudatal seed-to-voxel functional connectivity maps of patients with PD at baseline (top) and follow-up visit (bottom). Scaled colorbar indicates t-values. All results were thresholded at pFWE < 0.05 cluster level. b Significant differences in caudatal functional connectivity between patients at baseline and follow-up visit. Study-specific seed ROI was provided by the cluster derived from the FDOPA-PET comparison (FU < BL) SPM t-maps are overlaid on a T1 MNI template. All results were thresholded at pFWE < 0.05 or pFDR < 0.05 cluster level, respectively. The numbers above the slices represent MNI x-, y-, or z-coordinates, respectively.

References

    1. Braak H, et al. Staging of brain pathology related to sporadic Parkinson’s disease. Neurobiol. Aging. 2003;24:197–211. doi: 10.1016/S0197-4580(02)00065-9. - DOI - PubMed
    1. Palop JJ, Chin J, M. L. A network dysfunction perspective on neurodegenerative diseases. Nature. 2006;443:768–73. doi: 10.1038/nature05289. - DOI - PubMed
    1. Drzezga A. The network degeneration hypothesis: Spread of neurodegenerative patterns along neuronal brain networks. J. Nucl. Med. 2018;59:1645–1648. doi: 10.2967/jnumed.117.206300. - DOI - PubMed
    1. Bischof GN, et al. Connectomics and molecular imaging in neurodegeneration. Eur. J. Nucl. Med. Mol. Imaging. 2019;46:2819–2830. doi: 10.1007/s00259-019-04394-5. - DOI - PMC - PubMed
    1. Brettschneider J, Del Tredici K, Lee VMY, Trojanowski JQ. Spreading of pathology in neurodegenerative diseases: a focus on human studies. Nat. Rev. Neurosci. 2015;16:109–120. doi: 10.1038/nrn3887. - DOI - PMC - PubMed