. 2022 Jul;607(7917):142-148.
doi: 10.1038/s41586-022-04866-z. Epub 2022 Jun 22.

Ablation of cDC2 development by triple mutations within the Zeb2 enhancer

Affiliations

Ablation of cDC2 development by triple mutations within the Zeb2 enhancer

Tian-Tian Liu et al. Nature. 2022 Jul.

Abstract

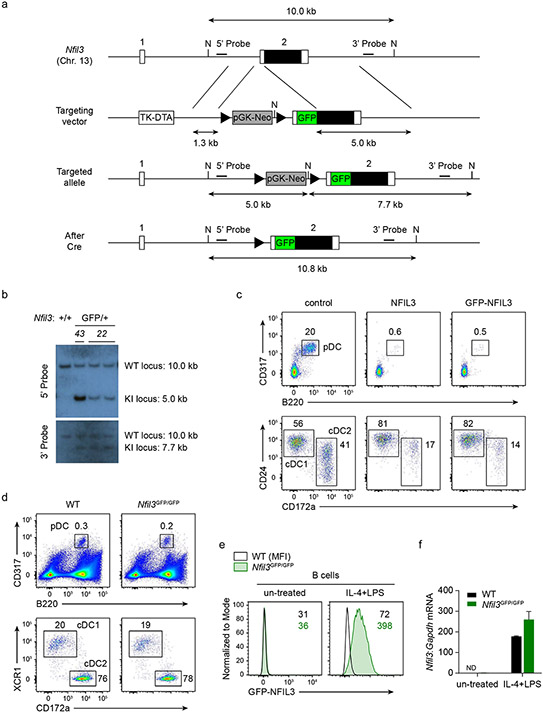
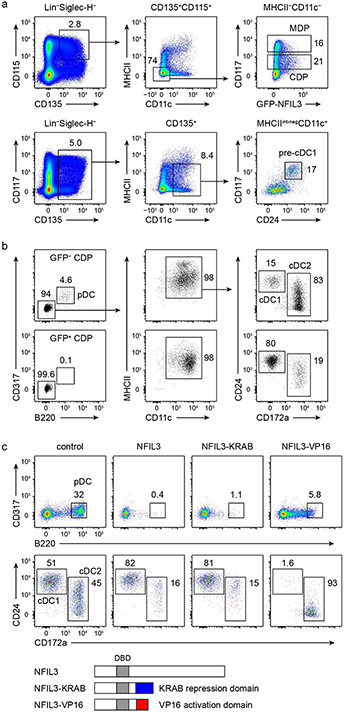
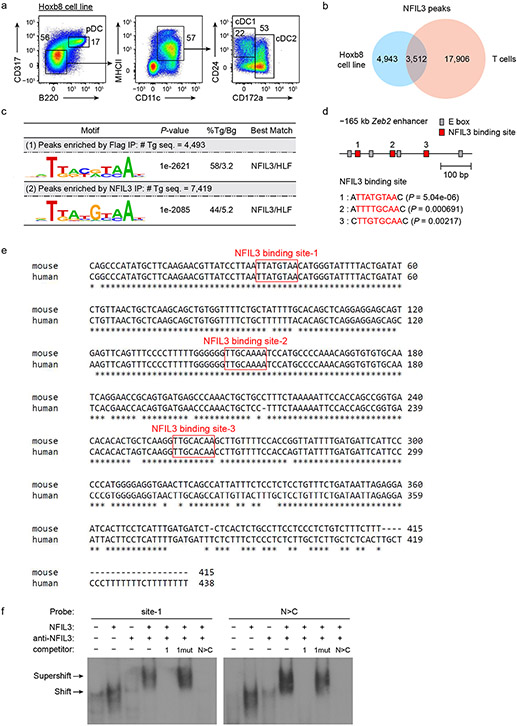
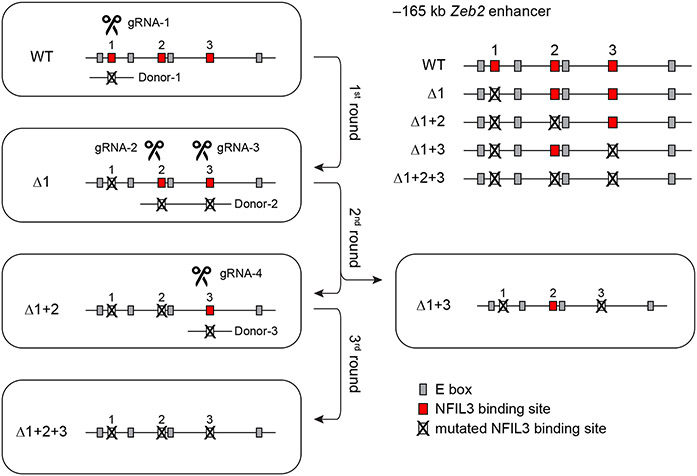
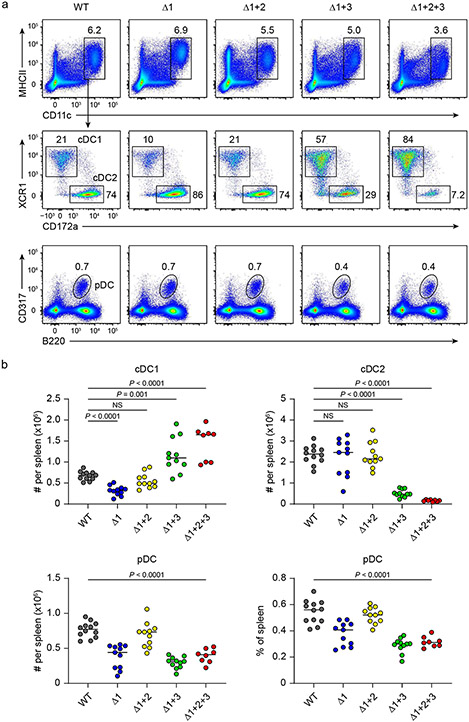
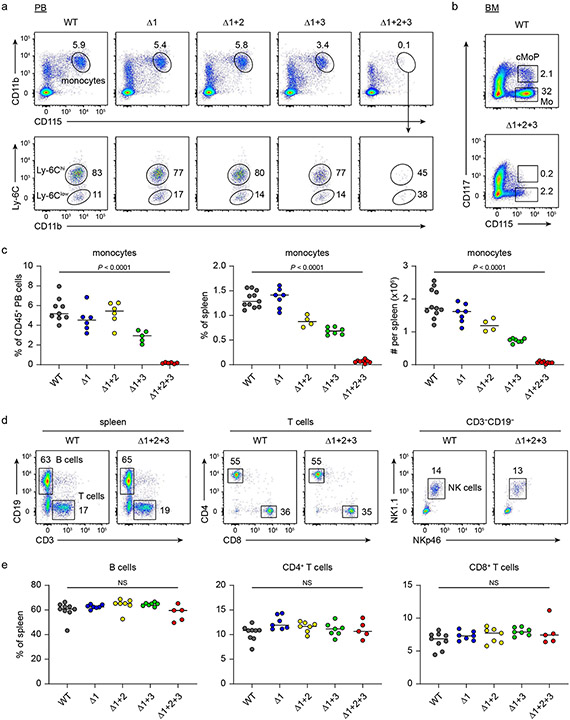
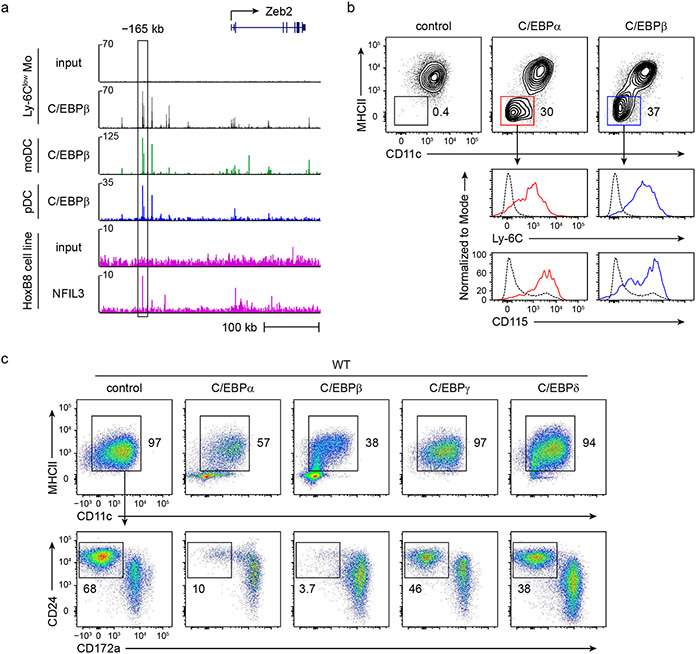
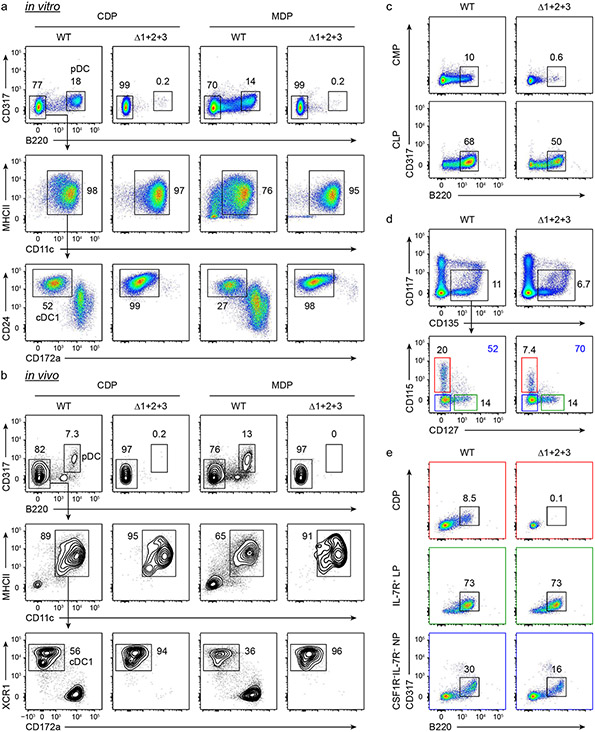
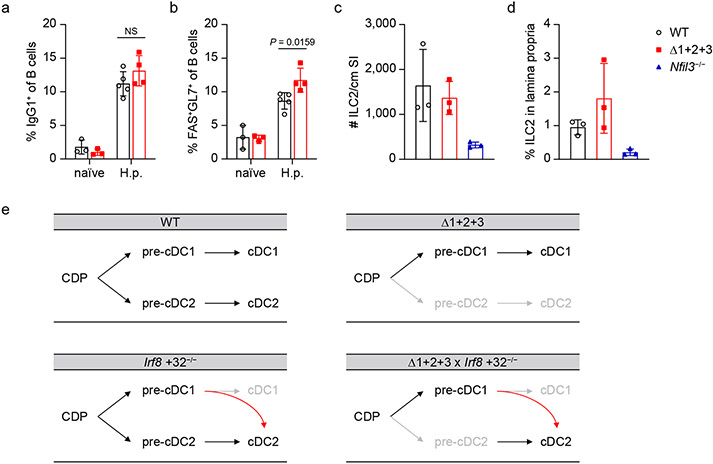
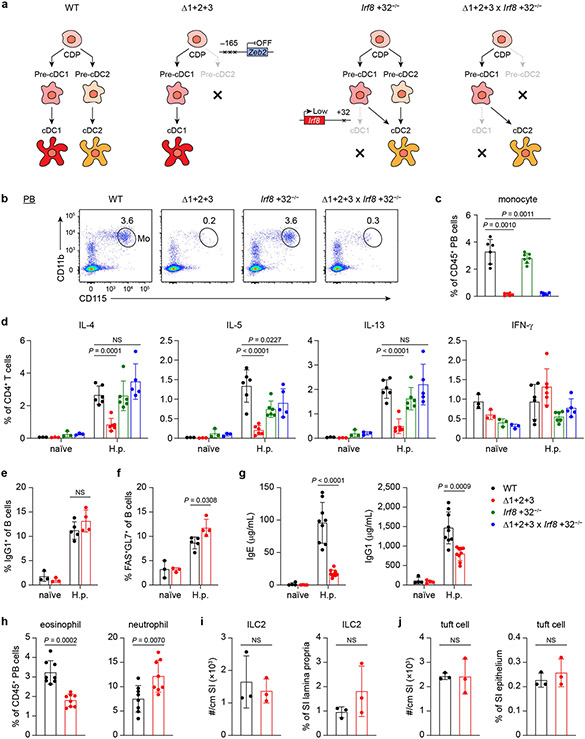
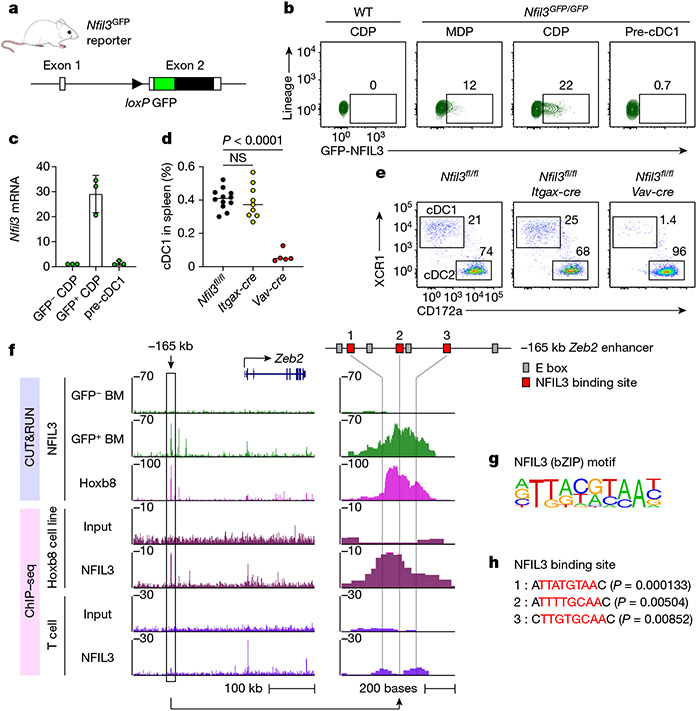
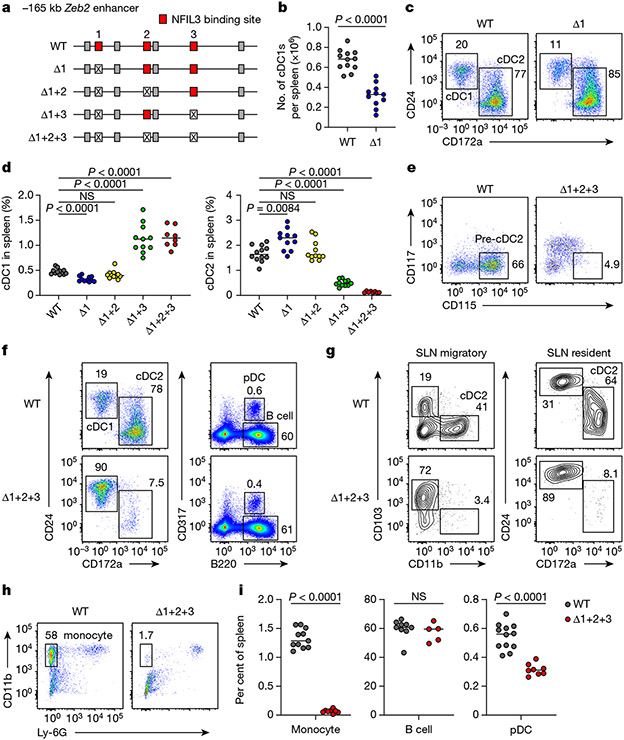
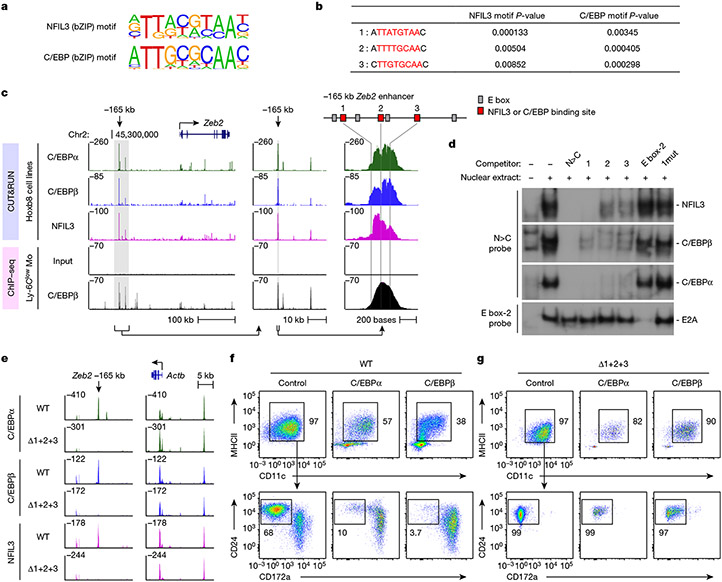
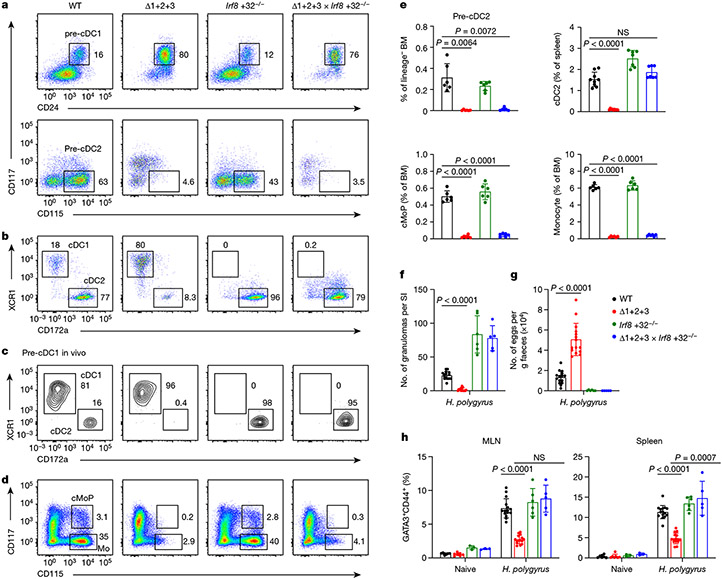
The divergence of the common dendritic cell progenitor1-3 (CDP) into the conventional type 1 and type 2 dendritic cell (cDC1 and cDC2, respectively) lineages4,5 is poorly understood. Some transcription factors act in the commitment of already specified progenitors-such as BATF3, which stabilizes Irf8 autoactivation at the +32 kb Irf8 enhancer4,6-but the mechanisms controlling the initial divergence of CDPs remain unknown. Here we report the transcriptional basis of CDP divergence and describe the first requirements for pre-cDC2 specification. Genetic epistasis analysis7 suggested that Nfil3 acts upstream of Id2, Batf3 and Zeb2 in cDC1 development but did not reveal its mechanism or targets. Analysis of newly generated NFIL3 reporter mice showed extremely transient NFIL3 expression during cDC1 specification. CUT&RUN and chromatin immunoprecipitation followed by sequencing identified endogenous NFIL3 binding in the -165 kb Zeb2 enhancer8 at three sites that also bind the CCAAT-enhancer-binding proteins C/EBPα and C/EBPβ. In vivo mutational analysis using CRISPR-Cas9 targeting showed that these NFIL3-C/EBP sites are functionally redundant, with C/EBPs supporting and NFIL3 repressing Zeb2 expression at these sites. A triple mutation of all three NFIL3-C/EBP sites ablated Zeb2 expression in myeloid, but not lymphoid progenitors, causing the complete loss of pre-cDC2 specification and mature cDC2 development in vivo. These mice did not generate T helper 2 (TH2) cell responses against Heligmosomoides polygyrus infection, consistent with cDC2 supporting TH2 responses to helminths9-11. Thus, CDP divergence into cDC1 or cDC2 is controlled by competition between NFIL3 and C/EBPs at the -165 kb Zeb2 enhancer.


Figures

Extended Data Figure 1.
Extended Data Figure 1.. Generation of Nfil3GFP fusion protein reporter mice
a, Schematic diagrams of the mouse Nfil3 WT allele, the targeting vector and targeted allele. Filled and open boxes denote coding and noncoding exons of Nfil3, respectively. N indicate NdeI site. Triangles indicate loxP sequences. TK, thymidine kinase promoter; DTA, diphtheria toxin A; pGK-Neo, neomycin selection cassette. b, Southern blot analysis of Nfil3+/+ and Nfil3GFP/+. Genomic DNA was isolated from mouse liver, digested with NdeI, electrophoresed, and hybridized with Digoxigenin-labeled probes indicated in a. Southern blot with 5’ probe gave a 10.0 and a 5.0 kb band for WT and targeted allele. Southern blot with 3’ probe gave a 10.0 and a 7.7 kb band for WT and targeted allele respectively. Progeny from ES cell clone 22 were bred to CMV-Cre mice to remove the neomycin selection cassette, and used in the following study. c, Flow cytometric analysis showing pDCs and cDCs differentiated from WT CD117hi BM progenitors retrovirally expressing NFIL3 and GFP-NFIL3. The CD24+ CD172a cDC1s and CD172a+ cDC2s are pre-gated as CD317 B220 MHCII+ CD11c+ cells. Data shown are one of two similar experiments. d, Representative flow plots showing pDCs and cDCs among live splenocytes from WT and Nfil3GFP/GFP mice, cDCs are pre-gated as CD317 B220 MHCII+ CD11c+ cells. Data shown are one of three similar experiments. e, Representative flow plots showing GFP-NFIL3 expression in B cells from Nfil3GFP/GFP mice. Whole splenocytes were cultured with medium or were stimulated with IL-4 (20 ng/mL) and LPS (5 μg/mL) for 24 h. B cells were pre-gated as CD19+ cells. Data shown are one of two similar experiments. f, Nfil3 transcripts, measured by RT-qPCR, in B cells sorted from e.
Extended Data Figure 2.
Extended Data Figure 2.. Nfil3 acts as a repressor to drive cDC1 specification
a, Gating strategy for MDP, CDP and pre-cDC1 progenitors in BM. b, Flow cytometric analysis showing pDCs and cDCs differentiated from GFP negative and positive CDPs sorted from Nfil3GFP/GFP mice. Data shown are one of four similar experiments. c, Flow cytometric analysis showing pDCs and cDCs differentiated from WT CD117hi BM progenitors retrovirally expressing NFIL3, NFIL3-KRAB or NFIL3-VP16. The cDCs are pre-gated as CD317 B220 MHCII+ CD11c+ cells. Data shown are one of three similar experiments. Schematic diagrams of NFIL3, NFIL3-KRAB and NFIL3-VP16 are depicted below the plots. DBD denotes DNA-binding domain.
Extended Data Figure 3.
Extended Data Figure 3.. ChIP-seq identifies NFIL3 binding in the −165 kb Zeb2 enhancer
a, Flow cytometric analysis showing DC potential of Hoxb8 cell line. The cells were washed twice with cold PBS to remove residual β-estradiol and cytokines before standard Flt3L culture for 7 days. b, Venn diagram showing numbers of specific or overlapping NFIL3 ChIP-seq peaks in Flag-NFIL3 expressing Hoxb8 cell line or T cells. c, De novo DNA motif analysis using NFIL3 peaks in the Flag-NFIL3 expressing Hoxb8 cell line or T cells. # Tg seq. and % Tg/Bg denote the number of total target sequences and percentage of target sequences/percentage of background sequences, respectively. d, FIMO analysis depicting P-values of the three predicted NFIL3 binding sites in the −165 kb Zeb2 enhancer. The motif used in FIMO analysis is de novo NFIL3 motif obtained from NFIL3 peaks in Flag-NFIL3 expressing Hoxb8 cell line (shown in c). e, Alignment of human, genome draft hg19, and mouse, genome draft mm10, for the −165 kb Zeb2 enhancer regions. Red boxes indicate NFIL3 binding sites. f, EMSA with nuclear extracts of HEK293FT cells transfected with an empty vector or an NFIL3-encoding vector. A 37 bp 32P-labelled DNA probe encompassing the NFIL3 binding site-1 from the −165 kb Zeb2 enhancer was synthesized as site-1 probe. A 40 bp 32P-labelled DNA probe containing an optimized NFIL3 motif and flanking sequence of the NFIL3/C/EBP binding site-3 from the −165 kb Zeb2 enhancer was synthesized as N>C probe. NFIL3 binding specificity was demonstrated by competition with non-radioactively labeled probes and supershift with the anti-NFIL3 antibody. The competitor 1 indicates site-1, and the competitor 1mut has the same sequence as site-1 except that the NFIL3/C/EBP binding site-1 was mutated.
Extended Data Figure 4.
Extended Data Figure 4.. Targeting strategy of NFIL3 binding site mutant mice
gRNA-1 and donor-1 were introduced into WT zygotes to mutate NFIL3 binding site-1. Δ1 mice were generated from the first round of targeting. gRNA-2, gRNA-3 and donor-2 were introduced into Δ1 homozygous zygotes to mutant NFIL3 binding site-2 and 3. Δ1+2 and Δ1+3 mice were generated from the second round of targeting. gRNA-4 and donor-3 were introduced into Δ1+2 heterozygous zygotes to mutate NFIL3 binding site-3. Δ1+2+3 mice were generated from the third round of targeting.
Extended Data Figure 5.
Extended Data Figure 5.. Mutation of three NFIL3 binding sites in the −165 kb Zeb2 enhancer abrogates cDC2 development
a, Representative flow plots showing cDCs and pDCs among live splenocytes from WT, Δ1, Δ1+2, Δ1+3 and Δ1+2+3 mice. cDCs are pre-gated as CD317 B220 MHCII+ CD11c+ cells. b, Number of splenic cDC1, cDC2, pDC, and frequency of splenic pDC in WT, Δ1, Δ1+2, Δ1+3 and Δ1+2+3 mice. Data are pooled from five independent experiments (n = 12 for WT, n = 11 for Δ1, Δ1+2, Δ1+3, and n = 8 for Δ1+2+3 mice). NS, not significant; b: Brown–Forsythe and Welch ANOVA with Dunnetťs T3 multiple comparisons test.
Extended Data Figure 6.
Extended Data Figure 6.. Mutation of three NFIL3 binding sites in the −165 kb Zeb2 enhancer abrogates monocyte development
a, Representative flow plots showing monocytes among live CD45+ peripheral blood cells from WT, Δ1, Δ1+2, Δ1+3 and Δ1+2+3 mice (pre-gate: CD45+ Ly-6G cells). b, Representative flow plots showing cMoPs and monocytes in the BM of WT and Δ1+2+3 mice (pre-gate: lineage Siglec-H CD135 MHCII CD11c cells). Data shown are one of five similar experiments. c, Frequency of peripheral blood monocytes, splenic monocytes, and number of splenic monocytes in WT, Δ1, Δ1+2, Δ1+3 and Δ1+2+3 mice. Data are representative of four similar experiments for peripheral blood monocyte, and pooled from five independent experiments for splenic monocytes (peripheral blood monocytes: n = 9 for WT, n = 6 for Δ1, Δ1+2, n = 5 for Δ1+3 and n = 6 for Δ1+2+3 mice; splenic monocytes: n = 11 for WT, n = 7 for Δ1, n = 4 for Δ1+2, n = 7 for Δ1+3 and n = 8 for Δ1+2+3 mice). d, Representative flow plots showing B cells, T cells and NK cells among live splenocytes from WT and Δ1+2+3 mice. T cells are pre-gated as CD3+ CD19 cells and NK cells are pre-gated as CD3 CD19 cells. Data are representative of five independent experiments for B cells, T cells, and of three independent experiments for NK cells. e, Frequency of splenic B cells, CD4+ T cells and CD8+ T cells in WT, Δ1, Δ1+2, Δ1+3 and Δ1+2+3 mice. Data are pooled from three independent experiments (n = 9 for WT, n = 7 for Δ1, Δ1+2, Δ1+3, and n = 5 for Δ1+2+3 mice). NS, not significant; c, e: Brown–Forsythe and Welch ANOVA with Dunnett’s T3 multiple comparisons test.
Extended Data Figure 7.
Extended Data Figure 7.. C/EBP factors bind to the −165 kb Zeb2 enhancer to support cDC2 and monocyte development
a, ChIP-seq tracks display C/EBPβ binding around the Zeb2 locus in Ly-6Clow monocytes, moDCs and pDCs. b, Representative flow plots showing monocyte-like cells differentiated from Flt3L cultures of WT CDPs retrovirally expressing C/EBPα or C/EBPβ (LAP isoform) (pre-gate: CD317 B220 cells). cDCs expressing empty-retroviral vectors are shown as controls (dashed black lines) for Ly-6C and CD115 expression in MHCII CD11c cells. Data shown are one of two similar experiments. c, Representative flow plots showing cDCs differentiated from Flt3L cultures of WT CDPs retrovirally expressing C/EBPα, C/EBPβ, C/EBPγ or C/EBPδ (pre-gate: CD317 B220 cells). Data shown are one of three similar experiments.
Extended Data Figure 8.
Extended Data Figure 8.. Myeloid and lymphoid pathways of pDC development are distinguished by different requirements in the −165 kb Zeb2 enhancer
a, Representative flow plots showing pDCs and cDCs differentiated from sort purified CDPs and MDPs of WT and Δ1+2+3 mice, assessed after 5 days of culture with Flt3L. Data shown are one of three similar experiments. b, Representative flow plots showing in vivo developmental potential of CDPs and MDPs from WT and Δ1+2+3 mice. CDPs and MDPs (8 × 10³ - 8 × 10⁴) were sort purified and i.v. injected into sub-lethally irradiated CD45.1 recipients (B6-Ly5.1/Cr mice). After 7 days, recipient spleens were analyzed for the presence of CD45.2+ donor-derived pDCs and cDCs (pre-gate: CD45.2+ CD45.1 cells). Data shown are one of two (CDP) or three (MDP) similar experiments. c, Representative flow plots showing pDCs differentiated from sort purified CMPs and CLPs of WT and Δ1+2+3 mice, assessed after 7 (CMPs) or 5 (CLPs) days of culture with Flt3L. Data shown are one of two (CMP) or three (CLP) similar experiments. d, Representative flow plots showing CDPs (CD115+ CD127), IL-7R+ LPs (CD115 CD127+) and IL-7R CSF1R NPs (CD115 CD127) in the BM of WT and Δ1+2+3 mice (pre-gate: lineage CD16/CD32 CD135+ CD117int-neg cells). Data shown are one of three similar experiments. e, Representative flow plots showing pDCs differentiated from sort purified CDPs, IL-7R+ LPs and IL-7RCSF1R NPs (as in d) of WT and Δ1+2+3 mice, assessed after 4 days of culture with Flt3L. Data shown are one of three similar experiments.
Extended Data Figure 9.
Extended Data Figure 9.. Zeb2 is not required for the maintenance of cDC2, who support TH2 responses to H. polygyrus infection
a, b, Frequency of IgG1+ class-switched B cells (a) or FAS+ GL7+ germinal center B cells (b) of total CD19+ B cells in MLN from WT or Δ1+2+3 naïve mice or mice infected for 14 days with H. polygyrus (H.p.) (200 L3 stage larvae). Data shown are one of two similar experiments (n = 3 for WT or Δ1+2+3 naïve mice, n = 5 for H.p. infected WT mice and n = 4 for H.p. infected Δ1+2+3 mice). c, d, Number of ILC2s per cm small intestine (c) and frequency of ILC2s in small intestine lamina propria CD45+ cells (d) of WT, Δ1+2+3 and Nfil3−/− mice (n = 3 for each genotype). ILC2s are gated as CD45+ CD11c CD11b CD3 CD4 CD90.2+ KLRG1+ cells. e, Diagrams showing DC development in WT, Δ1+2+3, Irf8 +32−/− and Δ1+2+3 × Irf8 +32−/− mice. Mean ± s.d.; NS, not significant; a, b: unpaired, multiple t tests with Welch correction.
Extended Data Fig. 10 ∣
Extended Data Fig. 10 ∣. Zeb2 is not required for the maintenance of cDC2, which support TH2 responses to H. polygyrus infection.
a, Diagrams showing DC development in WT, Δ1+2+3, Irf8 +32−/− and Δ1+2+3 × Irf8 +32−/− mice. b, Representative flow plots showing monocytes among CD45+ peripheral blood cells from WT, Δ1+2+3, Irf8 +32−/− and Δ1+2+3 × Irf8 +32−/− mice. c, Frequency of peripheral blood monocytes in WT, Δ1+2+3, Irf8 +32−/− and Δ1+2+3 × Irf8 +32−/− mice. Data are pooled from two independent experiments (n = 6 for WT, Δ1+2+3, n = 7 for Irf8 +32−/− and n = 6 for Δ1+2+3 × Irf8 +32−/− mice). d, Frequency of IL-4, IL-5, IL-13 or IFN-γ expressing CD4+ T cells in MLNs from WT, Δ1+2+3, Irf8 +32−/− and Δ1+2+3 × Irf8 +32−/− naïve mice or mice infected with H.p. for 14 days (pre-gate: TCRβ+CD4+ cells). Data are pooled from two independent experiments (n = 3 for naïve mice, n = 6 for H.p. infected WT, Δ1+2+3, Irf8 +32−/− mice and n = 5 for H.p. infected Δ1+2+3 × Irf8 +32−/− mice). WT versus Δ1+2+3 × Irf8 +32−/− IL-4 expressing CD4+ T cells in H.p. infected mice P = 0.1044, WT versus Δ1+2+3 × Irf8 +32−/− IL-13 expressing CD4+ T cells in H.p. infected mice P = 0.8243. e, f, Frequency of IgG1+ class-switched B cells (e) or FAS+GL7+ germinal center B cells (f) of total CD19+ B cells in MLNs from WT or Δ1+2+3 naïve mice or mice infected with H.p. for 14 days (n = 3 for WT or Δ1+2+3 naïve mice, n = 5 for H.p. infected WT mice and n = 4 for H.p. infected Δ1+2+3 mice). WT versus Δ1+2+3 IgG1+ class-switched B cells in H.p. infected mice P = 0.2145. g, Total serum IgE and IgG1 in naïve WT, Δ1+2+3 mice or mice infected with H.p. for 14 days. Data are pooled from two independent experiments (n = 4 for naïve mice and n = 9 for H.p. infected mice). h, Frequency of peripheral blood eosinophils and neutrophils in WT and Δ1+2+3 mice (n = 8 for each genotype). i, Number of ILC2s per cm small intestine and frequency of ILC2s in small intestine lamina propria CD45+ cells of WT and Δ1+2+3 mice (n = 3 for each genotype). WT versus Δ1+2+3 ILC2 number P > 0.9999, frequency P = 0.4000. j, Number of tuft cells per cm small intestine and frequency of tuft cells in small intestine epithelium CD45 cells of WT and Δ1+2+3 mice (n = 3 for each genotype). WT versus Δ1+2+3 tuft cell number P = 0.7000, frequency P = 0.7000. Mean ± s.d.; NS, not significant; c: Brown–Forsythe and Welch ANOVA with Dunnett’s T3 multiple comparisons test; d: ordinary two-way ANOVA with Dunnett’s multiple comparisons test; eg: unpaired, multiple t tests with Welch correction; hj: unpaired, two-tailed Mann–Whitney test.
Fig. 1 ∣
Fig. 1 ∣. Transient NFIL3 expression drives cDC1 specification.
a, Schematic of the Nfil3GFP reporter mice. Filled and open boxes denote coding and noncoding exons of Nfil3, respectively. b, Representative flow cytometry plots showing GFP–NFIL3 expression in MDPs, CDPs and pre-cDC1 progenitors from the BM of Nfil3GFP/GFP mice. The percentage of each cell type expressing GFP–NFIL3 is shown. c, Nfil3 transcripts normalized to Gapdh, measured by quantitative PCR with reverse transcription (RT–qPCR), in GFP–NFIL3 CDP, GFP–NFIL3+ CDP and pre-cDC1 from Nfil3GFP/GFP mice. Data are pooled from three independent experiments (n = 3 for each cell type). d, Frequency of splenic cDC1 in Nfil3fl/fl, Nfil3fl/fl Itgax-cre and Nfil3fl/fl Vav-cre mice. Data are pooled from five independent experiments (n = 12 for Nfil3fl/fl, 9 for Nfil3fl/fl Itgax-cre and 5 for Nfil3fl/fl Vav-cre mice). Nfil3fl/fl versus Nfil3fl/fl Itgax-cre, P = 0.9067. e, Representative flow cytometry plots showing splenic cDC1s and cDC2s in Nfil3fl/fl, Nfil3fl/fl Itgax-cre and Nfil3fl/fl Vav-cre mice. Percentages of each cell type are indicated. f, CUT&RUN and ChIP–seq tracks display NFIL3 binding around the Zeb2 locus in GFP–NFIL3 BM cells, GFP–NFIL3+ BM cells, the NFIL3-expressing Hoxb8 cell line or T cells, visualized with the UCSC genome browser. g, Homer NFIL3 motif. h, FIMO analysis depicting P-values of the three NFIL3 binding sites in the −165 kb Zeb2 enhancer. The Homer NFIL3 motif (shown in g) is used in FIMO analysis. Red residues indicate core NFIL3 motif. Data in c are mean±s.d. Centre values in d indicate median. NS, not significant. Brown–Forsythe and Welch ANOVA with Dunnett’s T3 multiple comparisons test is used in d.
Fig. 2 ∣
Fig. 2 ∣. Mutation of three NFIL3 binding sites in the −165 kb Zeb2 enhancer abrogates cDC2 and monocyte development.
a, Schematic of WT, Δ1, Δ1+2, Δ1+3 and Δ1+2+3 mice. Red, crossed and grey boxes denote NFIL3 binding sites, mutated NFIL3 binding sites and E-box motifs, respectively. b, The number of splenic cDC1 in WT and Δ1 mice. Data are pooled from five independent experiments (n = 12 for WT and 11 for Δ1 mice). c, Representative flow cytometry plots showing splenic cDC1s and cDC2s in WT and Δ1 mice. The percentage of each cell type is indicated. d, Frequency of splenic cDC1 and cDC2 in WT, Δ1, Δ1+2, Δ1+3 and Δ1+2+3 mice. Data are pooled from five independent experiments (n = 12 for WT, 11 for Δ1, Δ1+2 and Δ1+3, and 8 for Δ1+2+3 mice). WT versus Δ1+2 cDC1, P= 0.2003, WT versus Δ1+2 cDC2, P = 0.9348. e, Representative flow cytometry plots showing BM pre-cDC2s in WT and Δ1+2+3 mice. Data shown are from one of five similar experiments. f, Representative flow cytometry plots showing splenic cDCs, pDCs and B cells in WT and Δ1+2+3 mice. g, Representative flow cytometry plots showing migratory and resident cDC2s in inguinal skin-draining lymph nodes (SLNs) from WT and Δ1+2+3 mice. Data shown are from one of three similar experiments. h, Representative flow cytometry plots showing splenic monocytes in WT and Δ1+2+3 mice. i, Frequency of splenic monocytes, B cells and pDCs in WT and Δ1+2+3 mice. Data are pooled from five independent experiments for monocytes and pDCs, and three for B cells (monocytes: n = 11 for WT, 8 for Δ1+2+3 mice; B cells: n = 9 for WT, 5 for Δ1+2+3 mice; pDCs: n = 12 for WT, 8 for Δ1+2+3 mice). WT versus Δ1+2+3 B cell, P = 0.4376. Centre values in scatter plots indicate median. b,i, Unpaired, two-tailed Mann–Whitney test. d, Brown–Forsythe and Welch ANOVA with Dunnett’s T3 multiple comparisons test.
Fig. 3 ∣
Fig. 3 ∣. C/EBPs bind to the −165 kb Zeb2 enhancer to support cDC2 and monocyte development.
a, Homer NFIL3 and C/EBP motifs. b, FIMO analysis depicting P-values of the three NFIL3–C/EBP binding sites in the −165 kb Zeb2 enhancer. The Homer NFIL3 and C/EBP motifs (shown in a) were used in FIMO analysis. c, CUT&RUN and ChIP–seq tracks display C/EBPα, C/EBPβ and NFIL3 binding around the Zeb2 locus in Hoxb8 cell lines or Ly-6Clow monocytes, visualized with UCSC genome browser. d, EMSA showing NFIL3, C/EBPβ and C/EBPα binding at −165 kb Zeb2 enhancer. The N>C probe contains an optimized NFIL3 motif and flanking sequence of the NFIL3–C/EBP binding site 3 from the −165 kb Zeb2 enhancer. The competitors 1, 2 and 3 indicate DNA fragments encompassing NFIL3–C/EBP binding sites 1, 2 and 3. The competitor 1mut has the same sequence as competitor 1 except that the NFIL3–C/EBP binding site 1 was mutated. Data shown are one of two similar experiments. For gel source data, see Supplementary Figure 1. e, CUT&RUN tracks display C/EBPα, C/EBPβ and NFIL3 binding at the −165 kb Zeb2 enhancer and around the Actb locus in WT or Δ1+2+3 Hoxb8 cell lines, visualized with Integrative Genomics Viewer. f,g, Representative flow cytometry plots showing cDCs and monocytes differentiated from WT (f) or Δ1+2+3 (g) CDPs retrovirally expressing C/EBPα or C/EBPβ (LAP isoform) (pre-gate: CD317B220 cells). Data shown are from one of four similar experiments.
Fig. 4 ∣
Fig. 4 ∣. Zeb2 is only required for the specification of cDC2, which support TH2 responses to H. polygyrus infection.
a, Representative flow cytometry plots showing BM pre-cDC1s and pre-cDC2s in WT, Δ1+2+3, Irf8 +32−/− and Δ1+2+3 × Irf8 +32−/− mice. b, Representative flow cytometry plots showing splenic cDC1s and cDC2s from the indicated mice. c, Representative flow cytometry plots showing in vivo developmental potential of pre-cDC1s from the indicated mice. Recipient spleens were analysed for CD45.2+ donor-derived cDCs. Data shown are from one of three similar experiments. d, Representative flow cytometry plots showing BM cMoPs and monocytes (Mo) from the indicated mice. e, Frequency of BM pre-cDC2s, splenic cDC2s, BM cMoPs and BM monocytes in the indicated mice. Data are pooled from four independent experiments (splenic cDC2: n = 9 for WT, Δ1+2+3, 7 for Irf8 +32−/−, Δ1+2+3 × Irf8 +32−/− mice; BM pre-cDC2, cMoP and monocyte: n = 6 for each genotype). WT versus Δ1+2+3 × Irf8 +32−/− splenic cDC2, P = 0.1408. fh, Number of granulomas in small intestine (SI) (f) or faecal eggs (g), and frequency of TH2 cells in MLN and spleen (h) from the indicated naive mice or mice infected with H. polygyrus for 14 days. Data are pooled from four independent experiments (n = 7 for WT, Δ1+2+3, 3 for Irf8 +32−/−, Δ1+2+3 × Irf8 +32−/− naive mice; n = 15 for H. polygyrus-infected WT, Δ1+2+3, 6 for Irf8 +32−/−, 5 for Δ1+2+3 × Irf8 +32−/− mice). Frequency of WT versus Δ1+2+3 × Irf8 +32−/− TH2 cells in MLN of H. polygyrus-infected mice, P = 0.0577. Data are mean ± s.d. eg, Brown–Forsythe and Welch ANOVA with Dunnett’s T3 multiple comparisons test. h, Ordinary two-way ANOVA with Dunnett’s multiple comparisons test.

References

    1. Naik SH et al. Development of plasmacytoid and conventional dendritic cell subtypes from single precursor cells derived in vitro and in vivo. Nat. Immunol 8, 1217–1226 (2007). - PubMed
    1. Onai N. et al. Identification of clonogenic common Flt3+ M-CSFR+ plasmacytoid and conventional dendritic cell progenitors in mouse bone marrow. Nat. Immunol 8, 1207–1216 (2007). - PubMed
    1. Liu K. et al. In vivo analysis of dendritic cell development and homeostasis. Science 324, 392–397 (2009). - PMC - PubMed
    1. Grajales-Reyes GE et al. Batf3 maintains autoactivation of Irf8 for commitment of a CD8alpha(+) conventional DC clonogenic progenitor. Nat. Immunol 16, 708–717 (2015). - PMC - PubMed
    1. Schlitzer A. et al. Identification of cDC1- and cDC2-committed DC progenitors reveals early lineage priming at the common DC progenitor stage in the bone marrow. Nat. Immunol 16, 718–728 (2015). - PubMed

MeSH terms

Substances