. 2022 Jul;607(7917):111-118.
doi: 10.1038/s41586-022-04862-3. Epub 2022 Jun 22.

Biosynthetic potential of the global ocean microbiome

Affiliations

Biosynthetic potential of the global ocean microbiome

Lucas Paoli et al. Nature. 2022 Jul.

Abstract

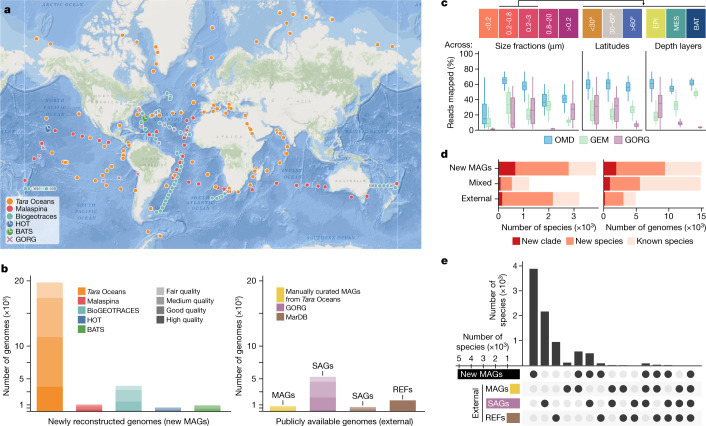
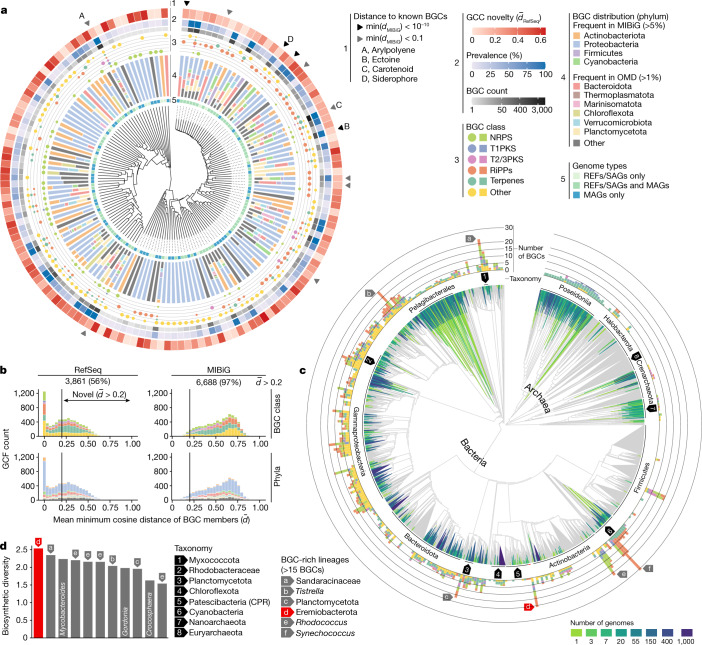
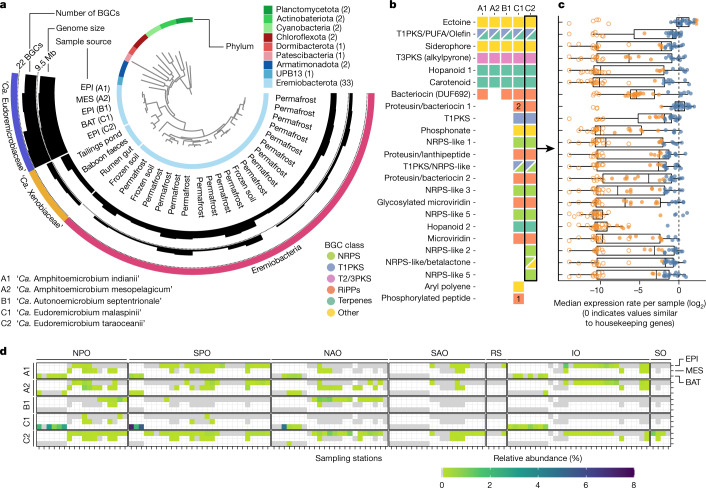
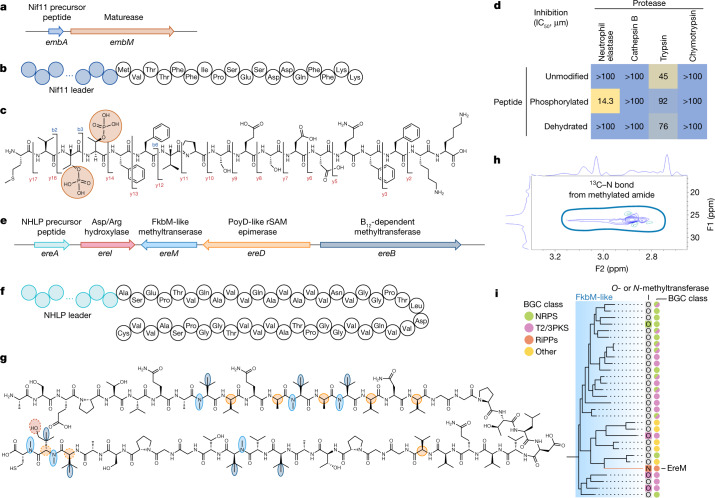
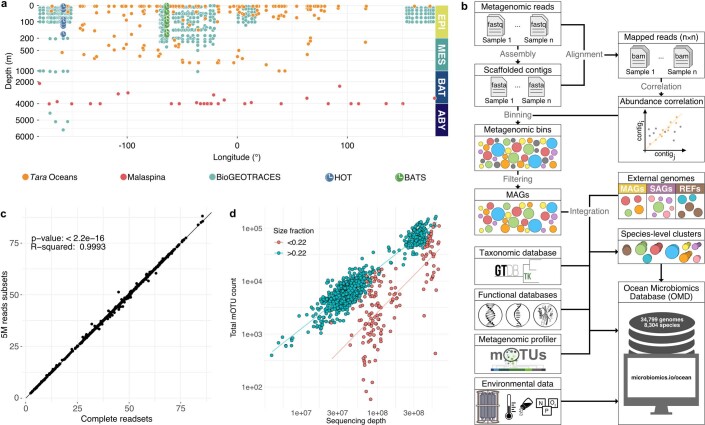
Natural microbial communities are phylogenetically and metabolically diverse. In addition to underexplored organismal groups1, this diversity encompasses a rich discovery potential for ecologically and biotechnologically relevant enzymes and biochemical compounds2,3. However, studying this diversity to identify genomic pathways for the synthesis of such compounds4 and assigning them to their respective hosts remains challenging. The biosynthetic potential of microorganisms in the open ocean remains largely uncharted owing to limitations in the analysis of genome-resolved data at the global scale. Here we investigated the diversity and novelty of biosynthetic gene clusters in the ocean by integrating around 10,000 microbial genomes from cultivated and single cells with more than 25,000 newly reconstructed draft genomes from more than 1,000 seawater samples. These efforts revealed approximately 40,000 putative mostly new biosynthetic gene clusters, several of which were found in previously unsuspected phylogenetic groups. Among these groups, we identified a lineage rich in biosynthetic gene clusters ('Candidatus Eudoremicrobiaceae') that belongs to an uncultivated bacterial phylum and includes some of the most biosynthetically diverse microorganisms in this environment. From these, we characterized the phospeptin and pythonamide pathways, revealing cases of unusual bioactive compound structure and enzymology, respectively. Together, this research demonstrates how microbiomics-driven strategies can enable the investigation of previously undescribed enzymes and natural products in underexplored microbial groups and environments.


Conflict of interest statement

The authors declare no competing interests.

Figures

Fig. 1
Fig. 1. Reconstruction of MAGs at the global scale fills gaps in ocean phylogenomic diversity.
a, A total of 1,038 publicly available ocean microbial community genomes (metagenomes) were collected at 215 globally distributed sites (between 62° S to 79° N and 179° W to 179° E). Map tiles © Esri. Sources: GEBCO, NOAA, CHS, OSU, UNH, CSUMB, National Geographic, DeLorme, NAVTEQ and Esri. b, These metagenomes were used to reconstruct MAGs (Methods and Supplementary Information), which varied in numbers and quality (Methods) across different datasets (colour coded). Reconstructed MAGs were complemented with publicly available (external) genomes, including manually curated MAGs, SAGs and REFs. to compile the OMD. c, The OMD improves the genomic representation (mapping rates of metagenomic reads; Methods) of ocean microbial communities by a factor of two to three compared with previous reports based solely on SAGs (GORG) or MAGs (GEM), with a more consistent representation across depth and latitudes. <0.2, n = 151; 0.2–0.8, n = 67; 0.2–3, n = 180; 0.8–20, n = 30; >0.2, n = 610; <30°, n = 132; 30–60°, n = 73; >60°, n = 42; EPI, n = 174; MES, n = 45; BAT, n = 28. d, Grouping the OMD into species-level (95% average nucleotide identity) clusters identified a total of around 8,300 species, over half of which were previously uncharacterized based on taxonomic annotations using the GTDB (release 89). e, A breakdown of the species by genome type reveals a high complementarity of MAGs, SAGs and REFs in capturing the phylogenomic diversity of the ocean microbiome. Specifically, 55%, 26% and 11% of the species were specific to MAGs, SAGs and REFs, respectively. BATS, Bermuda Atlantic Time-series; GEM, Genomes from Earth’s Microbiomes; GORG, Global Ocean Reference Genomes; HOT, Hawaiian Ocean Time-series.
Fig. 2
Fig. 2. Novelty and phylogenomic distribution of the ocean microbiome biosynthetic potential.
A total of 39,055 BGCs were clustered into 6,907 GCFs and 151 GCCs. a, Representation of the data (inner to outer layers). Hierarchical clustering based on BGC distances of the GCCs, 53 of which were captured only by MAGs. GCCs comprise BGCs from different taxa (ln-transformed phylum frequencies) and different BGC classes (circle sizes correspond to their frequencies). The outer layers indicate, for each GCC, the number of BGCs, the prevalence (percentage of samples) and the distance (minimum cosine distance of BGCs (min(dMIBiG))) to BGCs from BiG-FAM. GCCs with BGCs closely related to experimentally validated BGCs (MIBiG) are highlighted by arrows. b, Comparing GCFs to computationally predicted (BiG-FAM) and experimentally validated (MIBiG) BGCs uncovered 3,861 new (d– > 0.2) GCFs. Most of them (78%) encode RiPPs, terpenes and other putative natural products. c, All genomes in the OMD detected across 1,038 ocean metagenomes were placed onto the GTDB backbone trees to reveal the extent of the phylogenomic coverage of the OMD. Clades without any genome in the OMD are coloured grey. The number of BGCs corresponds to the highest number of predicted BGCs per genome in a given clade. For visualization, the last 15% of the nodes were collapsed. The arrows denote BGC-rich clades (>15 BGCs) with the exception of Mycobacteroides, Gordonia (next to Rhodococcus) and Crocosphaera (next to Synechococcus). d, An unknown species of ‘Ca. Eremiobacterota’ displayed the highest biosynthetic diversity (Shannon index based on natural product types). Each bar represents the genome with the highest number of BGCs within a species. T1PKS, type I PKS; T2/3PKS, type II and III PKS.
Fig. 3
Fig. 3. Phylogeny, biosynthetic potential and distribution of the BGC-rich family ‘Ca. Eudoremicrobiaceae’.
a, Phylogenomic placement of five ‘Ca. Eudoremicrobiaceae’ spp. revealed a BGC richness specific to the ocean lineage discovered in this study. The phylogenomic tree includes all ‘Ca. Eremiobacterota’ MAGs available in the GTDB (release 89) and representatives from additional phyla (the number of genomes is indicated in parentheses) for evolutionary context (Methods). The outermost layer indicates family-level (‘Ca. Eudoremicrobiaceae’ and ‘Ca. Xenobiaceae’) and class-level (‘Ca. Eremiobacteria’) taxonomy. The five species described in this study are denoted by an alphanumeric code and a proposed binomial name (Supplementary Information). b, ‘Ca. Eudoremicrobiaceae’ spp. share a core of seven BGCs. The missing BGC from clade A2 was attributed to incompleteness of the representative MAG (Supplementary Table 3). BGCs specific to ‘Ca. Amphithomicrobium’ and ‘Ca. Amphithomicrobium’ (clades A and B) are not displayed. c, All BGCs encoded by ‘Ca. Eudoremicrobium taraoceanii’ were found to be expressed across the set of 623 metatranscriptomes sampled by Tara Oceans. The filled circles indicate active transcription. The orange circles indicate values below or above a log2-transformed fold change from the expression rate of housekeeping genes (Methods). d, Relative abundance profiles (Methods) showed that ‘Ca. Eudoremicrobiaceae’ spp. are abundant and prevalent in most ocean basins and throughout the water column (from the surface to a depth of at least 4,000 m). On the basis of these estimations, we found that ‘Ca. E. malaspinii’ comprises up to 6% of the prokaryotic cells in bathypelagic particle-associated communities. We considered a species to be present at a station if it was detected in any of the size fractions of a given depth layer. IO, Indian Ocean; NAO, North Atlantic Ocean; NPO, North Pacific Ocean; RS, Red Sea; SAO, South Atlantic Ocean; SO, Southern Ocean; SPO, South Pacific Ocean.
Fig. 4
Fig. 4. ‘Ca. Eudoremicrobiaceae’ spp. are a source of unusual enzymology and natural product structure.
ac, In vitro heterologous expression and in vitro enzyme assays of a novel (d®RefSeq = 0.29) RiPP biosynthetic cluster specific to the deep ocean species ‘Ca. E. malaspinii’ led to the production of a di-phosphorylated product. c, Modifications were identified using high-resolution (HR) MS/MS (fragmentation is indicated by the b and y ions on the chemical structure) and NMR (Extended Data Fig. 9). d, This phosphorylated peptide displayed low-micromolar mammalian neutrophil elastase inhibition, which was not found for the control and dehydrated peptides (dehydration induced by chemical elimination). The experiment was repeated three times, leading to similar outcomes. eg, Heterologous expression of a second novel d®RefSeq = 0.33) proteusin biosynthetic cluster sheds light on the functionality of four maturases modifying a 46-amino-acid core peptide. Residues are coloured on the basis of predicted modification sites from HR-MS/MS, isotope labelling and NMR analyses (Supplementary Information). Dashed colouring indicates that the modification occurs on either of the two residues. The figure represents a compilation of numerous heterologous constructs to display the activity of all maturases on the same core. h, Inset of the NMR data of the backbone amide N-methylation. The complete results are shown in Extended Data Fig. 10. i, Phylogenetic placement of the FkbM maturase of the proteusin cluster among all FkbM domains found in the MIBiG 2.0 database revealed an enzyme of this family with N-methyltransferase activity (Supplementary Information). Schematic representations of the BGCs (a,e), the structure of the precursor peptides (b,f) and the proposed chemical structures of the natural products (c,g) are shown.
Extended Data Fig. 1
Extended Data Fig. 1. Depth distribution of the metagenomes used in this study; overview of the bioinformatic pipeline and proxies for sequencing depth.
(a) 1,038 publicly-available ocean microbial community genomes (metagenomes) were collected across all major depth layers (1 - 5,601 m) in the context of different ocean expeditions and time series programmes; EPI - epipelagic layer; MES - mesopelagic layer; BAT - bathypelagic layer; ABY - abyssopelagic layer. (b) Quality-controlled, high-throughput DNA sequencing reads from ocean microbial community samples were individually assembled into metagenomic scaffolded contigs (scaffolds). Sequencing reads from large subsets (n ranging from 58 to 610) of all samples were aligned to scaffolds of each individual sample to compute relative copy-number abundances for each scaffold in each sample. Based on a combination of tetranucleotide frequency, within-sample co-abundance and between-sample abundance correlations, scaffolds were grouped into a total of 62,874 metagenomic bins, each with total nucleotide sequence lengths of > 200 kb. These metagenomic bins were filtered for genome completeness and contamination, resulting in 26,293 metagenome assembled genomes (MAGs). These MAGs were complemented with external sets of MAGs, single amplified genomes (SAGs) and genomes from cultured isolates (REFs). The combined set of 34,799 genomes was clustered at the species level using a 95% average nucleotide identity (ANI) and, along with taxonomic and functional annotations, abundance profiles and contextual information, compiled into the Ocean Microbiomics Database (OMD); see methods for details (Methods). (c) Comparing mapping rates obtained from mapping subsampled readsets compared to those obtained from mapping the total number of reads shows that this procedure yields almost identical results at considerably less computational costs. (d) mOTUs counts as a good proxy for sequencing depth. We find a strong correlation in prokaryote-, particle-enriched and virus-depleted communities, while this correlation is more variable in virus-enriched communities. This observation is actually in support of using the mOTUs count rather than sequencing depth when focusing on the bacteria and archaeal component of microbial communities, as we do here.
Extended Data Fig. 2
Extended Data Fig. 2. Impact of abundance correlation on MAGs recovery and quality, quality improvement over other ocean MAGs datasets, recovery of mobile genetic elements and evaluation of genome chimerism.
(a) In this study, MAGs were reconstructed using abundance correlation information (Extended Data Fig. 1b) (Methods), which resulted in both higher cumulative quality scores per sample and individual quality scores per MAG. The ratio of cumulative quality scores (Supplementary Information) of MAGs binned with and without differential coverage information was on average (median) 2.3 across the different datasets. Per individual MAGs, a mean quality score increase of 20% was achieved. The number of samples used for differential coverage profiling are indicated above the boxplots. The colours of the boxplots reflect the different datasets as indicated in Fig. 1b. (b) We investigated the bin membership of > 80 M scaffolds across size and fragment type. These scaffolds were annotated to identify chromosomes, plasmids and phages (Supplementary Information). The difference between chromosomes and plasmids binning rates provides an evaluation of the bias of the MAG reconstruction against hypervariable regions within the genomes. Annotations were integrated to classify scaffolds as follows, chromosomes (‘eukrep = Prokarya & plasflow prediction = chromosome & cbar prediction = Chromosome & plasmidfinder plasmid = NaN & deepvirfinder p-value > 0.05 & virsorter score = NaN’), plasmids (‘(plasmidfinder plasmid != NaN | (plasflow prediction = plasmid & cbar prediction = Plasmid)) & eukrep = Prokarya & virsorter score not in [1, 2] & deepvirfinder p-value > 0.05’), viruses (‘virsorter score > = 1 & deepvirfinder p-value < 0.01 & eukrep = Prokarya & plasflow prediction != plasmid & cbar prediction != Plasmid’) or unannotated. By benchmarking the quality of the MAGs reconstructed in this study (Supplementary Information), we found that combining single-sample assemblies with large-scale abundance correlations achieved on average significantly higher community-defined quality scores than and (c) two datasets of automatically generated MAGs, dataset #1 and dataset #2, and (d) even manually curated MAGs. ‘n’ denotes the number of possible comparisons (i.e. number of shared species) with the different MAGs sets. All genomes in the extended OMD were evaluated for chimerism using the taxonomic annotation of 10 universal single copy marker genes (Supplementary Information). (f) For each taxonomic level, the genomes were classified as: “No annotation” if a maximum of one gene out of 10 was annotated; “Agreeing” if all genes had the same annotation; “Majority agreeing” if more than half agreed and “Not agreeing” otherwise. The evaluation was split for the genomes origin (y-axis). (g) Percentage of “Not agreeing” annotations over all the annotated clades (i.e. the sum of “Agreeing”, Majority agreeing” and “Not agreeing”). Notably, across all MAGs the rate of disagreement was < 1% with that rate being ~0.1% for MAGs with differential coverage index ≥ 10 (i.e. 75% of the MAGs), suggesting the added value of abundance correlation in reducing the rates of chimera.
Extended Data Fig. 3
Extended Data Fig. 3. Different genome reconstruction strategies capture complementary phylogenomic diversity; trends in community genome sizes across the global ocean microbiome.
(a) Reconstructed MAGs, external MAGs, SAGs as well as REFs detected across the set of 1,038 ocean metagenomes were placed on the GTDB backbone trees revealing that the different genome types (MAGs, SAGs and REFs) capture complementary phylogenomic diversity. Similar to Fig. 3, the green-to-blue colours of the branches indicate the number of genomes in that part of the tree. The inner layer denotes the taxonomy of specific clades (some indicated by arrows due to limited space). The outer layer represents the percentage of genomes across the binned tree for each genome type. Clades without any genome from the OMD were left in grey. For visualization purposes, the last 15% of the nodes are collapsed. (b, c) The average genome size per sample was significantly larger in deeper waters (Kruskal Wallis test, p-value < 2*10−16, n = 1,038) and was inversely correlated with temperature (linear model). (d) Comparing genome sizes from MAG-based predictions and reference genomes for 85 mOTUs (species-level) clusters with at least one reference genome. Genome sizes are estimated using MAGs of good quality and above only (completeness above 70%), a criteria that is met for > 80% of the mOTUs clusters.
Extended Data Fig. 4
Extended Data Fig. 4. Structure and drivers of the ocean microbiome biosynthetic potential; evaluation of BGC completeness using length and number of genes between predicted and characterized BGCs.
(a) The abundances of GCFs (Methods) were used to compute distances between the 1,038 metagenomic samples. Using dimension reduction and density based clustering (Methods), we identified three sample clusters. (b) A prediction strength analysis strongly supports clustering the data into 3 groups (largest number of clusters above the 0.9 threshold). This is also confirmed by the Silhouette Index (data not shown). (c) These clusters were broken down by community origin, including size fractions, depth layers and ocean basins. We found significant differences in BGC class abundances (FDR-corrected pairwise Wilcoxon tests, p-value < 10−7, n = 1,038) and average genome sizes (FDR-corrected pairwise Wilcoxon tests, p-value < 2*10−16, n = 1,038) (Methods) between the clusters (Supplementary Table 2). (d) We found temperature and depth to be significantly different between the sample clusters identified based on biosynthetic potential composition (Kruskal Wallis test, p-value < 2*10−16, n = 1,038). RiPP - Ribosomally synthesized and Post-translationally modified Peptide; NRPS - Non-Ribosomal Peptide Synthetase; T1PKS - Type I Polyketide Synthase; T2/3PKS - Type II and III Polyketide Synthases. BGC length distributions across BGC classes are not significantly different (Wilcoxon test, significance denoted by ‘*’ with p-value < 10−5, n >> 30) between the set of BGCs studied in this work (antiSMASH) and the characterized BGCs in MIBiG with the exception of the polyketides and non-ribosomal peptide synthetases, which may be expected based on the particularly large clusters they can encompass (e) and the BGCs studied in this work (antiSMASH) to have a similar or higher number of genes than the characterized BGCs in MIBiG (f).
Extended Data Fig. 5
Extended Data Fig. 5. GCF novelty across latitude, depth layers and size fractions for each BGC class and distribution of nucleoside BGCs across genomic and metagenomic fragments.
(a) We estimated the discovery potential of different microbial communities by counting the number of new GCFs (Methods) detected in a sample after rarefaction of per-cell GCFs abundance profile to 2,000 cells. Although well studied communities (non-polar epipelagic prokaryote-enriched (0.2–3 µm) and virus-depleted (>0.2 µm)) displayed the highest discovery potential for terpenes, least explored communities (polar, deep, virus- and particle-enriched) were found to have the highest potential for NRPS, PKS, RiPPs or other natural products discovery. Polar is defined as absolute latitude > 60º. NRPS: Non-Ribosomal Peptide Synthetases; PKS: Polyketide Synthase; RiPP: Ribosomally Synthesized and Post-translationally modified Peptide. (b) An overview of the putative terpenoid diversity. A phylogenetic tree of all terpene biosynthetic core genes (as defined by antiSMASH) identified in the OMD, in the context of the 195 MIBiG terpene biosynthetic core genes, provides an overview of the terpenoid diversity and novelty. Briefly, the 31,398 terpene biosynthetic core genes identified across all predicted BGCs were filtered (length > = 120aa, removing < 2% of the sequences), dereplicated (using MMSEQS2 13.45111 clustering, 60% identity) into 2,904 protein sequences and aligned with the 195 MIBiG proteins using MAFFT v7.310. The resulting alignment was trimmed with trimal to remove positions with more than 50% gaps and used to build the tree using FastTree v2.1.10. The inner annotation layers indicate whether a gene is coming from a MIBIG cluster and if this one was annotated as a carotenoid or hopene cluster. The outer layers correspond to the biosynthetic core gene domain according to antiSMASH categories. Plants were used to root the tree. (c) Investigation of the proportion of BGCs binned within a MAG by product type showed that nucleosides were most rarely encoded in MAGs. (d) Breakdown by fragment type of the BGCs in the remaining metagenomic fragments. Strikingly, nucleoside BGCs were rarely encoded on predicted chromosome fragments and most often in predicted phage fragments (Supplementary Information). For this analysis, we refined the prediction described in Extended Data Fig. 2b with prophages (‘virsorter category = prophage & virsorter score > = 1 & eukrep = Prokarya & plasflow prediction != plasmid & cbar prediction != Plasmid’), phages (‘virsorter category = phage & virsorter score > = 1 & deepvirfinder p-value<0.01 & eukrep = Prokarya & plasflow prediction != plasmid & cbar prediction != Plasmid’) and putative phages (not in phages & ((‘virsorter category = phage & virsorter score > = 1) | deepvirfinder p-value<0.05) & eukrep != Eukarya & plasflow prediction != plasmid & cbar prediction != Plasmid’).
Extended Data Fig. 6
Extended Data Fig. 6. Manual inspection of Ca. Eudoremicrobiaceae MAGs and phylogeny of the duplicated marker gene COG0124.
(a, c–f) Anvi'o interface of representatives of the five Ca. Eudoremicrobiaceae species reveals stable abundance correlation patterns across the vast majority of the genomes, indicative of low contamination rates (Supplementary Information). (b) Inspection of the assembly graph for Ca. E. malaspinii (Supplementary Information) showed that all scaffolds from the representative genomes were connected with the exception of a single 20 kb one. (g) Investigating the evolutionary history of duplicated single-copy marker genes (here COG0124), we found consistent duplication across Ca. Eudoremicrobeaceae and the parent order UBP9, thus ruling out the duplication as a signal of contamination in the binning process. The different evolutionary history of the second copy of COG0124 (right-hand side of the tree), with closer relationship to Actinobacteria suggests that introgression events (including before the UBP9 and Ca. Eudoremicrobiaceae split) could be the origin of the increased genome size and biosynthetic potential observed in Ca. Eudoremicrobiaceae. (h) Similar patterns can be found in the second duplicated marker gene (COG0522), although duplication was not detected across all Ca. Eudoremicrobeaceae spp. representatives.
Extended Data Fig. 7
Extended Data Fig. 7. BGCs are the most differentially expressed genes in Ca. E. taraoceanii natural populations are expressed in natura across the Ca. Eudoremicrobiaceae family.
The 28 metatranscriptomic samples used for the Ca. E. taraoceanii expression analyses were selected based on the detection of at least 6 out of 10 universal single-copy marker genes. (a) Four discrete expression states explained 29.4% of the overall transcriptomic variance (PERMANOVA, p-value < 0.001, n = 28) across Ca. E. taraoceanii populations. One state (cluster 1) was exclusive to larger organismal size fractions. Leafs represent transcriptomic profiles and the dendrogram represents dimensionality-reduced distances (Methods). Genes associated with BGCs, secretion systems, degradative enzymes and predatory markers were differentially expressed across the states and represented the most discriminatory categories compared to 200 KEGG pathways (Supplementary Table 4). (b) We investigated the metagenomic detection of the 8,500 genes encoded by the Ca. E. taraoceanii representative, using methodology identical to the transcriptomic analyses (Methods). In samples where the 10 marker genes were detected, we counted the number of genes with one or more insert(s). We found that the 8,500 genes were detected in several ocean basins and different size fractions, with variation in detection rates likely due to variable sequencing depths across samples and datasets. This indicates, at least for the gene set covered by the reconstructed genome, that niche partitioning may be driven by gene expression changes rather than gene content variation. (c) Distribution of the number of genes depending on the number of samples they were detected in. (d) Number of genes detected across the different metatranscriptomic samples. All BGCs encoded by (e) Ca. Autonomicrobium septentrionale, (f) Ca. Amphithomicrobium indianii and (g) Ca. Amphithomicrobium mesopelagicum representatives were found to be expressed in the natural environment (in the 623 Tara Oceans metatranscriptomic samples,. Some displayed near constitutive expression while others appear to be tightly regulated across the metatranscriptomes studied here. Filled circles indicate samples where active transcription was detected. Orange data points indicate values below or above a log2 fold change from the constitutive expression rate of housekeeping genes. All the BGCs encoded by Ca. E. taraoceanii were also found to be expressed (Fig. 3c). The expression of Ca. E. malaspinii BGCs could not be investigated since that species was not sufficiently abundant in the epipelagic and mesopelagic ocean, the only layers for which metatranscriptomes were available.
Extended Data Fig. 8
Extended Data Fig. 8. Visual representations of BGCs encoded by Ca. E. malaspinii.
Visual representations and manual annotations of some Ca. Eudoremicorbium specific BGCs discussed in Supplementary Information, i.e. BGC 2.2 (a), BGC 54.1 (b) and BGC 34.1 (c). Colour-coding corresponds to predicted enzyme domains and modifications. These can be interactively explored here: https://sunagawalab.ethz.ch/share/microbiomics/ocean/db/1.0/marine_eremios/annotations/MALA_SAMN05422137_METAG_HLLJDLBE/antismash/MALA_SAMN05422137_METAG_HLLJDLBE-antismash/.
Extended Data Fig. 9
Extended Data Fig. 9. EmbM structural prediction and comparison to CylM (PDB: 5DZT); NMR and Mass spectrometry data for modified EmbA peptides.
(a) CylM crystal structure. Coloured domains are involved in phosphorylation/dehydration and the domain in grey is responsible for cyclization. (b) EmbM structure prediction, highlighting similarities to CylM. (c) CylM active site. Residues in pink are proposed to be involved in phosphorylation and residues in purple are necessary for elimination. (d) Modelled active site of EmbM. (e) Multiple sequence alignment showing that mutated residues in the catalytic site are conserved across the independent Ca. E. malaspinii reconstructions. (f) Overlay of 2D [13C,1H] HSQC spectra of EmbA and modified EmbA (EmbAM). Multiplicity editing leads to positive signals for CH and CH3 groups (EmbA: blue, EmbAM: red) and negative signals for CH2 groups (EmbA: cyan, EmbAM: magenta). Regions of interest are identified with boxes and major buffer signals are labelled. (g) Serine Cβ region. Serine Cβ moieties are identified by the negative sign of the signal (CH2-group), and the average chemical shift of 63.8 ppm. A change of the Cβ chemical shift of typically +3 ppm is expected upon a phosphorylation event, but there are no negative signals visible in the expected region in the EmbAM spectrum (grey box). (h) and (i): threonine Cγ and Cβ regions, respectively, as identified by chemical shift and sign of signals. In the EmbAM spectra, additional signals are visible at expected chemical shifts for phosphorylated threonine residues, i. e. at a 13C chemical shift of 20.5 ppm for Cγ (grey arrows in h) and 70 ppm for Cβ (grey arrows in i). (j) HR-MS/MS fragmentation of EmbA core at different modification stages (cleaved with LahT150). (k) Mass spectrum of dehydrated EmbA species: unmodified, single- and double dehydrated EmbA core (top); unmodified, single- and double dehydrated EmbA cleaved with trypsin (middle); and unmodified, single- and double dehydrated, DTT adduct of EmbA cleaved with trypsin (bottom).
Extended Data Fig. 10
Extended Data Fig. 10. In vitro EreM 13C-labelling experiments, NMR and MS2-fragmentation data; EreM phylogenetic tree; EreM synthetic core mass shifts and MS2-fragmentation data.
(a) Mass spectra of the LahT-digested, single methylated Nhis-EreA from in vitro EreM assays with 13C-labelled SAM (top, red) and non-labelled SAM (bottom, grey). Top: Mass spectrum of the LahT-released 48 aa long EreA core with an N-terminal extension of two glycine residues (m/z = 1471.1263 Da) and the corresponding 13C-labelled methylated (m/z = 1476.1310 Da) core with an N-terminal extension of two leader-derived glycine residues. The mass shift of 5.00 Da (z = 3) is highlighted by a red arrow. Bottom: Mass spectrum of the LahT-released 48 aa long EreA core with an N-terminal extension of two glycine residues (m/z = 1471.1272 Da) and the corresponding methylated (m/z = 1475.7971 Da) core with an N-terminal extension of two glycine residues. The mass shift of 4.67 Da (z = 3) is highlighted by a grey arrow. (b) MS2-fragmentation detected for the 13C-labelled core with an N-terminal extension of two glycine residues (m/z = 1476.1310 Da). All y-ions show masses corresponding to fragments with the addition of a 13C-labelled methyl group (red). All b-ions show masses corresponding to a fragment with no modification (black). The resulting fragmentation pattern suggests 13C-labelled methylation at the C-terminal cysteine residue (red box). MS2-fragmentation data are available in Supplementary Table 5. (c) Overlay of a C-H decoupled (red) and standard (blue) proton NMR of an in vitro EreM assay with 13C-labelled SAM. The peak splitting of the singlets at 2.03 ppm and 2.88 ppm indicates the 13C-H bonds for these protons. (d) HSQC NMR of an in vitro EreM assay with 13C-labelled SAM. The spectrum shows two single signals at 2.03/17.3 ppm (yellow box) and 2.88/25.9 ppm (red box). Another four signals are detected downfield: 3.46/70.0 ppm, 3.55/70.0 ppm, 3.64/62.2 ppm and 3.69/74.6 ppm (grey box). Comparison with the literature suggest the presence of a 13C-S bond at 2.03/17.3 ppm (yellow box) from residual 13CH3-l-methionine and of a 13C-N bond at 2.88/25.9 ppm (red box) from a methylated amide. The remaining four signals are suggested to originate from the Tris-buffer of the reaction mixture (grey box). (e) Maximum-likelihood tree of FkbM-family methyltransferase (PF05050) Hidden Markov Model (HMM) hits within BGCs for natural products in the MIBiG 2.0 database (Supplementary Table 5). Outgroups involved in proteusin biosynthesis from a different methyltransferase protein family (PF05175) are shown in grey text. Branch support values are estimated using the 5,000 ultrafast bootstrap approximation in IQ-TREE 2. Letter in ‘MT-type’ column indicates documented N- or O-methyltransferase activity from publications based on genetic knockout or heterologous expression studies (coloured) or bioinformatic evidence, biosynthetic logic, and final natural product structure (grey). To date, EreM from this study is the only FkbM-family enzyme with reported N-methyltransferase activity in a characterized biosynthetic pathway. Coloured points in BGC type columns indicate the majority of FkbM-family enzymes are contained with PKS, NRPS, or Other (e.g., nucleoside antibiotic) biosynthetic pathways. Thus EreM is also the only FkbM-family methyltransferase characterized in a RiPP cluster to date. (f) EreA core variants generated in this study. Mutation or truncation sites are highlighted in yellow. (g) Mass shifts of +14.01 Da corresponding to methylation of the EreA core and variants were observed expressed with EreM as compared to controls without EreM (data not shown for core variants, but results are in accordance with natural core control). All EreA variant + EreM co-productions were tested with and without EreD, but EreD co-productions are pictured. since epimerized (EreA + EreD) cores have better solubility and higher concentrations. (h) Proteinase K-generated fragments of the wild-type EreA core following co-productions with EreIMD reveal a mixture of variable methylation patterns. (i) MS2-fragmentation of the wild-type EreA core after co-production with EreIMD. Mass shifts corresponding to up to 6 non-radical methylations (+84.09 Da) were observed and were localized to valine residues (highlighted in light blue, N-Me). Dashed lines around boxes indicate uncertainty regarding the position. MS2-fragmentation data are in Supplementary Table 5.
Extended Data Fig. 11
Extended Data Fig. 11. EreI mass shift and high resolution tandem mass spectroscopy (MS2); EreD retention time shift and ODIS and advanced Marfey's analysis for d-Val/d-Ala.
(a) Mass spectra and MS2-fragmentation of the LahT-digested Nhis-EreA modified by EreI, EreM, and EreD. Bottom: A mass shift of +15.99 Da corresponding to incorporation of one oxygen into the mono-methylated core (EreA + EreIMD, [M+3H+]3+ = 1443.1060 Da) was observed after co-expressions of ereAIMD. Top: No oxygen incorporation was observed in Nhis-EreA modified by EreM and EreD (EreA + EreMD) controls lacking the aspartinyl-asparaginyl β-hydroxylase protein family protein, EreI. Notably, the +15.99 Da modification was only observed on methylated, LahT-released EreA cores ([M+3H+]3+ = 1437.7754 Da) and not on the non-methylated core ([M+3H+]3+ = 1433.1124 Da) as observed by in vivo ereAI or ereAID co-expressions and in vitro assays with purified NHis-EreI and Nhis-EreA or Nhis-EreA modified by EreD. (b) MS2-fragmentation of [M+3H+]3+ = 1443.1060 Da. The data localize oxygen (Ox) incorporation to the C-terminus of the peptide but cannot distinguish between terminal cysteine (C46) or valine (V45). MS2-fragmentation data including calculated and observed masses for all b- and y- ions are available in Supplementary Table 5. (c) Extracted ion chromatograms (EICs) at 1433.1123 Da of LahT-digested precursors Nhis-EreA (black trace, top) and epimerized Nhis-EreA from co-productions with radical SAM epimerase EreD (orange trace, bottom), which show a retention time shift of 0.47 min. No mass shift was observed, since l- to d- amino acid epimerization is a mass-neutral modification, requiring the use of the orthogonal D2O induction systems (ODIS) to localize epimerization sites. (d) MS2-fragmentation of m/z = 1447.47308 Da patterns enabled localization of epimerized residues to V10, A12, A14, V16, V18, V29 (orange asterisks) and either V44 or V45 (grey asterisk). MS2-fragmentation data are available in Supplementary Table 5. (e) Expressions using ODIS results in a shift of +7.04 Da corresponding to the incorporation of 7 deuterium atoms. A mixture of products is observed due to slowdown of epimerization in the presence of deuterium. (f) EICs from advanced Marfey’s analysis of epimerized and modified cores from two heterologous hosts: E. coli (pink) and M. aerodenitrificans (light and dark blue) consistently yielded d-Val and d-Ala (grey shading) as the only d-amino acids detected in EreA cores, as compared to d-Thr, d-Asp, and d-Ser standards (not shown), for which no corresponding peaks were detected. Both d-Val and d-Ala were measured in ratios of 1:3 to their l-amino acid counterparts. Based on EreA core amino acid composition, these ratios correspond to approximately 2 d-Ala and 5 d-Val per core consistent with ODIS results.
Extended Data Fig. 12
Extended Data Fig. 12. EreB mass shift, MS2-fragmentation data and advanced Marfey's analysis for tert-Leu.
(a) Co-production of Nhis-EreA with epimerase EreD and the B12-dependent radical SAM C-methyltransferase EreB in M. aerodenitrificans Δaer with a knocked-out aeronamide BGC yielded a mixture of C-methylated products with mass shifts corresponding to up to 7 methylations (+98.13 Da). (b) Alignment of a mixture of differently-modified fragments detected by MaxQuant analysis of proteinase K digested Nhis-EreA following co-productions with EreDB. (c) Representative MS2-fragmentation of EreA core following co-production with EreDB at m/z = 1466.4819 Da. Observed and calculated masses for b- and y-ions are in Supplementary Table 5. Modification sites (dark blue, C-Me) were localized to V9, V13, V15, V35, V37, V44, and V45. (d) Total ion chromatogram (TIC, black) and EICs from advanced Marfey’s analysis of C-methylated core from co-productions of EreA + EreDB in M. aerodenitrificans. The unspiked sample (dark grey) is compared to identical samples that were spiked with synthetic standards: tert-Leu (orange), l-Leu (blue), allo-Ile (brown), and dl-Ile (purple). The grey box is an inset on a narrower retention time from the left panel highlighting a peak shoulder from the M. aerodentrificans EIC corresponding to tert-Leu (yellow shading).

Comment in

  • Charting the world's microbiomes.
    Koch L. Koch L. Nat Rev Genet. 2022 Sep;23(9):523. doi: 10.1038/s41576-022-00520-6. Nat Rev Genet. 2022. PMID: 35821096 No abstract available.

References

    1. Hug LA, et al. A new view of the tree of life. Nat. Microbiol. 2016;1:16048. - PubMed
    1. Newman DJ, Cragg GM. Natural products as sources of new drugs over the nearly four decades from 01/1981 to 09/2019. J. Nat. Prod. 2020;83:770–803. - PubMed
    1. Adrio JL, Demain AL. Microbial enzymes: tools for biotechnological processes. Biomolecules. 2014;4:117–139. - PMC - PubMed
    1. Medema MH, de Rond T, Moore BS. Mining genomes to illuminate the specialized chemistry of life. Nat. Rev. Genet. 2021;22:553–571. - PMC - PubMed
    1. Cavicchioli R, et al. Scientists’ warning to humanity: microorganisms and climate change. Nat. Rev. Microbiol. 2019;17:569–586. - PMC - PubMed