. 2022 Jul;607(7917):104-110.
doi: 10.1038/s41586-022-04860-5. Epub 2022 Jun 22.

PIEZO1 transduces mechanical itch in mice

Affiliations

PIEZO1 transduces mechanical itch in mice

Rose Z Hill et al. Nature. 2022 Jul.

Abstract

Itch triggers scratching, a behavioural defence mechanism that aids in the removal of harmful irritants and parasites1. Chemical itch is triggered by many endogenous and exogenous cues, such as pro-inflammatory histamine, which is released during an allergic reaction1. Mechanical itch can be triggered by light sensations such as wool fibres or a crawling insect2. In contrast to chemical itch pathways, which have been extensively studied, the mechanisms that underlie the transduction of mechanical itch are largely unknown. Here we show that the mechanically activated ion channel PIEZO1 (ref. 3) is selectively expressed by itch-specific sensory neurons and is required for their mechanically activated currents. Loss of PIEZO1 function in peripheral neurons greatly reduces mechanically evoked scratching behaviours and both acute and chronic itch-evoked sensitization. Finally, mice expressing a gain-of-function Piezo1 allele4 exhibit enhanced mechanical itch behaviours. Our studies reveal the polymodal nature of itch sensory neurons and identify a role for PIEZO1 in the sensation of itch.


Conflict of interest statement

The authors declare no competing interests.

Figures

Fig. 1
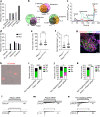
Fig. 1. PIEZO1 is expressed in mouse and human putative itch receptors.
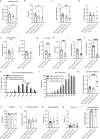
ac, Representative images (five images from two mice) of sectioned mouse DRG smFISH for Piezo1 (a), Nppb (b) and merged with DAPI (c). White arrowheads indicate Piezo1+ or Nppb+ cells. d, Quantification of mouse DRG smFISH images showing the percentage of cells expressing a given marker (bar labels) that were co-labelled with Piezo1 transcript. The number of analysed neurons is indicated above the bar (four to six images per marker from two mice). e, Data from d presented as the percentage of Piezo1+ neurons that co-express a given marker. f, Percentage of Nppb+ neurons expressing Piezo1 or Piezo2. g, Comparison of Piezo2 expression in Nppb+ versus Mrgpra3+ neurons. h, Quantification of human smFISH images (seven to eight images per marker from one donor; see Extended Data Fig. 4a,b). il, Representative images of sectioned mouse DRGs labelled with antibodies against tdTomato (images show PIEZO1 (i), PECAM1 (j), neurofilament H (NEFH; k) and the merged image (l)). Asterisks indicate blood vessels and arrowheads indicate a PIEZO1+ neuron and nerve fibre. The experiment was repeated one additional time. All images are presented as maximum intensity z-projections of confocal images. Scale bars, 100 µm.
Fig. 2
Fig. 2. PIEZO1 is functionally expressed in a subset of putative itch neurons.
a, Percentage of wild-type neurons responding to compounds (2,682 neurons from 3 mice). AITC, allyl isothiocyanate. b, Venn diagrams of response overlap from combined wild-type data in a and d, indicating the percentage of total neurons. c, Traces of representative calcium signals from b. Arrowheads indicate compound addition. d, Percentage of neurons responding in Piezo1fl/fl;PirtCre−/− (wild type; WT) versus Piezo1fl/fl;PirtCre+/− (KO) neurons (1,883 WT and 2,218 KO neurons from 2 mice per genotype). e, Area under the curve of Piezo1+/+ versus Piezo1GOF/GOF responses to 20 µM Yoda1 (Mann–Whitney: ****P < 0.0001, U = 102,979; n = 347 +/+ and 711 GOF/GOF neurons from 2 mice per genotype). f, Peak normalized F340/F380 ratio of Piezo1+/+ versus Piezo1GOF/GOF mice from data in e (Mann–Whitney: *P = 0.0142, U = 121,046; n = 347 +/+ and 768 GOF/GOF neurons from 2 mice). In e,f, the centre line denotes the median, the boxes are the 25th and 75th percentiles and the whiskers indicate 1.5 times the interquartile range. g, Representative immunohistochemistry (IHC) section (of three sections from two mice) of Ai9fl/fl;SstCre+/ DRG neurons showing native tdTomato (expressed in SST+ cells) with the indicated markers (scale bar, 100 µm). h, Dissociated Ai9fl/fl;SstCre+/ DRG neurons. ik, Summary of mechanically activated (MA) current inactivation kinetics in whole-cell poke experiments after nucleofection of Ai9fl/fl;SstCre+/ DRG neurons with the indicated siRNA mix against non-targeting control siRNA or against Piezo1 (i; ****P < 0.0001, χ2 = 23.92, degrees of freedom (df) = 3; n = 28 control and 32 Piezo1 siRNA cells), Piezo2 (j; *P = 0.0130, χ2 = 10.78, df = 3; n = 32 control and 31 Piezo2 siRNA cells) and Piezo1 + Piezo2 (k; ****P < 0.0001, χ2 = 36.21, df = 3; n = 30 control and 33 Piezo1 + Piezo2 siRNA cells). Chi-squared (χ2) tests were performed. IA, intermediately adapting; NR, non-responsive; RA, rapidly adapting; SA, slowly adapting. ln, Representative 150-ms indentation traces (top) and MA currents (bottom) from ij with nucleofection of indicated siRNA (from two mice each). All statistical tests are two-tailed where applicable. n indicates biological replicates (cells). Source data
Fig. 3
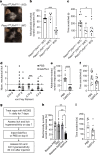
Fig. 3. Neuronal PIEZO1 is required for mechanically evoked scratching and histamine alloknesis in mice.
a, Illustration of the nape model of mechanical itch. b, Mechanical itch model in Piezo1fl/fl or Piezo1fl/+;PirtCre−/ (WT; n = 11), Piezo1fl/+;PirtCre+/ (heterozygous (HET); n = 6) and Piezo1fl/fl;PirtCre+/ (KO; n = 8) mice (two-way ANOVA: ****Pgenotype < 0.0001, F(2, 22) = 17.88; Sidak’s Padjusted: **P0.07g = 0.0017, ***P0.16g = 0.0003, ***P0.4g = 0.0005). c, Cumulative per cent scratch responses from b (Kruskal–Wallis: ***P = 0.0007, χ2 = 14.52; Dunn’s ***Padjusted = 0.0008). d, Histamine alloknesis (Kruskal–Wallis: ***P = 0.0003, χ2 = 16.43; Dunn’s: ***Padjusted = 0.0001) from mice in b. Data in bd are from three experiments. e, Mechanical itch model in Piezo1fl/fl;SstCre−/− (WT; n = 8) and Piezo1fl/fl;SstCre+/ (KO; n = 10) mice (two-way ANOVA: ****Pgenotype < 0.0001, F(1, 17) = 44.87; Sidak’s Padjusted: **P0.07g = 0.0086, ***P0.16g = 0.0002, **P0.4g = 0.0027). f, Cumulative per cent scratch responses from e (Mann–Whitney: ****P < 0.0001, U = 0). g, Histamine alloknesis (Mann–Whitney: ****P < 0.0001, U = 0) from mice in e. Data in eg are from two experiments. h, Cheek model of Yoda1-evoked itch (Kruskal–Wallis: ****P < 0.0001, χ2 = 12.88; Dunn’s: **Padjusted = 0.0014; n = 4 mice from 1 experiment). No wiping was observed. i, Nape model of Yoda1-evoked itch (Mann–Whitney: ***P = 0.0003, U = 1; n = 8 mice from 1 experiment). j, Nape model of itch (50 µM Yoda1) in Piezo1fl/fl or Piezo1fl/+;PirtCre−/− (WT) and Piezo1fl/fl;PirtCre+/− (KO) mice (Mann–Whitney: ***P = 0.0004, U = 0; n = 9 WT and 6 KO mice from 2 experiments). k, Mechanical itch model in Piezo1+/+ (PIEZO1WT; n = 9) and Piezo1GOF/GOF or Piezo1GOF/+ (PIEZO1GOF; n = 17) mice (two-way ANOVA: ****Pgenotype < 0.0001, F(1, 25) = 24.16; Sidak’s Padjusted: *P0.16g = 0.0493, *P0.4g = 0.0441, ***P0.6g = 0.0008). l, Cumulative per cent scratch responses from k (Mann–Whitney: **P = 0.0013, U = 14). Error bars represent mean ± s.e.m. of n biological replicates (mice) and statistical tests are two-tailed where applicable. Data in kl are from three experiments. Source data
Fig. 4
Fig. 4. Neuronal PIEZO1 mediates itch hypersensitivity in a mouse model of chronic itch.
a, Representative images (n = 12 WT and n = 9 KO mice from two experiments) of nape skin of Piezo1 fl/fl;PirtCre+/− (KO; top) and Piezo1fl/fl;PirtCre−/− (WT; bottom) littermates on day 8 of the MC903 model. b, MC903-evoked mechanical itch hypersensitivity in Piezo1fl/fl or Piezo1fl/+;PirtCre−/− (WT), Piezo1fl/+;PirtCre+/− (HET) and Piezo1fl/fl;PirtCre+/− (KO) mice (Kruskal–Wallis: ***P = 0.0002, χ2 = 17.36; Dunn’s: ***Padjusted = 0.0004). c, MC903 spontaneous scratching (Kruskal–Wallis: *P = 0.0444, χ2 = 6.231; Dunn’s: *Padjusted = 0.0319). Data in b,c are from n = 12 WT, n = 5 HET and n = 9 KO mice from two experiments. d, Mechanically evoked scratching after injection of phosphate-buffered saline (PBS) or GsMTx4 in wild-type mice, normalized to baseline; see also Extended Data Fig. 9b (three-way ANOVA: ****Ptreatment < 0.0001, F(1, 104) = 51.38; Tukey’s Padjusted: ***P0.16g = 0.0002, *P0.4g = 0.0260; n = 14 mice). e, Histamine alloknesis (Mann–Whitney: ****P < 0.0001, U = 0; n = 14 mice). f, Histamine-evoked scratching (Mann–Whitney: P = 0.0709, U = 58.50; n = 14 mice). Data in df are from two experiments. g, Schematic of MC903 chronic itch model experiments with acute GsMTx4. h, MC903 itch hypersensitivity before and after injection of PBS or GsMTx4 (Kruskal–Wallis: **P = 0.0013, χ2 = 15.66; Dunn’s (left to right): **Padjusted = 0.0063, **Padjusted = 0.0066, *Padjusted = 0.01; n = 8 mice). i, MC903 spontaneous scratching after injection of PBS or GsMTx4 (Mann–Whitney: P = 0.1848, U = 19; n = 8 mice). Data in hi are from two experiments. Error bars represent mean ± s.e.m. of n biological replicates (mice) and statistical tests are two-tailed where applicable. Source data
Extended Data Fig. 1
Extended Data Fig. 1. Expression of Piezo1 in pruriceptive sensory neurons.
Single-cell RNA-seq data from a previous report presented as a force-directed layout showing expression of Piezo1 in the cluster containing Sst/Nppb+ DRG neurons (inset). Downloaded from: https://kleintools.hms.harvard.edu/tools/springViewer_1_6_dev.html?datasets/Sharma2019/all.
Extended Data Fig. 2
Extended Data Fig. 2. Expression of Piezo genes in nociceptive sensory neurons.
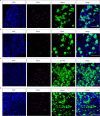
ad, Representative images (see Fig. 1d, e, 4–6 images per marker from 2 mice) of sectioned mouse DRG processed for smFISH of Piezo1 (ad), Mrgprd (a), Calca (b), Scn10a (c), and Piezo2 (d) with DAPI stain and merged image. Scale = 100 µm.
Extended Data Fig. 3
Extended Data Fig. 3. Expression of Piezo genes in pruriceptive sensory neurons.
a,b, Representative images (see Fig. 1d–g, 4–6 images per marker from 2 mice) of sectioned mouse DRG processed for smFISH of Mrgpra3 (a, b), Nppb (a, b), Piezo1 (a), and Piezo2 (b) with DAPI stain in the merged image. Scale = 100 µm.
Extended Data Fig. 4
Extended Data Fig. 4. Expression of PIEZO genes in human DRG.
a, Representative image (see Fig. 1h, 7-8 images per marker from 1 donor) of sectioned T1 human DRG smFISH for PIEZO1 (magenta) and NPPB (green), and merged image with DAPI (blue). b, Representative image (see Fig. 1h) of sectioned T1 human DRG smFISH for PIEZO2 (magenta) and NPPB (green), and merged image with DAPI (blue). Asterisks denote lipofuscin signal and arrowheads denote PIEZO+NPPB+ cells. Scale = 100 µm.
Extended Data Fig. 5
Extended Data Fig. 5. Expression of PIEZO1 in somatosensory neurons.
a, Sectioned PIEZO1tdTomato mouse trigeminal ganglia labelled with antibodies against NEFH, PECAM1, and tdTomato (PIEZO1), and merged image. b, Sectioned PIEZO1tdTomato mouse trigeminal nerve labelled with antibodies against NEFH, PECAM1, and tdTomato (PIEZO1), and merged image. c, Sectioned wild-type mouse trigeminal ganglia labelled with antibodies against NEFH, PECAM1, and tdTomato, and merged image. Asterisks indicate PECAM1+ blood vessels and arrowheads indicate PIEZO1+ neurons and nerve fibres. All images are presented as maximum intensity z-projections of confocal images; scale bars = 100 µm. Experiment was repeated one additional time.
Extended Data Fig. 6
Extended Data Fig. 6. Additional Ca2+ imaging and electrophysiology for tdTomato+ DRG neurons.
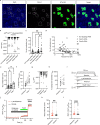
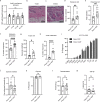
a, Representative smFISH images (from 2 mice) of Ai9fl/fl; SstCre+/- DRG for Piezo1 (magenta) and tdTomato (green) with DAPI and merged image. Scale = 100 µm. b, Imax of MA currents in neurons nucleofected with the indicated siRNA pools. Cells that exhibited no MA currents were not included for analysis (One-way ANOVA: p = 0.6616; F(3, 76) = 0.5321). Number of responding cells is indicated from 2 mice per condition. c, τinactivation of MA currents from b (One-way ANOVA: **p = 0.0021; F(3, 76) = 5.352; Tukey’s (left to right): **p = 0.0026; *p = 0.0346; *p = 0.0270). d, Imax vs. τinactivation of MA currents from b and c, with non-targeting siRNA n (black circles) pooled between Piezo1 (white squares) and Piezo2 (grey triangles) knockdown experiments. Dotted lines denote limits for SA, IA, and RA current categories. e, τinactivation of MA currents in neurons before (baseline), during 100 µM histamine treatment, washout, and with 10 µM Yoda1 treatment (repeated measures ANOVA: **p = 0.0077; F(2,11) = 10.11; Dunnett’s: *phistamine = 0.0281; *pYoda1 = 0.0115). f, data in e presented as the % change in τinactivation compared to baseline (0%). g, Imax of MA currents from e (repeated measures ANOVA: p = 0.0714; F(2,11) = 3.737). h, data in g represented as % change in Imax compared to baseline (0%). eh are from n = 12 cells from 2 mice. i, representative traces from experiments in eh, with indentation trace shown at top. j, Normalized Fura2 ratio plotted over time with addition of Yoda1 following 5 min pre-incubation in 1 µM histamine or vehicle. Some neurons had a delayed response to Yoda1 which is indicated in the biphasic curves for histamine and vehicle. Broken axis indicates 3 min of elapsed time during incubation. k, area under the curve for calcium imaging data in j (Mann–Whitney: **p = 0.0021, U = 5596). l, maximum normalized Fura2 ratio for calcium imaging data in j (Mann–Whitney: ***p = 0.0005, U = 5384). jl are from n = 120 histamine and 121 vehicle neurons from 2 mice. Error bars represent mean ± s.e.m. of n biological replicates (cells) and statistical tests are two-tailed where applicable. Source data
Extended Data Fig. 7
Extended Data Fig. 7. Additional somatosensory behaviours in Piezo1fl/fl;PirtCre mice.
a, Histamine-evoked itch (Kruskal–Wallis: *p = 0.0386; χ2 = 6.510; Dunn’s: *padjusted = 0.0216). b, Total scratch bouts following histamine (Kruskal–Wallis: *p = 0.0296; χ2 = 7.043; Dunn’s: *p = 0.0165). c, Mean bouts per episode from a (Kruskal–Wallis: **p = 0.0047; χ2 = 10.73; Dunn’s: **padjusted = 0.0021). d, Scratch episodes following histamine (Kruskal–Wallis: p = 0.9401; χ2 = 0.1234). ad are from n =11 WT, n = 6 HET, and n = 8 KO mice from 3 experiments. e, Chloroquine-evoked itch (Mann–Whitney: p = 0.8078; U = 50, n = 12, 9). f, Total scratch bouts following chloroquine (Mann–Whitney: p = 0.6511; U = 47). e-f are from n = 12 WT and n = 9 KO mice from 2 experiments. g, IL-31-evoked itch (Mann–Whitney: ***p = 0.0008; U = 16.50, n = 11, 13). h, Total scratch bouts following IL-31 (Mann–Whitney: ***p = 0.0009; U = 17). i, Mean bouts per episode from g (Mann–Whitney: ****p < 0.0001; U = 0.5). j, IL-31-evoked alloknesis (Mann–Whitney: ****p < 0.0001; U = 0). g-i are from n = 11 WT and n = 13 KO mice from 2 experiments. k, Ear model of mechanical itch (Two-way ANOVA: ***pgenotype = 0.0002; F(2, 22) = 12.93; Sidak’s padjusted: *p0.16g = 0.0214; ****p0.4g < 0.0001, n = 11 WT, n = 6 HET, and n = 8 KO mice from 3 experiments). l, % withdrawal response (Two-way ANOVA: ***pgenotype = 0.0007; F(2, 29) = 9.524; Dunn’s **padjusted = 0.0014). m, 50% withdrawal von Frey threshold (Kruskal–Wallis: ***p = 0.0002; χ2 = 16.71; Dunn’s: ***p = 0.0007). n, Pinprick response (Kruskal–Wallis: p = 0.2568; χ2 = 2.719). o, Pinprick latency (Kruskal–Wallis: p = 0.3500; χ2 = 2.100, N = 11 WT, N = 6 HET, and N = 8 KO mice from 3 experiments). p, Randall–Selitto (Kruskal–Wallis: p = 0.2225; χ2 = 3.006). q, Tail clip (Kruskal–Wallis: p = 0.2505, χ2 = 2.769). Data in ln and p,q are from n = 16 WT, n = 6 HET, and n = 10 KO mice from 4 experiments. r, Proprioception scores (Mann–Whitney: p = 0.6430, U = 57, n = 10, 13 mice from 1 experiment). Error bars represent mean ± s.e.m. of n biological replicates (mice) and statistical tests are two-tailed where applicable. Source data
Extended Data Fig. 8
Extended Data Fig. 8. Additional somatosensory behaviours in Yoda1-injected and PIEZO1GOF mice.
a, 50% withdrawal threshold in wild-type mice measured before (baseline) and after intraplantar injection of Yoda1 at indicated minutes post-injection (mpi) (Friedman: p = 0.5433; Friedman statistic = 2.143, n = 7 mice from 1 experiment). b, Skin section from Yoda1-injected mouse stained with H&E (representative of 5 mice, scale = 100 µm). c, Skin section from vehicle-injected mouse stained with H&E (representative of 5 mice, scale = 100 µm). d, Histamine-evoked itch (Mann–Whitney: **p = 0.0045; U = 30). e, Scratch episodes following histamine in d (Mann–Whitney: **p = 0.0018; U = 25.50). f, Histamine alloknesis (Mann–Whitney: ****p < 0.0001; U = 10). df are from n = 10 WT and n = 17 GOF mice from 3 experiments. g, Yoda1-evoked itch in Piezo1+/+ and Piezo1GOF/GOF or Piezo1GOF/+ male and female mice (Mann–Whitney: *p = 0.0180; U = 14.50). h, Yoda1 alloknesis (Mann–Whitney: ****p < 0.0001; U = 0). i, % withdrawal response (Two-way ANOVA: pgenotype = 0.6151; F(1, 25) = 0.2592). Data in g,h are from n = 7 WT and n = 12 GOF mice from 2 experiments. j, 50% withdrawal von Frey threshold (Mann–Whitney: *p = 0.0276; U = 41.50). k, Pinprick response (Mann–Whitney: p = 0.5350; U = 73). l, Randall–Selitto (Mann–Whitney: p = 0.9411; U = 83). m, Tail clip (Mann–Whitney: p = 0.5152; U = 73.50). Data in im are from n = 10 WT and n = 17 GOF mice from 3 experiments. Error bars represent mean ± s.e.m. of n biological replicates (mice) and statistical tests are two-tailed where applicable. Source data
Extended Data Fig. 9
Extended Data Fig. 9. Additional MC903 and GsMTx4 scratching behavioural data.
a, Mean bouts per scratch episode from Piezo1fl/fl; PirtCre mice shown in Fig. 4c (Kruskal–Wallis: *p = 0.0359; χ2 = 6.656; Dunn’s *padjusted = 0.0279). Data are from n = 12 WT, n = 5 HET, and n = 9 KO mice from 2 experiments. b, Non-normalized data from the nape mechanical itch assay replotted with values and statistical test results (* symbols) representing P values from Fig. 4d (n = 14 mice from 2 experiments). Error bars represent mean ± s.e.m. of n biological replicates (mice) and statistical tests are two-tailed where applicable. Source data
Extended Data Fig. 10
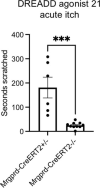
Extended Data Fig. 10. Chemogenetic activation of MRGPRD+ neurons evokes scratching.
Cheek model of DREADD agonist 21-evoked itch in HM3dGqfl/fl; MrgprdCreERT2+/- and -/- mice (Mann–Whitney: ***p = 0.0002; U = 0, n = 6,10 mice from 1 experiment). Error bars represent mean ± s.e.m. of n biological replicates (mice) and statistical tests are two-tailed where applicable. Source data

Comment in

References

    1. Lay M, Dong X. Neural mechanisms of itch. Annu. Rev. Neurosci. 2020;43:187–205. - PubMed
    1. Sakai K, Akiyama T. New insights into the mechanisms behind mechanical itch. Exp. Dermatol. 2020;29:680–686. - PMC - PubMed
    1. Coste B, et al. Piezo1 and Piezo2 are essential components of distinct mechanically activated cation channels. Science. 2010;330:55–60. - PMC - PubMed
    1. Ma S, et al. Common PIEZO1 allele in African populations causes RBC dehydration and attenuates Plasmodium infection. Cell. 2018;173:443–455. - PMC - PubMed
    1. Huang J, et al. Circuit dissection of the role of somatostatin in itch and pain. Nat. Neurosci. 2018;21:707–716. - PMC - PubMed