. 2022 Jun;606(7916):945-952.
doi: 10.1038/s41586-022-04844-5. Epub 2022 Jun 22.

Clonally expanded CD8 T cells characterize amyotrophic lateral sclerosis-4

Affiliations

Clonally expanded CD8 T cells characterize amyotrophic lateral sclerosis-4

Laura Campisi et al. Nature. 2022 Jun.

Erratum in

  • Author Correction: Clonally expanded CD8 T cells characterize amyotrophic lateral sclerosis-4.
    Campisi L, Chizari S, Ho JSY, Gromova A, Arnold FJ, Mosca L, Mei X, Fstkchyan Y, Torre D, Beharry C, Garcia-Forn M, Jiménez-Alcázar M, Korobeynikov VA, Prazich J, Fayad ZA, Seldin MM, De Rubeis S, Bennett CL, Ostrow LW, Lunetta C, Squatrito M, Byun M, Shneider NA, Jiang N, La Spada AR, Marazzi I. Campisi L, et al. Nature. 2022 Aug;608(7924):E34. doi: 10.1038/s41586-022-05184-0. Nature. 2022. PMID: 35945277 Free PMC article. No abstract available.

Abstract

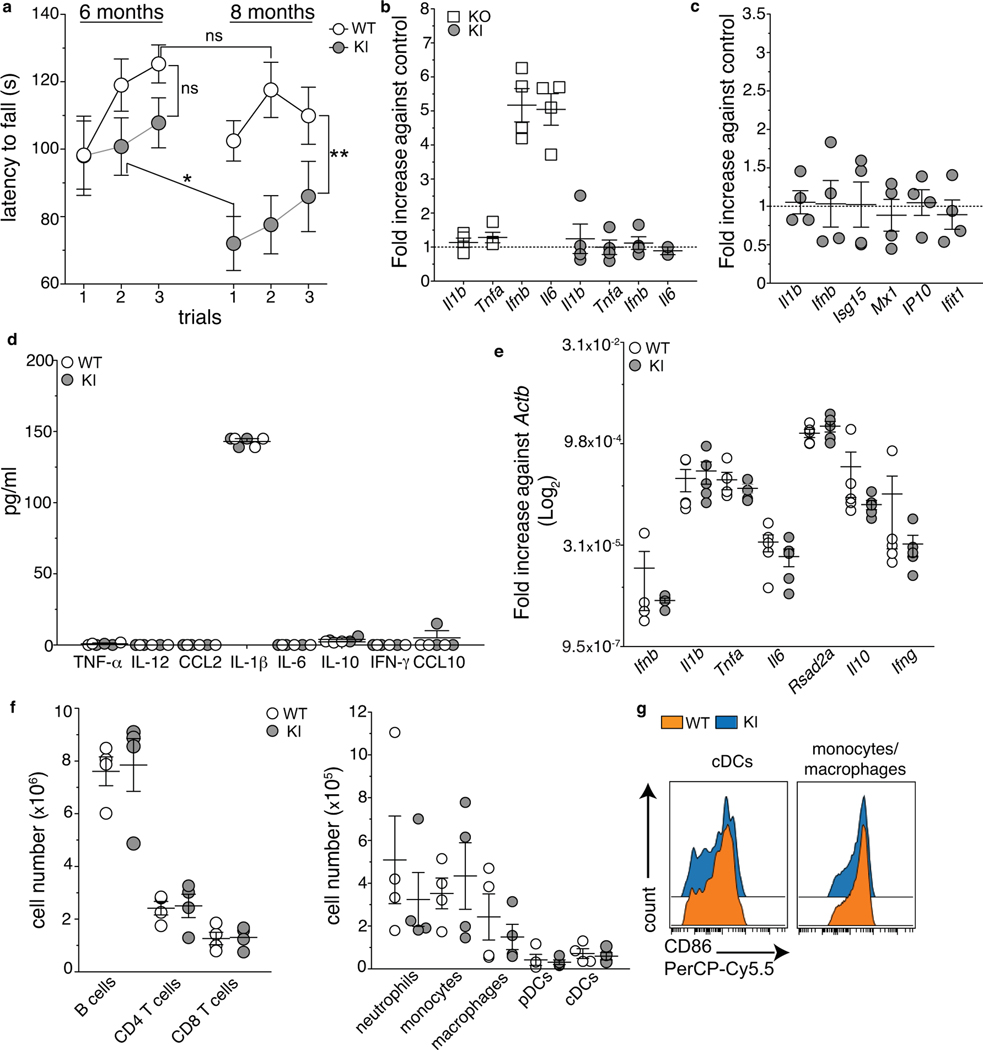
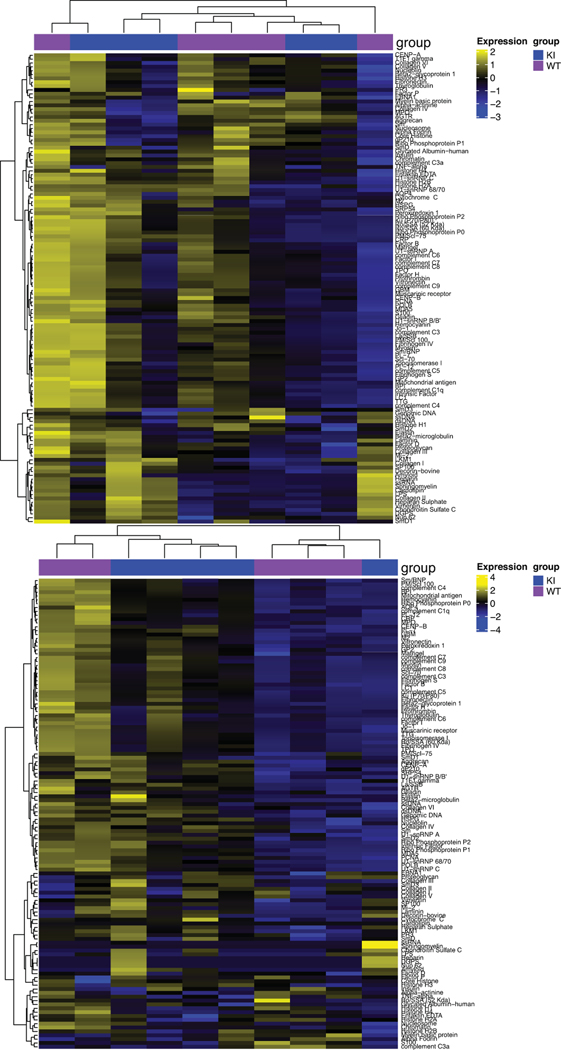
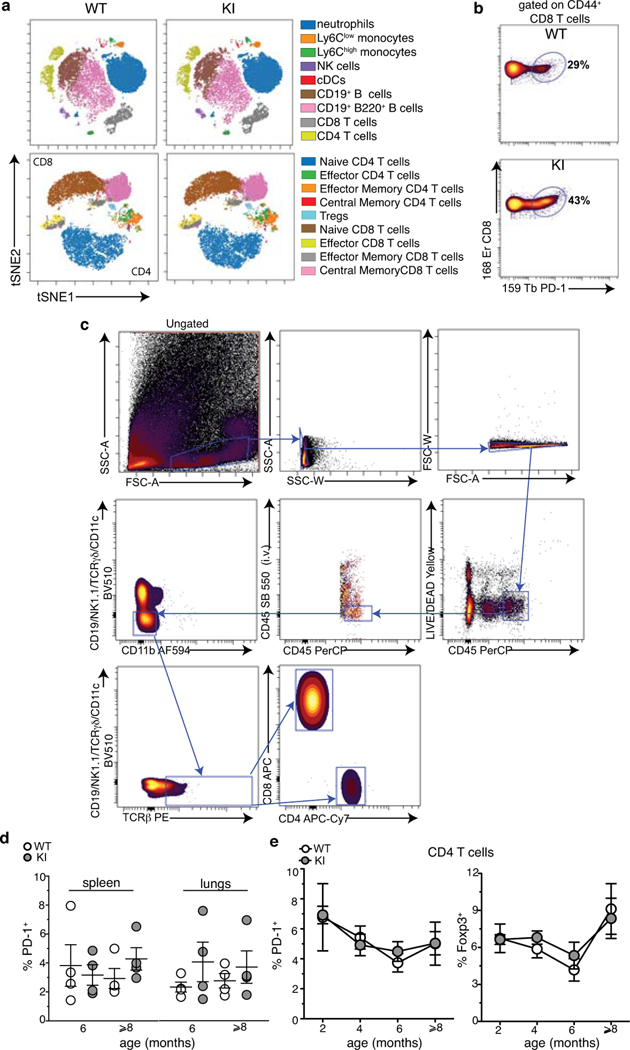
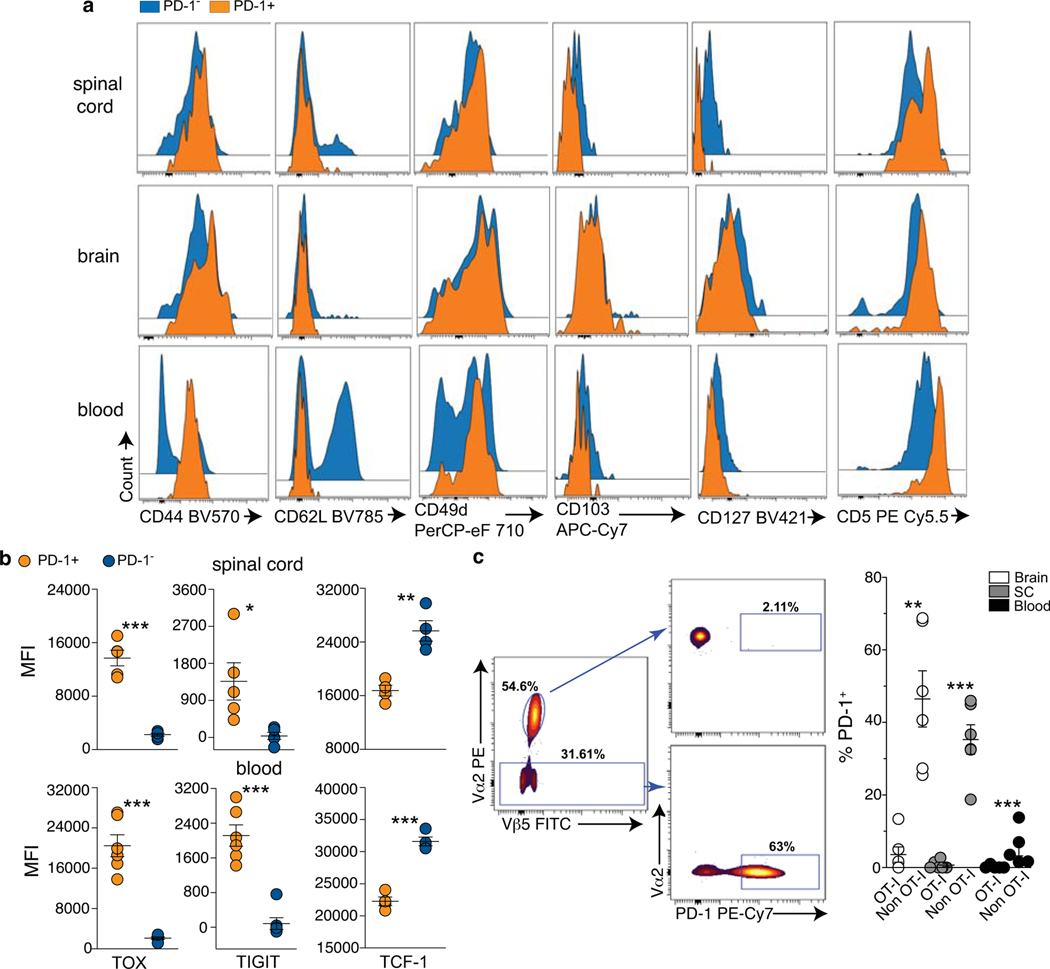
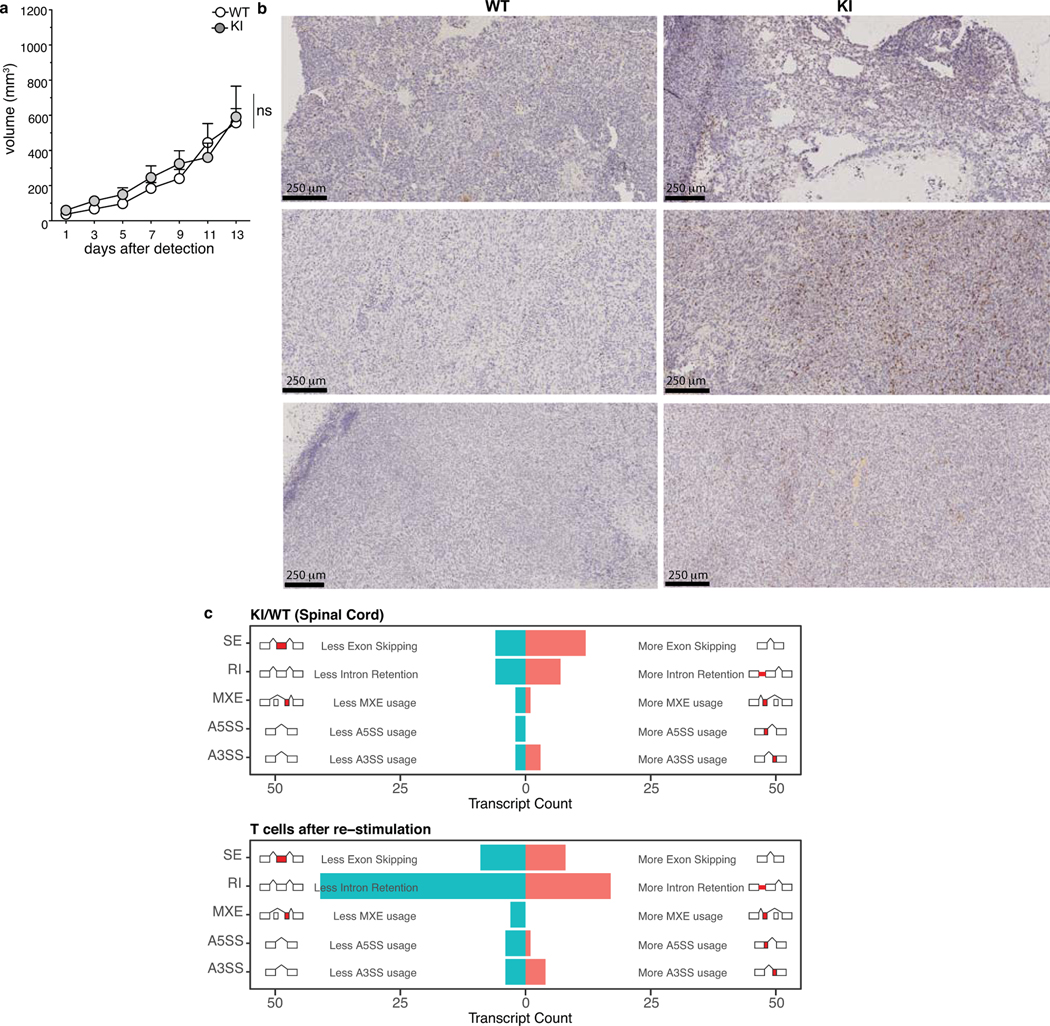
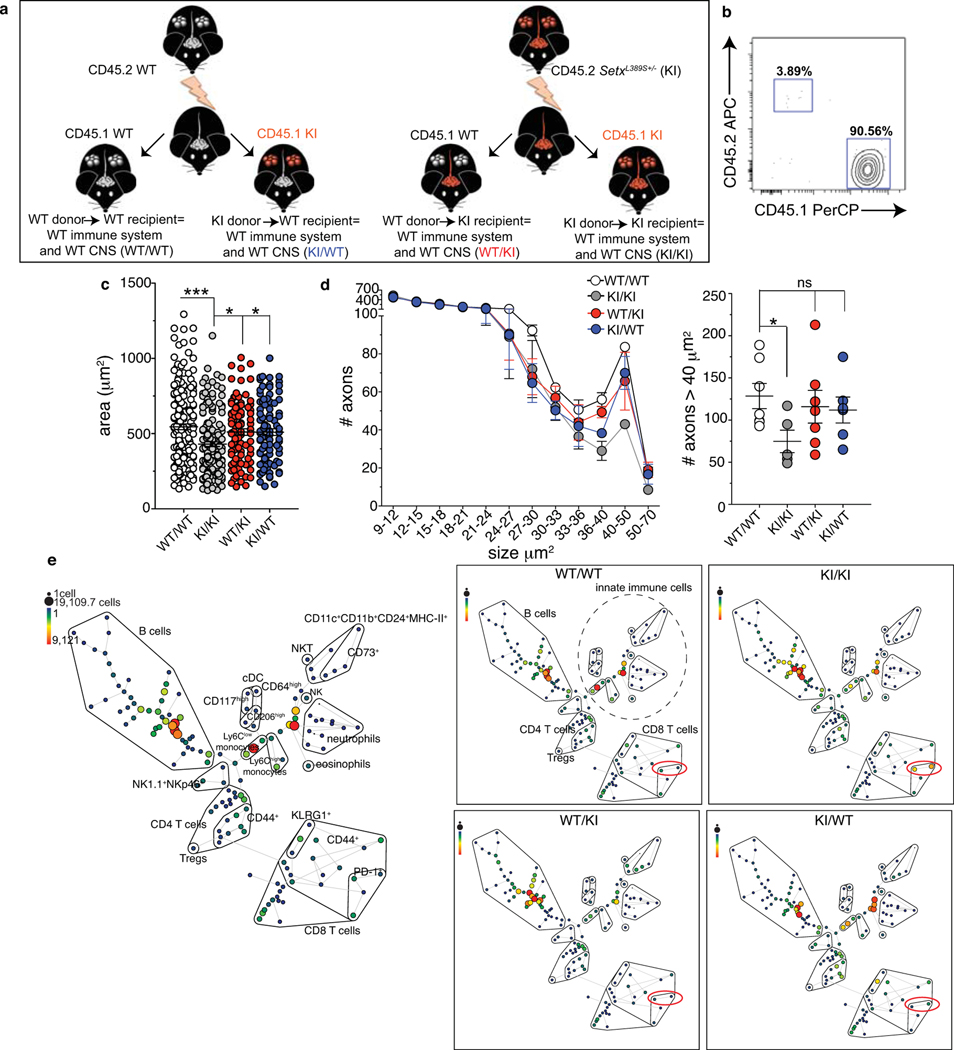
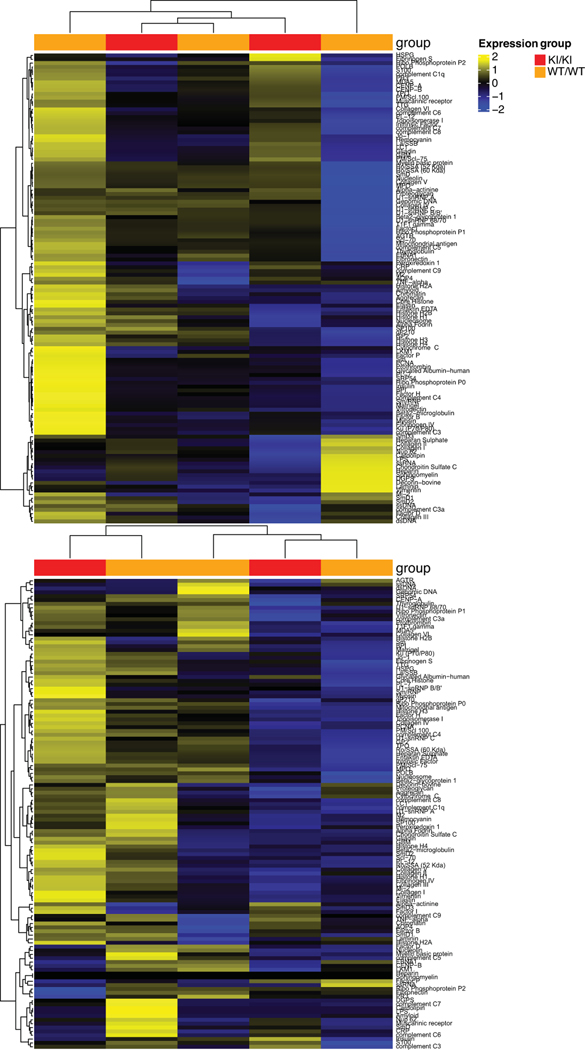
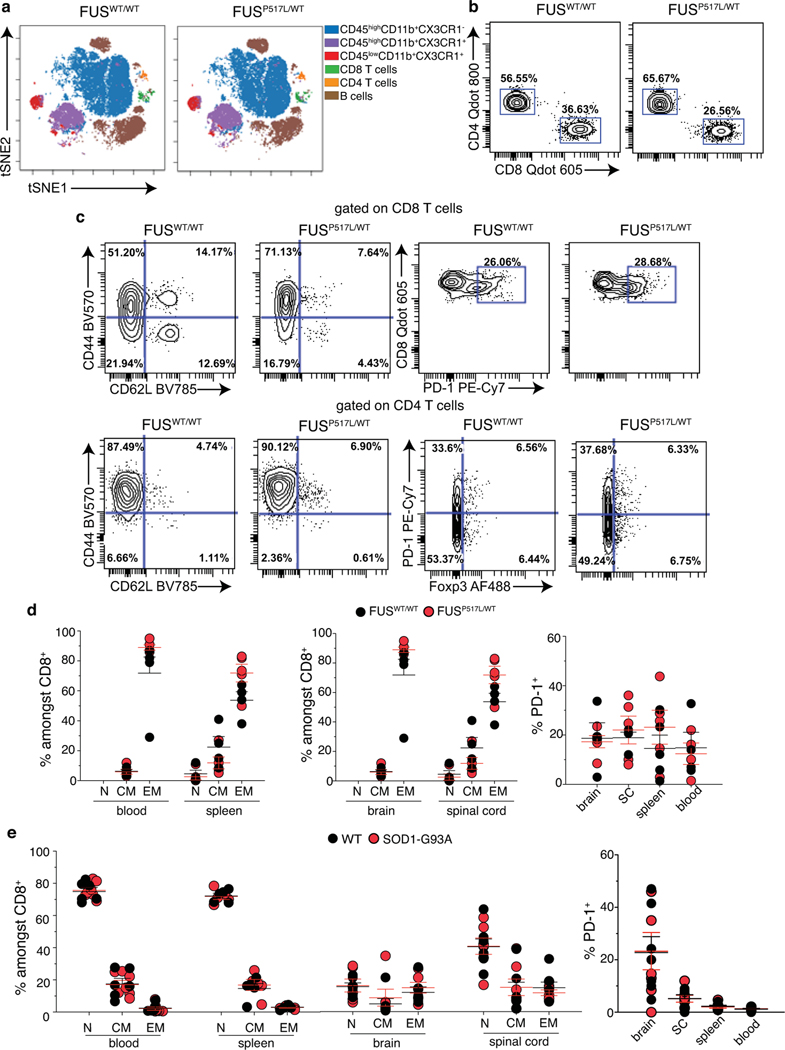
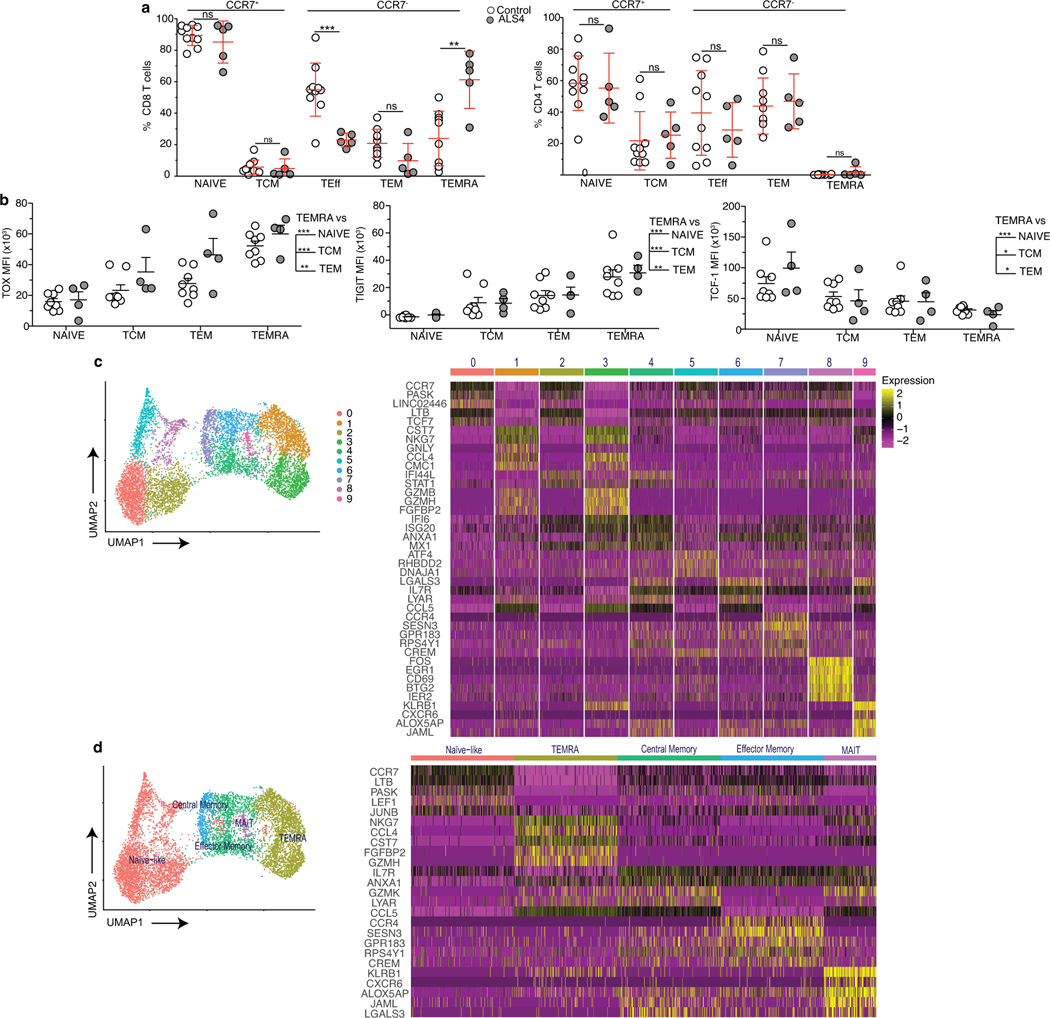
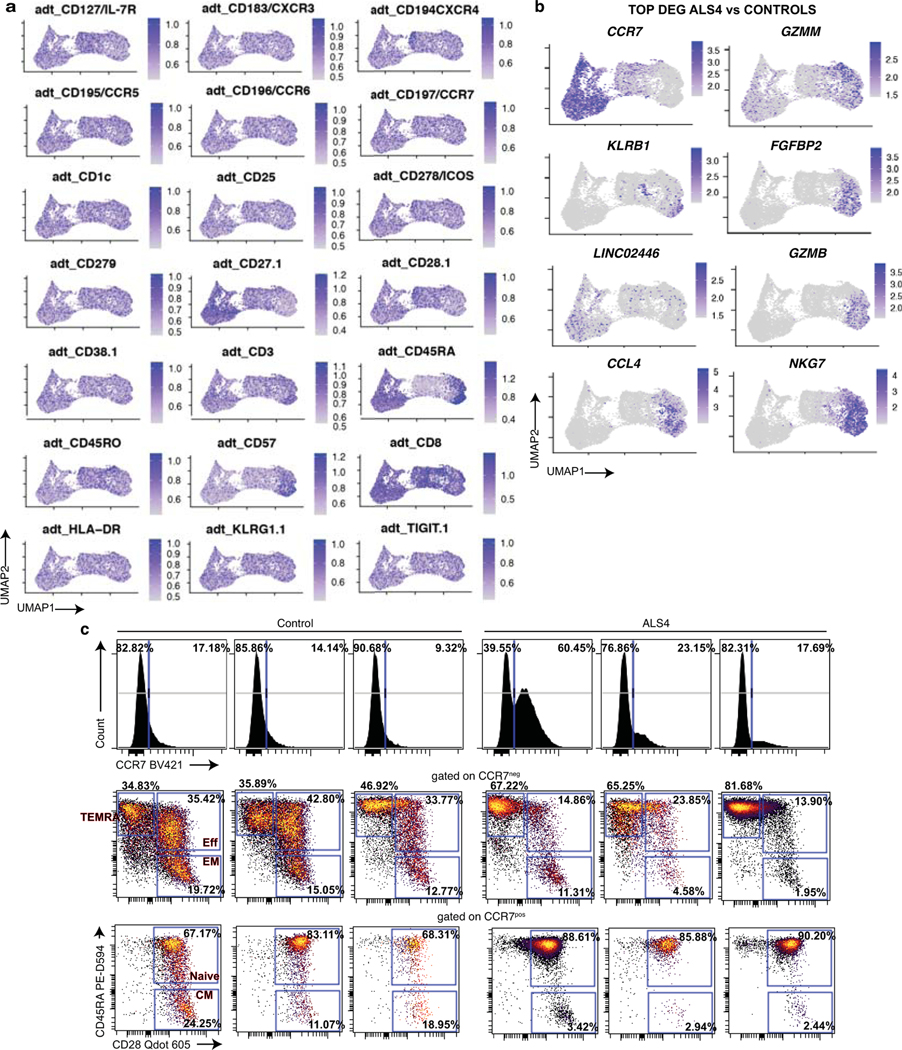
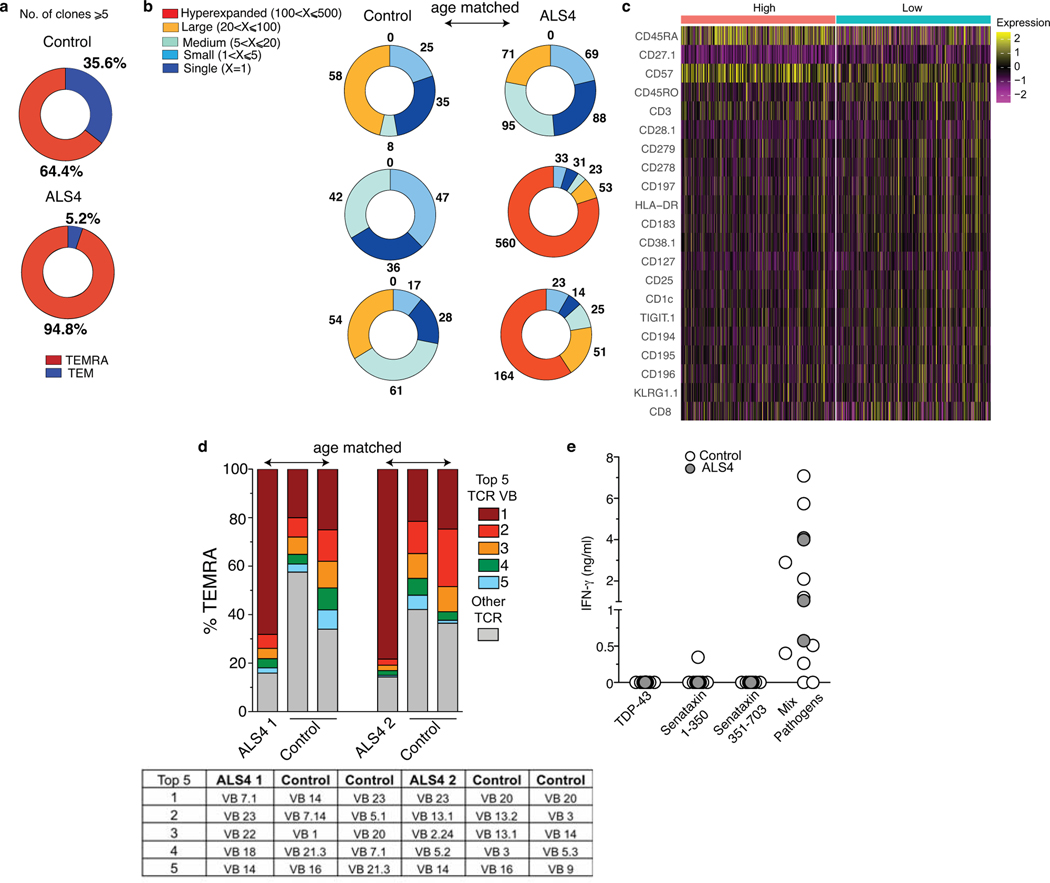
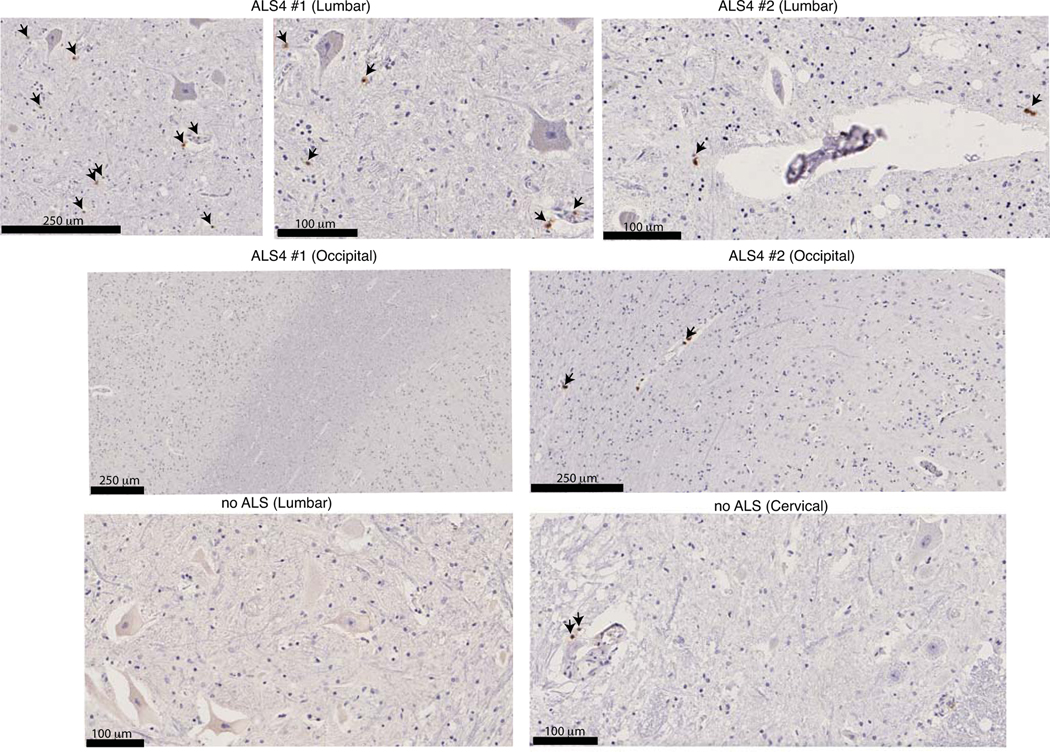
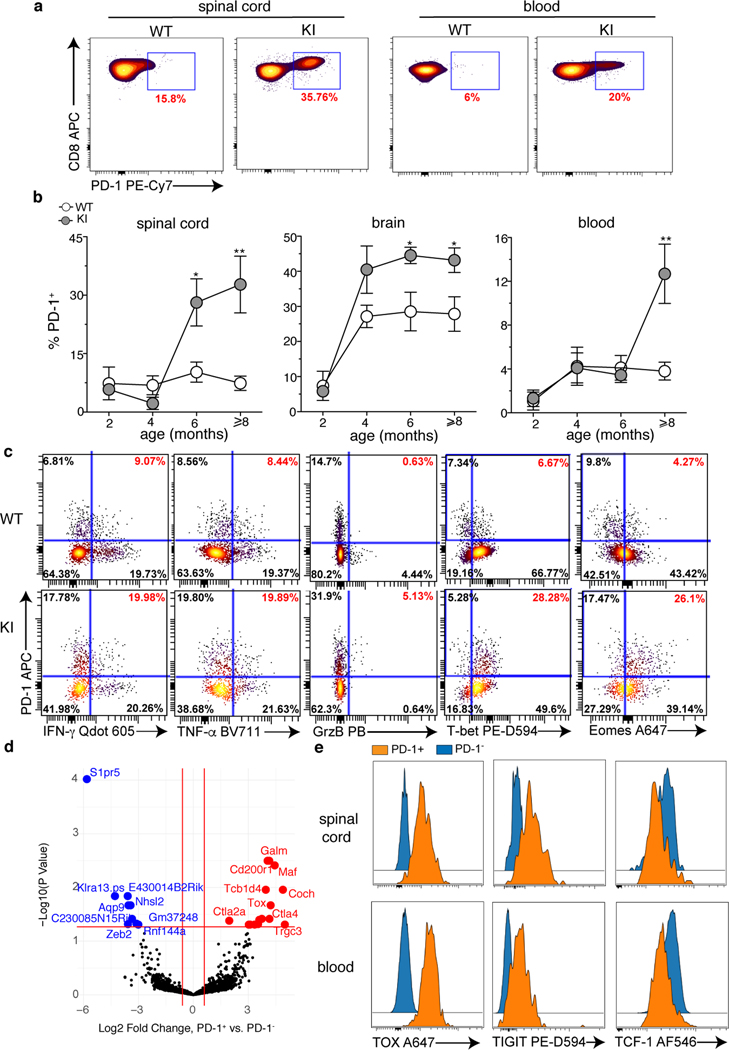
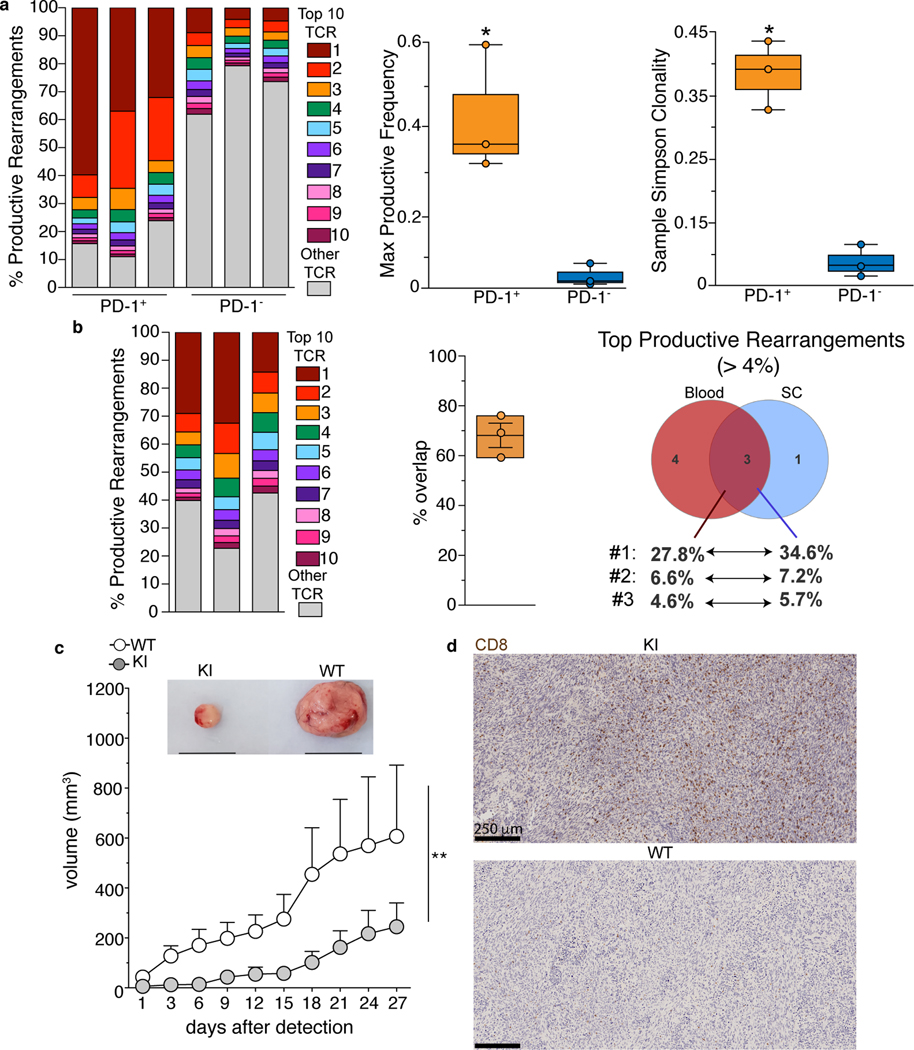
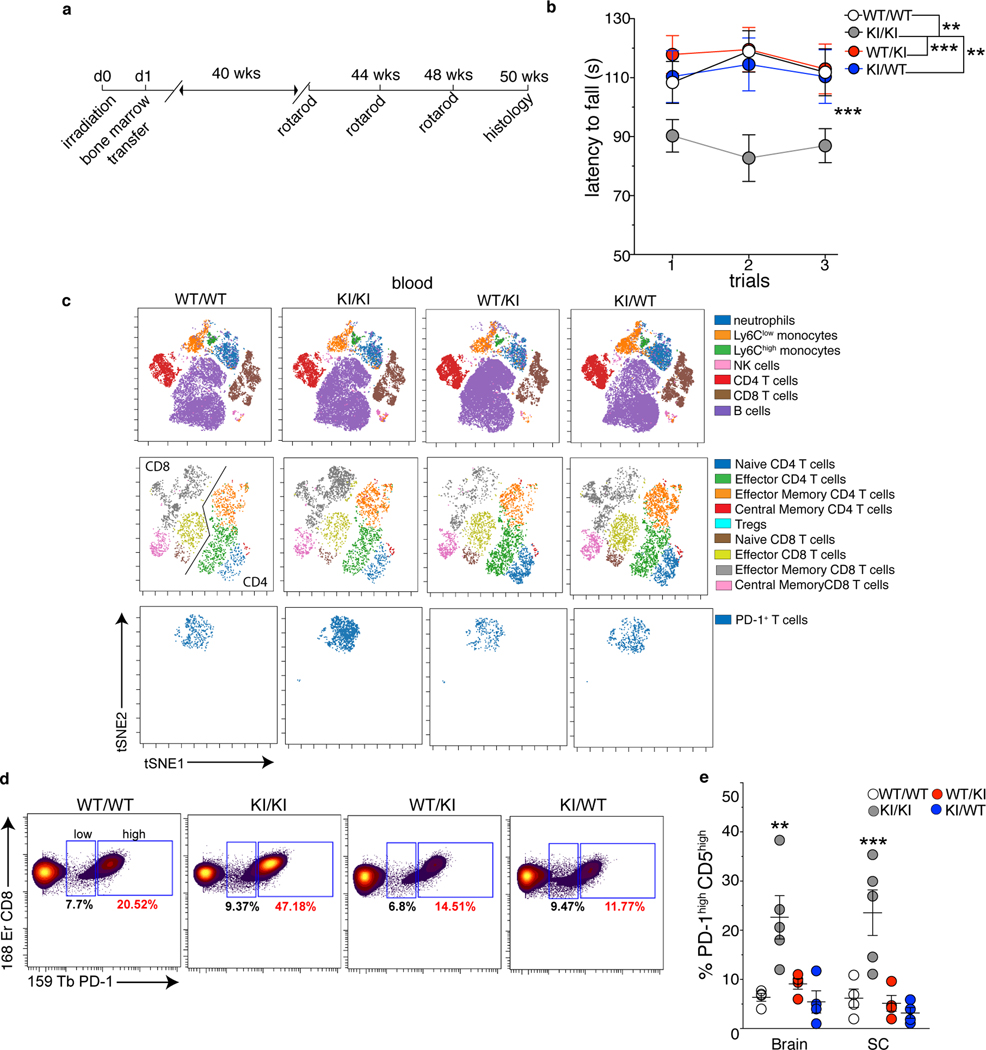
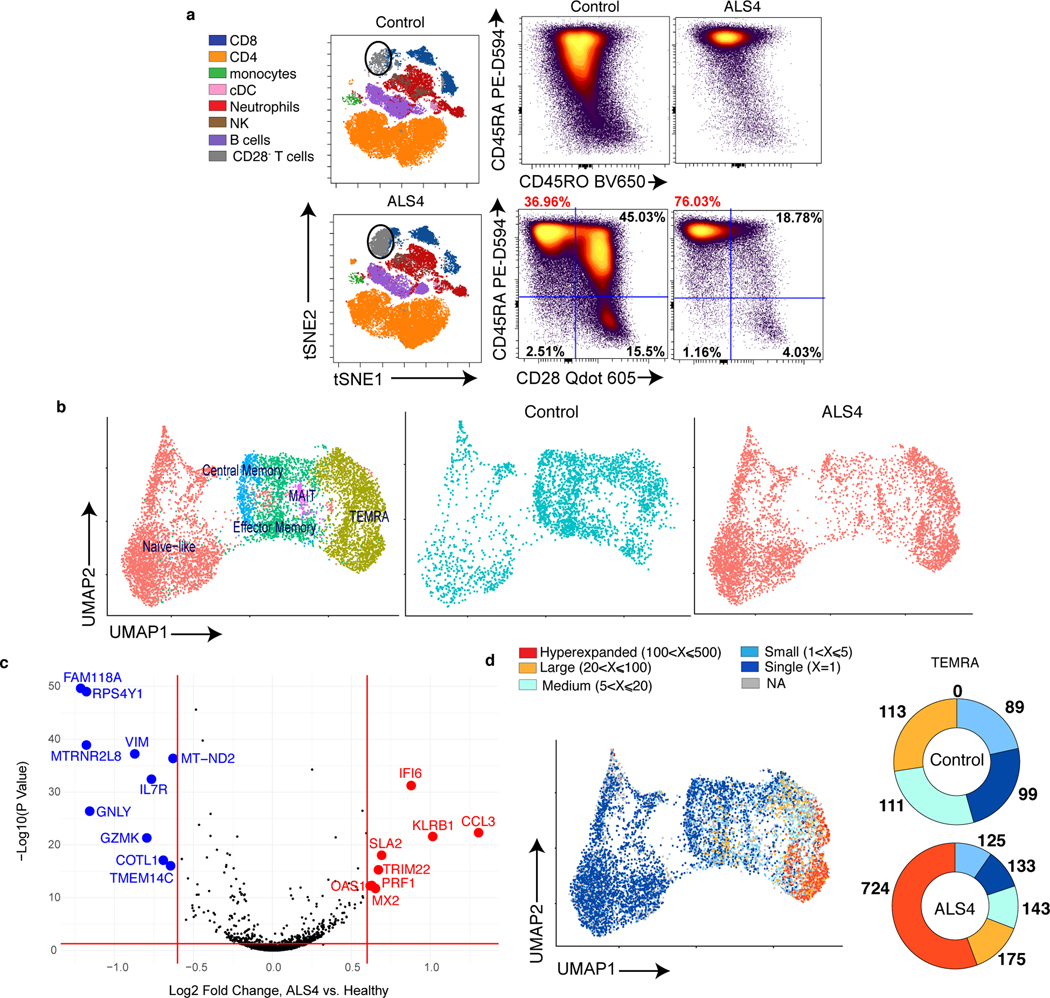
Amyotrophic lateral sclerosis (ALS) is a heterogenous neurodegenerative disorder that affects motor neurons and voluntary muscle control1. ALS heterogeneity includes the age of manifestation, the rate of progression and the anatomical sites of symptom onset. Disease-causing mutations in specific genes have been identified and define different subtypes of ALS1. Although several ALS-associated genes have been shown to affect immune functions2, whether specific immune features account for ALS heterogeneity is poorly understood. Amyotrophic lateral sclerosis-4 (ALS4) is characterized by juvenile onset and slow progression3. Patients with ALS4 show motor difficulties by the time that they are in their thirties, and most of them require devices to assist with walking by their fifties. ALS4 is caused by mutations in the senataxin gene (SETX). Here, using Setx knock-in mice that carry the ALS4-causative L389S mutation, we describe an immunological signature that consists of clonally expanded, terminally differentiated effector memory (TEMRA) CD8 T cells in the central nervous system and the blood of knock-in mice. Increased frequencies of antigen-specific CD8 T cells in knock-in mice mirror the progression of motor neuron disease and correlate with anti-glioma immunity. Furthermore, bone marrow transplantation experiments indicate that the immune system has a key role in ALS4 neurodegeneration. In patients with ALS4, clonally expanded TEMRA CD8 T cells circulate in the peripheral blood. Our results provide evidence of an antigen-specific CD8 T cell response in ALS4, which could be used to unravel disease mechanisms and as a potential biomarker of disease state.


Conflict of interest statement

Competing interests. C.L. is the Scientific Director of the company NEMO LAB, and he served on a scientific advisory board for Mitsubishi Tanabe Pharma Europe, Cytokinetics, Neuraltus and Italfarmaco. The other authors declare no competing interests.

Figures

Extended Data Fig. 1.
Extended Data Fig. 1.. Characterization of KI mice.
a, Average latency to fall (sec) from an accelerating rotarod of WT and KI mice tested at 6 and 8 months of age (2 independent experiments, n=11 (WT 6 months and KI 8 months) and n= 13 (WT 8 months and KI 6 months) individual mice per group; mean +/− SEM). p-value calculated using the one-way Repeated Measures ANOVA (**p=0.0012) and Bonferroni’s post-test. (b,c) Bone marrow derived dendritic cells (BMDCs) from Setx WT and KI (b,c), and HET and KO (b) mice were infected with Citrobacter rodentium (multiplicity of infection=10, b) or stimulated with 5 μg/ml of cGAMP (c). Bar graphs show the relative induction of the indicated transcripts by RT-qPCR analysis at 2 hours post-infection or cGAMP stimulation in KO and KI cells normalized to their controls (2 independent experiments, n=4 mice/group, mean +/− SEM). No expression of the indicated genes was detected in uninfected cells. d, Concentration of the indicated cytokines measured by Luminex Assay in the serum of KI and WT (8–9 months old) animals (1 out of 2 independent experiments, n=6 (WT) and n=5 (KI) mice/group, mean +/− SEM). e, RT-qPCR analysis for the indicated inflammatory genes in the spinal cord of 10 months old WT and KI mice (Log2 relative expression against Actb, 2 independent experiments, n=5 mice/group, mean +/− SEM). f, Absolute numbers of indicated immune cell subsets in the spleen of 8–9 month old KI and WT mice. pDC: plasmacytoid dendritic cells; cDC: conventional dendritic cells. g, Expression of the activation marker CD86 in cDC and CD11b+ cells from the spleen of 8–9 months old WT and KI mice. (f,g) 2 independent experiments, n=4 mice/group, mean +/− SEM.
Extended Data Fig. 2.
Extended Data Fig. 2.. Autoantibody secretion in KI and WT mice.
Heat maps showing an unsupervised hierarchical clustering based on IgM (top) and IgG (bottom) reactivity against 128 self-antigens in the serum of 10–12 month old KI and WT mice (n=5 mice/group).
Extended Data Fig. 3.
Extended Data Fig. 3.. Related to Figure 1.
a, b, Peripheral blood cells from 8 month old WT and KI mice were analyzed by mass cytometry. a, t-SNE plots after gating on live CD45high (top) and CD19NK1.1CD11bCD11cTCRβ+ (bottom). b, Frequency of PD-1+ expressing cells after gating on CD44+ CD8+ T cells. Three mice/group were pooled for mass cytometry analysis. c, Gating strategy for flow cytometry analysis of CD8 T cells in the CNS. d, Frequency of PD-1+ CD8 T cells in the spleen and lungs of WT and KI mice at the indicated ages (2 independent experiments, 4 mice/group; mean +/− SEM). d, Frequency of PD-1+ (left) and Foxp3+ (right) CD4 T cells in the peripheral blood of WT and KI mice at the indicated ages (3 independent experiments, n=6 (left) and 2 independent experiments, n=4 (8 months) and n=6 (right) individual mice/group. SB=super bright.
Extended Data Fig. 4.
Extended Data Fig. 4.. PD-1+ CD8 T cells are effector memory T cells activated in an antigen fashion
. a, Expression of indicated surface markers in CD8 T cells from the spinal cord (top), brain (middle) and peripheral blood (bottom) of 10–12 month old KI animals after gating on PD-1+ and PD-1 CD8 T cells. Histograms are representative of 3 independent experiment (n=6 mice). b, Median fluorescence intensity (MFI) of the indicated markers in CD44+CD62L PD-1+ and PD-1 CD8 T cells isolated from the spinal cord (top) and blood (bottom) of 10–12 month old KI mice (2 independent experiments, n=6 (blood TIGIT and TOX), n=5 (spinal cord TIGIT and TOX), n=4 (TCF-1) individual mice/group, mean +/− SEM). p-value calculated using a two-tailed unpaired t test with Welch’s correction (spinal cord: ***p=0.0007; *p=0.045; **p=0.0066; blood: ***p=0.0004 (TOX); ***p=0.0002 (TIGIT and TCF-1). c, KI mice were crossed to OT-I mice and the offspring analyzed at 10 months of age. Dot plots from spinal cords, SC (left), and bar graphs (right) show the frequency of PD-1+ among OVA specific (gated on Vα2+Vβ5+) and non-TCR transgenic (gated on Vα2) CD8 T cells (3 independent experiments, n=6, brain and spinal cord, and n=5, blood, individual mice; mean+/− SEM). p-value calculated using a two-tailed unpaired t test with Welch’s correction. **p=0.0031 (brain) ; ***p=0.0004 (SC); ***p=0.0003 (blood). eF=eFluor.
Extended Data Fig.5.
Extended Data Fig.5.. Anti-tumor immunity and alternative splicing in KI mice.
a, Kinetics of tumor growth in 10–12 month old KI and WT mice subcutaneously injected with B16-F10 cells. Two independent experiments, n=10 individual mice/group; mean+/− SEM. ns = not significant, p-value calculated using a two-tailed Wilcoxon matched-pairs signed rank test. b, Scans of CD8 staining inside glioma isolated from 3 individual WT and KI from 2 independent experiments at day 27 post-tumor detection. c, Spinal cords from 10 to 12 month old WT (n= 4) and KI (n=3) mice (top) and in vitro activated WT CD8 T cells (n=3) (bottom) were analyzed by RNA-seq. WT CD8 T cells were used as positive control since increased AS upon T cell activation has been reported. Bar graphs show transcript counts of significantly changed (| deltaPSI | > 0.15, p<0.05, FDR < 0.05) AS events using mm10 annotation. n= individual mice per group. SE, exon skipping; RI, intron retention; MXE, mutually exclusive exons; A5SS, alternative 5′ splice site; A3SS, alternative 3′ splice site.
Extended Data Fig. 6
Extended Data Fig. 6. Related to Figure 3.
a, Schematic of bone marrow cell transplantation experiments. b, Representative dot plots of the frequency of CD45.2 (recipient) and CD45.1 (donor) cells in the peripheral blood of chimeric mice 8 weeks after irradiation and reconstitution. c, Average of motor neuron area calculated in the lumbar region of spinal cord sections. n=5 mice/group, mean +/− SD. p-value calculated using one-way ANOVA Kruskal-Wallis test and Dunn’s post-hoc test (*p=0.0002). d, Axon areas (left) and number of large caliber axons (right) in the sciatic nerve. n=6 (WT/WT, KI/KI, KI/WT) and 7 (WT/KI) animals per group; mean +/− SEM. p-value calculated using one-way ANOVA Kruskal-Wallis test and Dunn’s post-hoc test (*p=0.026, ns=not statistically significant). Chimeric mice in (c,d) were analyzed at 12–13 months after reconstitution. e, Peripheral blood cells from two mice of the indicated group were pooled and analyzed by mass cytometry. Left, Details of markers and cell subsets identified by SPADE (spanning-tree progression analysis for density-normalized events) analysis (WT/WT group is shown). Right, SPADE analysis showing the distribution of immune cells into 4 main populations. Size and color of circles are dependent on the number of cells and the median intensity of expression for each marker, respectively. Red circles highlight PD-1+ CD8 T cells.
Extended Data Fig. 7.
Extended Data Fig. 7.. Autoantibody secretion in KI/KI and WT/WT chimeric mice.
Heat maps showing an unsupervised hierarchical clustering based on IgM (top) and IgG (bottom) reactivity against 128 self-antigens in the serum of chimeric mice at 12 months after reconstitution (n=3 WT/WT and n=2 KI/KI chimera).
Extended Data Fig. 8.
Extended Data Fig. 8.. Absence of T cell signature in FusP517L/WT and SOD1-G93A mice.
(a,d) Cell suspensions from brain, spinal cord, spleen, and peripheral blood of 22–24 month old FusP517L/WT and FusWT/WT littermates were analyzed by spectral flow cytometry. (a,b) t-SNE of total live CD45+ cells (a) and frequency of TCRβ+ CD8+ and CD4+ T cells expressing CD62L, CD44, PD-1+ and Foxp3 (b,c) from the spinal cord of FusP517L/WT and FusWT/WT mice after concatenation of all of the 5 samples/group. d, Frequency of CD8 T cell subsets in the indicated organs from the 2 genotypes (2 independent experiments, 5 individual mice/group; mean +/− SEM). e, Frequency of CD8 T cell subsets in the indicated organs from 3–4 month old non carrier and SOD1-G93A mice by spectral flow cytometry analysis (2 independent experiments, n=5 (spleen), n=6 (brain, WT blood) and n=7 individual mice/group; mean +/− SEM). N= naïve, CD62L+CD44; CM= central memory, CD62L+CD44+; EM= effector memory CD62LCD44+. T cells are gated on live CD45high CD19NK1.1CD11bCD11cTCRγδTCRβ+ CD8+ or CD4+ cells.
Extended Data Fig. 9.
Extended Data Fig. 9.. Related to Fig. 4.
a, PBMCs from age-matched controls and patients were analyzed by spectral flow cytometry. Frequencies of naïve (CD45RA+ CD45RO CD27+CD28+) and central memory (TCM, CD45RO+ CD45RA CD28+) were determined after gating on CCR7+ CD8 (left) or CD4 (right) T cells. Frequencies of effector (TEff, CD45RA+/− CD45RO+/− CD27+CD28+), effector memory (TEM, CD45RA CD45RO+ CD27+CD28+) and terminally differentiated effector memory (TEMRA, CD45RO CD45RA+ CD28) were determined after gating on CCR7 CD8 or CD4 T cells. T cells were gated on live CD19CD16 CD56CD3+ cells. Each dot represents one individual donor and graph show results from 2 independent experiments (n=5 ALS4 and n=10 controls). mean +/− SEM. p-value calculated for each T cell subset using Unpaired two-tailed t test with Welch’s correction (Teff: ***p=0.0002; TEMRA:***p=0.0067). ns= not significant. b, Levels of expression of TOX, TIGIT and TCF-1 in the indicated CD8 T cell subsets from the peripheral blood of ALS4 patients (n=4) and age-matched controls (n=8). Two independent experiments, mean +/− SEM. p-value calculated by comparing TEMRA CD8 T cells from patients and controls pool together to the other subsets using one-way ANOVA and Tukey post-hoc test. c,d, UMAP projections of 20,000 single cells from controls (n=3) and ALS4 patients (n=3) colored by cluster (c) or by cell subsets (d) are shown on the left and Z-score normalized mean expression of differentially expressed genes in the indicated clusters (c) or CD8 T cell subsets (d) are shown on the right.
Extended Data Fig. 10.
Extended Data Fig. 10.. Phenotype of CD8 T cells from ALS4 patients and controls.
a,b, UMAP projections of identified clusters showing differential expression of surface markers (by oligo-conjugated antibodies) (a) and of the top genes (b) in ALS4 versus control donors. c, Spectral flow cytometry analysis of the 6 samples used for CITE-seq. Histograms show the frequency of CCR7+ CD8 T cells and dot plots the proportion of the indicated subsets after gating on CCR7pos or neg CD8 T cells as indicated.
Extended Data Fig. 11.
Extended Data Fig. 11.. Clonal expansion and antigen specificity of TEMRA CD8 T cells from ALS4 patients.
a-c, CD8 T cells from controls and ALS4 patients were analyzed by CITE-seq. a, Donut plots depicting T cell clonality per CD8 T cell subset and per group. b, Donut plots indicating the number of TEMRA CD8 T cells for each indicated clonal category. Each patient and the corresponding age-matched controls are individually shown. c, Z-score normalized mean expression of differentially expressed surface markers (by oligo-conjugated antibodies) in “High” (clonality >20) versus “Low” expanded TEMRA CD8 T cells from ALS4 patients. “High” and “Low” clones have been subsampled for equal representation on the heatmap. d, PBMCs from 2 ALS4 patients and 4 age-matched controls were analyzed by spectral flow cytometry using a mixture of fluorophore-conjugated antibodies against 24 human TCR Vβ. Graph bars show the frequencies of the top 5 TCR VB expressed by TEMRA CD8 T cells in each donor. Top 5 VB chains are indicated in the table below the graph. e, Concentration of IFN-γ in the supernatant of PBMCs from controls (n=10) and ALS4 (n=4) patients stimulated for 6 days with 15mers overlapping TDP-43 (106 peptides), Senataxin (703 peptides divided in 2 sub-pools), or with a pool of 80 pathogen-derived peptides. Two independent experiments, mean +/− SEM.
Extended Data Fig. 12.
Extended Data Fig. 12.. CD8 T cells are detected in the ventral horn of lumbar spinal cords from ALS4 patients.
CD8 T cell staining in the indicated post-mortem paraffin-embedded tissues from ALS4 patients and controls. For spinal cord sections, scans show the ventral horn. Narrows indicate CD8 T cells. n=2.
Fig. 1.
Fig. 1.. A CD8 T cell signature in SetxL389S+/− KI mice.
a, Representative dot plots of the frequency of PD-1+ CD8 T cells in the spinal cord (left) and the peripheral blood (right) of 10 month old WT and KI mice. b, Frequencies of PD-1+ CD8 T cells in the spinal cord (left), brain (middle) and peripheral blood (right) of WT and KI mice at the indicated ages. Data show 3 independent experiments, n=8 (brain and blood, 8 months) and n=6 individual mice/group. For spinal cord and brain of 2 months old animals, 2 mice/experiment were pooled, n=6; mean +/− SEM. p-value calculated using the two sided Mann Whitney test (spinal cord: 6 months *p=0.034, >8 months **p=0.0087; brain: 6 months *p=0.043, >8 months *p=0.0258; blood: **p=0.0015). c, Expression of indicated effector molecules and transcription factors by PD-1+ CD8 T cells from the spinal cord of 10 month old mice after ex vivo re-stimulation with phorbol myristate acetate (PMA) and ionomycin. Dot plots show 2 concatenated experiments out of 3 independent experiments (n=6, 2 mice were pooled/experiment). Cells are gated on total CD8 T cells. d, Differential expression analysis of PD-1+ and PD-1 CD8 T cells sorted from the blood of 10–12 month old KI mice, n=3 individual mice. e, Expression of indicated markers by PD-1+ and PD-1 CD8 T cells isolated from the spinal cord and blood of 10–12 month old KI mice. Histograms are representative of 2 independent experiments (n=6, blood TIGIT and TOX, n=5, spinal cord TIGIT and TOX, n=4 TCF-1 individual mice/group). In (d, e), both PD-1+ and PD-1 are gated on CD44+CD62LCD8 T cells. BV=brilliant violet; PB=pacific blue; PE-D594=PE-Dazzle 594; AF= alexa fluor.
Fig. 2.
Fig. 2.. Activation of CD8 T cells is antigen-dependent and correlates with increased anti-glioma immune response.
(a,b) PD-1+ and PD-1 CD8 T cells from the CNS (a), and PD-1+ CD8 T cells from blood and spinal cord (b) were isolated by cell sorting from 9 to 12 month old KI mice. Frequencies of productive rearrangements for the top 10 TCRβ sequences in each individual mouse are shown in color, while the sum of the other sequences is shown in grey. Each bar represents an individual animal, n=3. a, right, Comparison of maximum TCR productive frequencies and Simpson clonality between PD-1+ and PD-1 CD8 T cells. n=3; whiskers=max and min values, centre of the box=median, bounds of the box=first and third percentile. p-value calculated using unpaired two-sided t test (*p=0.025). b, middle, Percentage of sequences overlapping between blood and spinal cord in the 3 animals. whiskers=max and min values, centre of the box=mean, bounds of the box=SD. b, right Venn diagram showing the overlap between the top (> 4%) productive TCR sequences from PD-1+ CD8 T cells isolated form blood and spinal cord in mouse 1. (c, d) Ten-twelve month old KI and WT mice were subcutaneously injected in the flank with tumor-derived neural stem cells. c, Kinetics of tumor growth and representative images (top, black line=1 cm) of tumors from the indicated genotype at day 27 post-detection. Two independent experiments, n=8 WT and 12 KI mice; mean+/− SEM. p-value calculated using a two-tailed Wilcoxon matched-pairs signed rank test (**p=0.002). d, Representative scans of CD8 staining inside the glioma (3 mice/group from 2 independent experiments).
Fig. 3.
Fig. 3.. The immune and the central nervous systems are both involved in MND.
8–10 week old CD45.2 WT and KI mice were subjected to hematopoietic cell-ablative doses of irradiation and reconstituted with bone marrow cells from congenic CD45.1 or 1.2 WT or KI animals. After 10 months of reconstitution, chimera were analyzed. a, Experimental schematic. b, Average time to latency before falling from an accelerating rotarod (pool of 3 independent experiments, n=21 (WT/WT), =15 (KI/KI), =20 (KI/WT), =25 (WT/KI) individual mice/group; mean +/− SEM). p-value calculated using a one-way repeated measures ANOVA test (***p=0.0003) and Bonferroni’s post-test. (c,d) Twelve months after reconstitution, peripheral blood cells from two mice of the indicated group were pooled and analyzed by mass cytometry. c, t-SNE plots of FlowSOM metaclusters after gating on total CD45high (top), TCRβ+ (middle) and CD8+ PD-1+ (bottom) cells. d, Frequency of CD8 T cells expressing PD-1 in the blood. e, Frequency of PD-1+ CD5high CD8 T cells from the SC and brain of the indicated chimeric mice 12 months after reconstitution (2 independent experiments, n=5 mice/group; mean +/− SEM). p-value calculated using one-way ANOVA and Dunnett’s post-test (**p=0.0025; ***p=0.0009).
Fig. 4.
Fig. 4.. Clonally expanded CD8 T cells with a TEMRA phenotype are increased in the peripheral blood of ALS4 patients.
a, Total PBMCs from ALS4 patients and age-matched controls were analyzed by spectral flow cytometry. Left, tSNE plots of FlowSOM metaclusters. The circular gates highlight a metacluster corresponding to a subset of CD8 T cells. Right, Dot plots displaying the frequency of CD45RA and CD45RO expression among CD8 T cells and of CD45RA and CD28 expression after gating on CCR7 CD8 T cells. Data shows concatenated data from 1 out of 2 independent experiments, n=5 (ALS4 patients) and n=10 (healthy controls). b-d, CD8 T cells purified from PBMCs of 3 ALS4 patients and 3 age-matched controls were analyzed by CITE-seq. b, Gene-expression analysis was conducted on all 6 samples and clustered by UMAP. Left, Identification of CD8 T cell subsets using a mixture of all groups is shown. Middle and right, Overlay of CD8 T cells from control or ALS4 patients on cellular subsets clustered by UMAP. c, Differential expression analysis of TEMRA CD8 T cells from ALS patients and healthy controls. d, Single-cell TCR analysis overlaid on UMAP projections of identified clusters showing TCRαβ clonality for each CD8 T cell subset (left) and donut plots depicting the number of TEMRA CD8 T cells expressing the same TCRαβ sequence (right).

References

    1. Brown RH & Al-Chalabi A. Amyotrophic Lateral Sclerosis. N Engl J Med 377, 162–172, doi: 10.1056/NEJMra1603471 (2017). - DOI - PubMed
    1. McCauley ME & Baloh RH Inflammation in ALS/FTD pathogenesis. Acta Neuropathol 137, 715–730, doi: 10.1007/s00401-018-1933-9 (2019). - DOI - PMC - PubMed
    1. Grunseich C. et al. Clinical and Molecular Aspects of Senataxin Mutations in Amyotrophic Lateral Sclerosis 4. Ann Neurol 87, 547–555, doi: 10.1002/ana.25681 (2020). - DOI - PMC - PubMed
    1. Boillee S. et al. Onset and progression in inherited ALS determined by motor neurons and microglia. Science 312, 1389–1392, doi: 10.1126/science.1123511 (2006). - DOI - PubMed
    1. Yamanaka K. et al. Astrocytes as determinants of disease progression in inherited amyotrophic lateral sclerosis. Nat Neurosci 11, 251–253, doi: 10.1038/nn2047 (2008). - DOI - PMC - PubMed

MeSH terms