. 2022 Jun 22;21(1):133.
doi: 10.1186/s12943-022-01596-8.

Single-cell RNA-seq reveals the genesis and heterogeneity of tumor microenvironment in pancreatic undifferentiated carcinoma with osteoclast-like giant-cells

Affiliations

Single-cell RNA-seq reveals the genesis and heterogeneity of tumor microenvironment in pancreatic undifferentiated carcinoma with osteoclast-like giant-cells

Xinbo Wang et al. Mol Cancer. .

Abstract

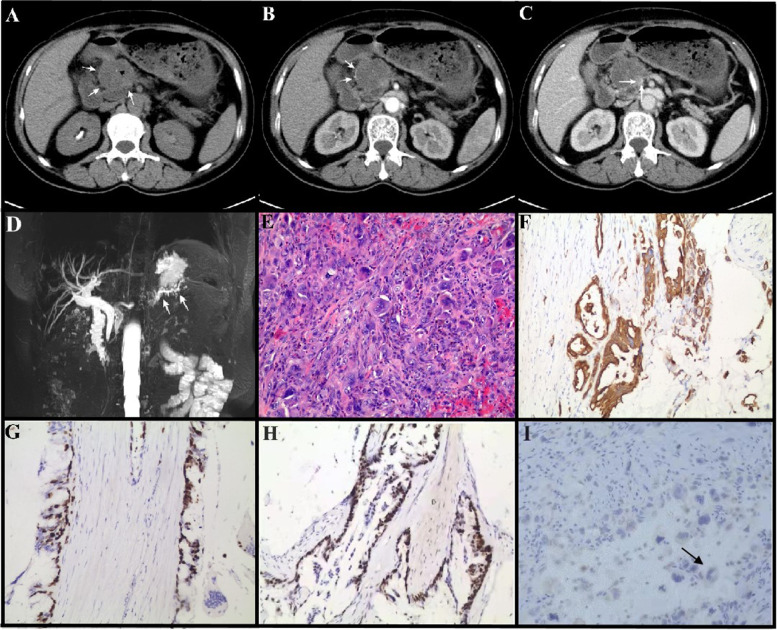
Background: Undifferentiated carcinoma with osteoclast-like giant cells (OGCs) of pancreas (UCOGCP) is a rare subtype of pancreatic ductal adenocarcinoma (PDAC), which had poorly described histopathological and clinical features.

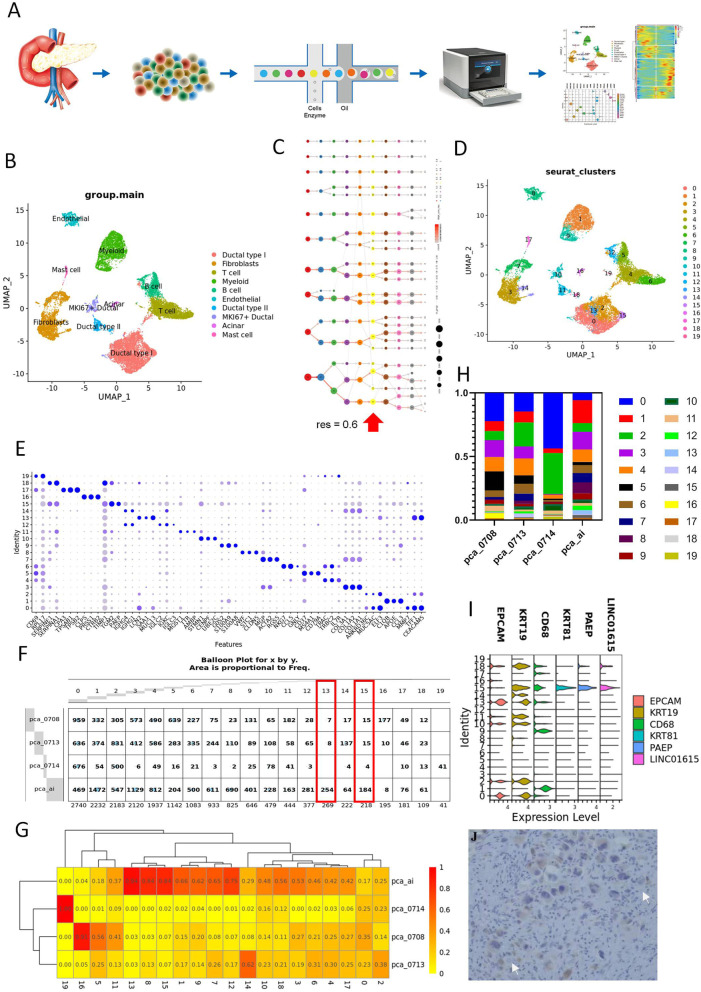
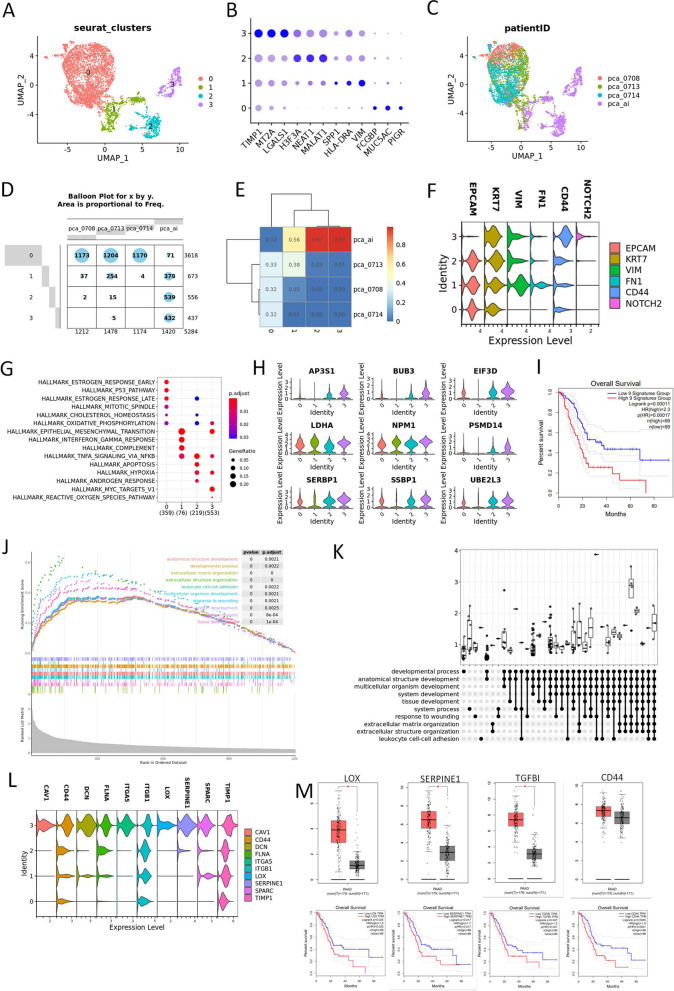
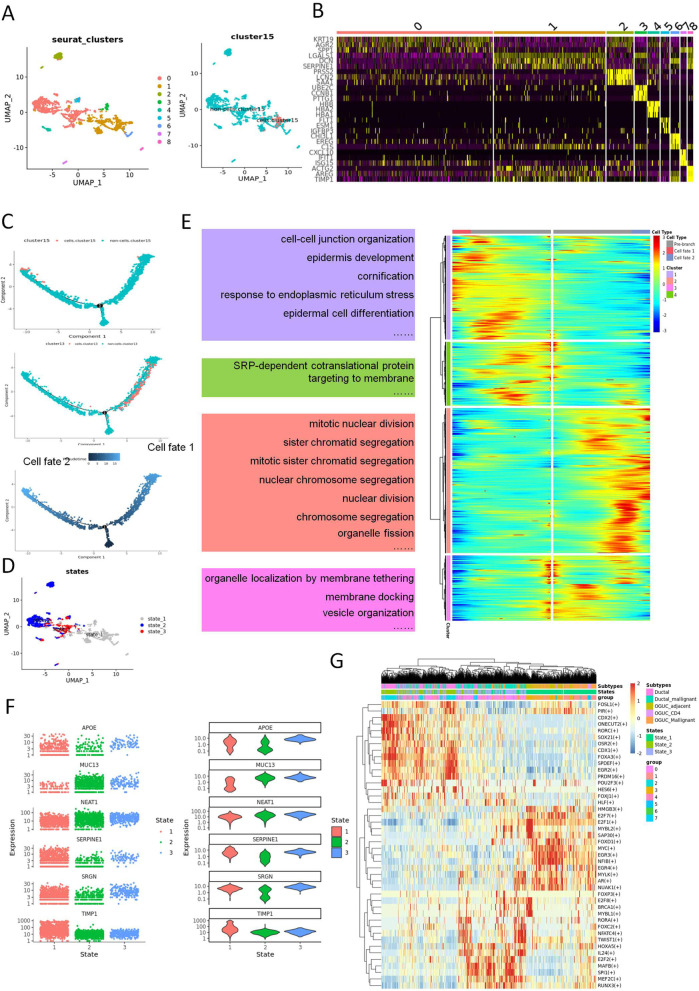
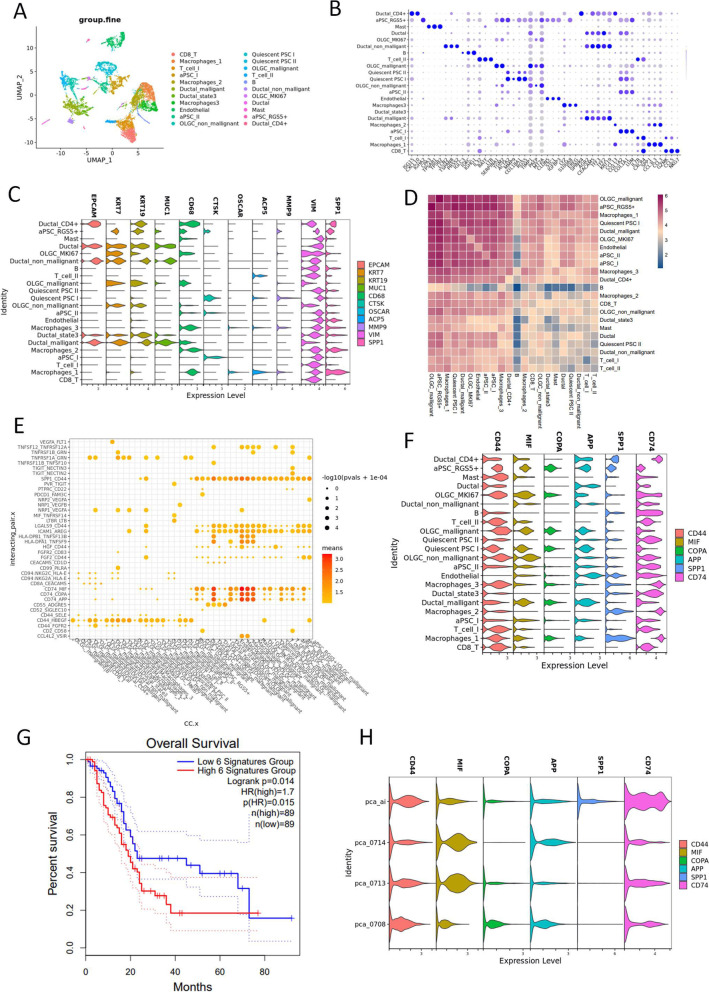
Methods: In this study, single-cell RNA sequencing (scRNA-seq) was used to profile the distinct tumor microenvironment of UCOGCP using samples obtained from one UCOGCP patient and three PDAC patients. Bioinformatic analysis was carried out and immunohistochemical (IHC) staining was used to support the findings of bioinformatic analysis. After quality control of the raw data, a total of 18,376 cells were obtained from these four samples for subsequent analysis. These cells were divided into ten main cell types following the Seurat analysis pipeline. Among them, the UCOGCP sample displayed distinct distribution patterns from the rest samples in the epithelial cell, myeloid cell, fibroblast, and endothelial cell clusters. Further analysis supported that the OGCs were generated from stem-cell-like mesenchymal epithelial cells (SMECs).

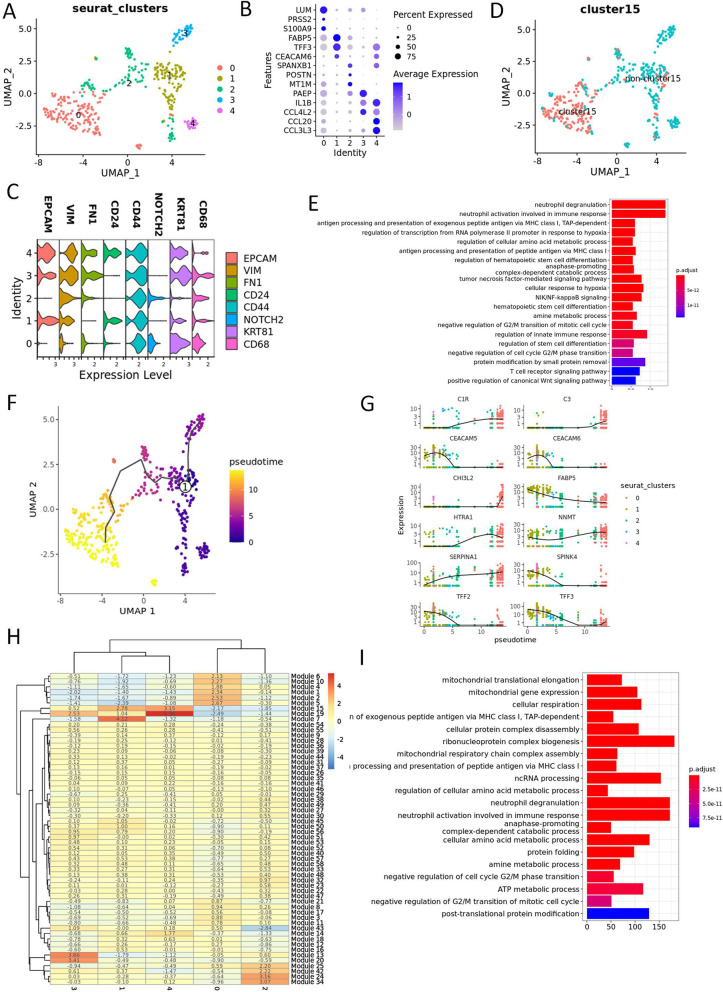
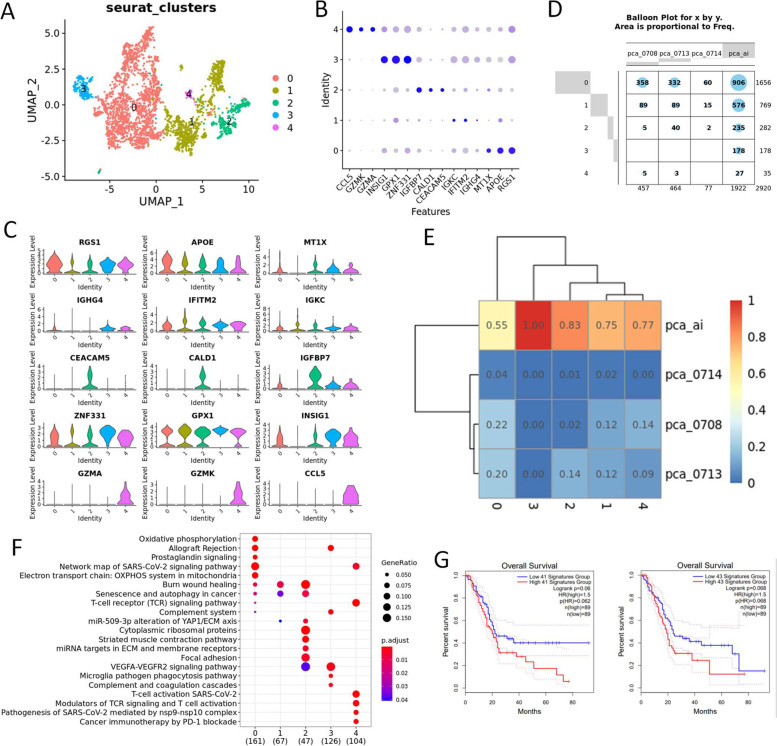
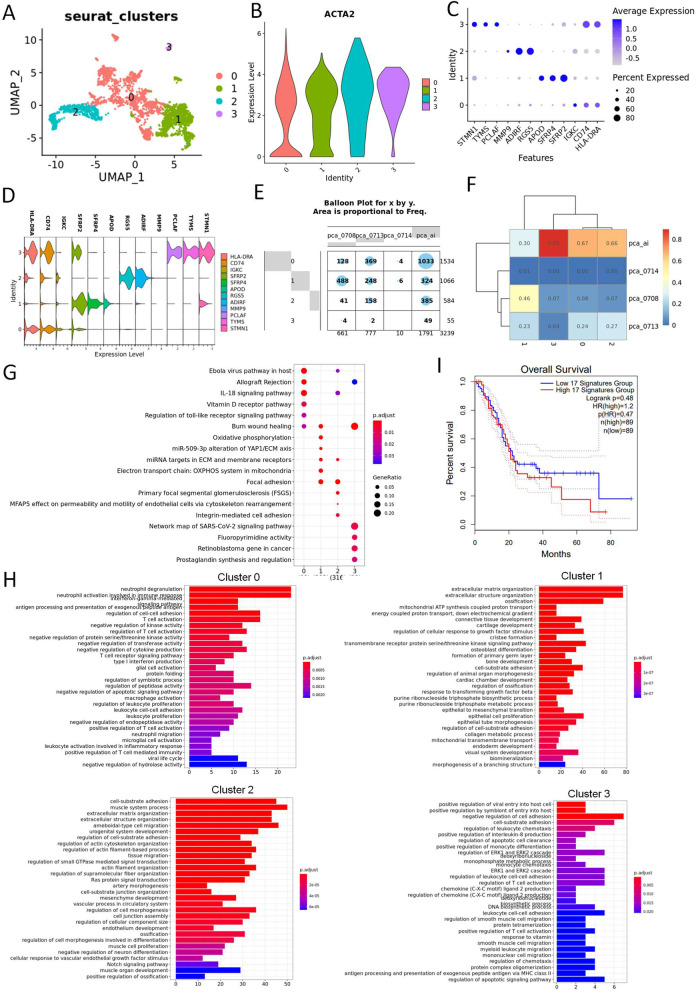
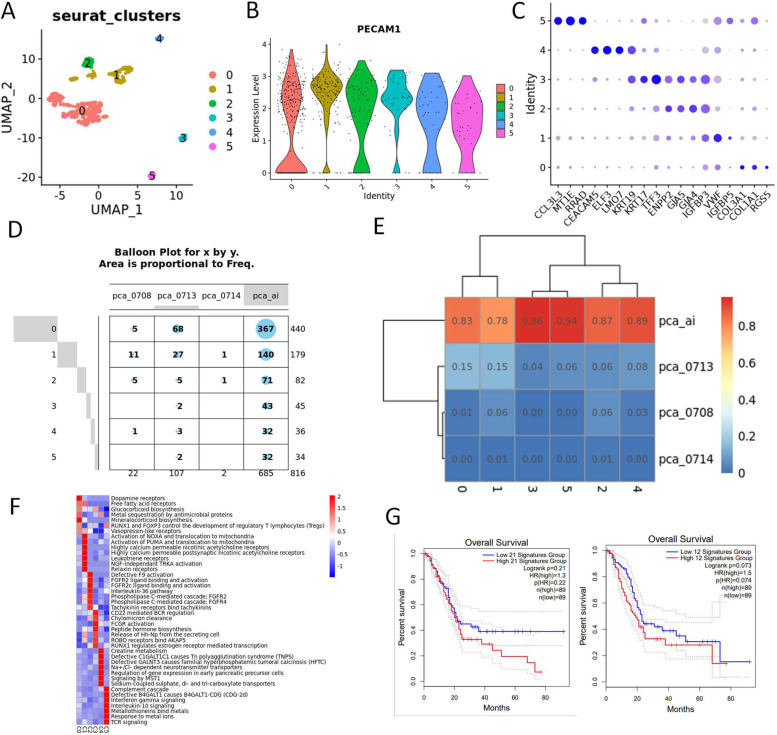
Results: Functional analysis showed that the OGCs cluster was enriched in antigen presentation, immune response, and stem cell differentiation. Gene markers such as LOX, SPERINE1, CD44, and TGFBI were highly expressed in this SMECs cluster which signified poor prognosis. Interestingly, in myeloid cell, fibroblasts, and endothelial cell clusters, UCOGCP contained higher percentage of these cells and unique subclusters, compared with the rest of PDAC samples.

Conclusions: Analysis of cell communication depicted that CD74 plays important roles in the formation of the microenvironment of UCOGCP. Our findings illustrated the genesis and function of OGCs, and the tumor microenvironment (TME) of UCOGCP, providing insights for prognosis and treatment strategy for this rare type of pancreatic cancer.

Keywords: PDAC; Pancreatic cancer; Tumor microenvironment; UCOGCP; scRNA-seq.


Conflict of interest statement

The authors declare that they have no competing interests.

Figures

Fig. 1
Fig. 1
Imaging and pathological analysis of pca_ai1 patient. A-C, CT images. Dedicated abdominal CT found an enlarging exophytic 4.5-cm pancreatic head mass (white arrow) with focal calcification (black arrowhead, A). The lesion showed heterogenous low intensity in the edge (arrow, B) relative to pancreatic parenchyma in the pancreatic and portal vein phases with directly protruding into the adjacent superior mesenteric vein (arrow, C). D, MRI analysis. A filling defect in the main pancreatic duct (MPD) of the pancreatic head and dilation of the MPD distal to the lesion are evident in MRI, and indicated by arrows in D. E, Representative images of H&E staining of surgical removed pancreatic tissue of pca_ai1. Arrows indicated osteoclast-like giant cells (OGCs). F-I, Representative images of IHC staining of surgical removed pancreatic tissue of pca_ai1. pan-cytokeratin (CKpan) (F), Ki67 (G), p53 (H), and CD68 (I) were used to indicate pleomorphic neoplastic cells and OGCs. Arrows in H indicated osteoclast-like giant cells (OGCs) with CD68 positive staining. Bar = 200 µm
Fig. 2
Fig. 2
The scRNA-seq summarized the differences in tumor microenvironment between UCOGCP and other PDAC. A, Flow chart described the present work. UCOGCP and PDAC samples are dissociated into single cells, captured in 10 × genomic platform for library construction and RNA sequencing. The sequencing results were then undergoing bioinformatics analysis after QC, normalization, PCA. B, Uniform manifold approximation and projection (UMAP) showing major clusters learned in Seurat package (4.0.4) in R (4.0.5). D, The proportion of each cluster in different samples. C, Clustering tree of total scRNA-seq mate data under different resolutions. Arrows indicated the resolution used in the following figures. D, UMAP showing major clusters learned under the resolution of 0.6. E, Top three markers of each cluster obtained from “FindAllMarkers” function from Seurat package (4.0.4) were shown in dot plot. F and G, The distribution of each cluster in each sample shown in balloon plot and heatmap. Clusters containing cells mainly came from UCOGCP sample (pca_ai1) were highlighted in red boxes in F. H, The proportion of each cluster in different samples. I, Cell markers in cluster 15 shown in violin plot. J, Representative images of IHC staining of KRT81 in surgical removed pancreatic tissue of UCOGCP sample (pca_ai1). Representative OGCs with KRT81 positive staining indicated by arrows. Bar = 200 µm
Fig. 3
Fig. 3
UCOGCP held distinct ductal profile. A, Major clusters of the ductal type I cells shown in UMAP. B, Top three markers of each cluster obtained from “FindAllMarkers” function from Seurat package (4.0.4) shown in dot plot. C-E, The distribution of each cluster in each sample shown in UMAP, balloon plot and heatmap, respectively. F, Violin plot showing markers of epithelial cells, cancer stem cells, and epithelial-mesenchymal transition (EMT) cells. G, Hallmarks among clusters shown in dot plot. H, Expression levels of enriched genes in HALLMAKS-MYC-TARGET-V1. I, Survival analysis of gene signatures in H in pancreatic cancer using TCGA-PAAD on website Gepia2 (http://gepia2.cancer-pku.cn/#index). J and K, GSEGO analysis of gene markers in cluster 2. L, Expression level of gene signatures enriched in at least eight of the top GSEGO clusters of cluster 3. M, Survival analysis of gene signatures in L in pancreatic cancer using TCGA-PAAD on website Gepia2 (http://gepia2.cancer-pku.cn/#index). N, Expression level and survival analysis of representative genes in L in pancreatic cancer using TCGA-PAAD on website Gepia (http://gepia.cancer-pku.cn/index.html)
Fig. 4
Fig. 4
Trajectory analysis and function enrichment of the UCOGCP-specific EMT cells. A, Major clusters of the UCOGCP-specific EMT cells shown in UMAP. B, Top three markers of each cluster obtained from “FindAllMarkers” function from Seurat package (4.0.4) shown in dot plot. C, Expression pattern of interested gene markers. D, Mapping of cluster 15 in Fig. 2D. E, GO BP enrichment of cluster 0. F, Trajectory analysis by monocle 3. G, Top ten genes differentially expressed in different clusters. H, Heatmap showing gene modules co-expressed in different clusters. I, GO BP enrichment of gene modules closely related to cluster 0. Genes in module 1, 2, 5, 6, and 10 were used for GO BP enrichment
Fig. 5
Fig. 5
Heterogeneity of epithelial cells in UCOGCP sample (pca_ai1). A, UMAP showed the clusters learned by Seurat in R, and the mapping of cluster 15 in Fig. 1D. B, Top three markers of each cluster obtained from “FindAllMarkers” function from Seurat package (4.0.4) shown in heatmap. C, Trajectory analysis of the epithelial cells in UCOGCP sample. The mapping of the cluster 13/cluster 15 in Fig. 1D and the pseudotime shown in DDRTree reduction in monocle2 package (2.18.0) in R (4.0.5). D, Mapping of different states in Seurat clusters shown in UMAP. E, The differential expression genes (DEGs) of different branches (different cell fates in C) shown in heatmap. The top GO BP pathways of different clusters in heatmap were listed nearby. F, Top five DE genes determined cell fate in C shown among different states. G, Transcription factor profile of different states shown in heatmap. Transcription factor profile were estimated by pySCENIC (0.11.2)
Fig. 6
Fig. 6
Heterogeneity of tumor associated Myeloid cells. A, Major clusters of the myeloid cells of all samples shown in UMAP. B, Top three markers of each cluster obtained from “FindAllMarkers” function from Seurat package (4.0.4) shown in dot plot. C and D, The distribution of each cluster in each sample shown in UMAP, balloon plot and heatmap, respectively. E, Violin plot showing the expression level of markers in each cluster. F, GO BP enrichment among clusters shown in dot plot. G, Survival analysis of gene signatures in cluster 2 and 3 in pancreatic cancer using TCGA-PAAD on website Gepia2 (http://gepia2.cancer-pku.cn/#index)
Fig. 7
Fig. 7
Heterogeneity of tumor associated fibroblast cells. A, Major clusters of the tumor associated fibroblast cells of all samples shown in UMAP. B, Violin plot showing the expression level of ACTA2 in different clusters. C, Top three markers of each cluster obtained from “FindAllMarkers” function from Seurat package (4.0.4) shown in dot plot. D, The expression levels of marker genes in different clusters. E and F, The distribution of each cluster in each sample shown in balloon plot and heatmap, respectively. E and F, Violin plot showing the expression level of markers in each cluster. G, Wikipathway enrichment among clusters shown in dot plot. H, GO BP enrichment among clusters shown in bar plot. I, Survival analysis of gene signatures in cluster 2 and 3 in pancreatic cancer using TCGA-PAAD on website Gepia2 (http://gepia2.cancer-pku.cn/#index)
Fig. 8
Fig. 8
Heterogeneity of tumor associated endothelial cells. A, Major clusters of the tumor associated fibroblast cells of all samples shown in UMAP. B, Violin plot showing the expression level of PECAM1 in different clusters. C, Top three markers of each cluster obtained from “FindAllMarkers” function from Seurat package (4.0.4) shown in dot plot. D, The expression levels of marker genes in different clusters. E and F, The distribution of each cluster in each sample shown in balloon plot and heatmap, respectively. E, Violin plot showing the expression level of markers in each cluster. F, Wikipathway enrichment among clusters shown in dot plot. G, GSVA analysis of KEGG among clusters. H, Survival analysis of gene signatures in cluster 3 and 5 in pancreatic cancer using TCGA-PAAD on website Gepia2 (http://gepia2.cancer-pku.cn/#index)
Fig. 9
Fig. 9
Cell communication analysis in UCOGCP sample (pca_ai1). A, Major clusters of the UCOGCP sample shown in UMAP. B, Top three markers of each cluster obtained from “FindAllMarkers” function from Seurat package (4.0.4) shown in dot plot. C, The expression levels of epithelial marker genes and osteoclasts marker genes in different clusters. D, The number of potential ligand–receptor pairs analyzed by pyCellphoneDB (0.24). E, Ligand–receptor pairs shown in a bubble plot. F, The expression level of ligand–receptor pairs with high means. G, Survival analysis of gene signatures in F in pancreatic cancer using TCGA-PAAD on website Gepia2 (http://gepia2.cancer-pku.cn/#index). H, The expression level of ligand–receptor pairs among different samples

Similar articles

Cited by

References

    1. Reid MD, Muraki T, HooKim K, Memis B, Graham RP, Allende D, Shi J, Schaeffer DF, Singh R, Basturk O. Cytologic features and clinical implications of undifferentiated carcinoma with osteoclastic giant cells of the pancreas: an analysis of 15 cases. Cancer Cytopathol. 2017;125:563–575. doi: 10.1002/cncy.21859. - DOI - PubMed
    1. Chen J, Baithun SI. Morphological study of 391 cases of exocrine pancreatic tumours with special reference to the classification of exocrine pancreatic carcinoma. J Pathol. 1985;146:17–29. doi: 10.1002/path.1711460103. - DOI - PubMed
    1. Jo S. Huge undifferentiated carcinoma of the pancreas with osteoclast-like giant cells. World J Gastroenterol: WJG. 2014;20:2725. doi: 10.3748/wjg.v20.i10.2725. - DOI - PMC - PubMed
    1. Maksymov V, Khalifa MA, Bussey A, Carter B, Hogan M. Undifferentiated (anaplastic) carcinoma of the pancreas with osteoclast-like giant cells showing various degree of pancreas duct involvement. A case report and literature review. JOP Journal of the Pancreas. 2011;12:170–176. - PubMed
    1. Bosman FT, Carneiro F, Hruban RH, Theise ND. WHO classification of tumours of the digestive system. World Health Organization; 2010.

Publication types

Substances