. 2022 Nov 2;30(11):3341-3357.
doi: 10.1016/j.ymthe.2022.06.011. Epub 2022 Jun 22.

CRISPR-mediated MECOM depletion retards tumor growth by reducing cancer stem cell properties in lung squamous cell carcinoma

Affiliations

CRISPR-mediated MECOM depletion retards tumor growth by reducing cancer stem cell properties in lung squamous cell carcinoma

Yuanyuan Ma et al. Mol Ther. .

Abstract

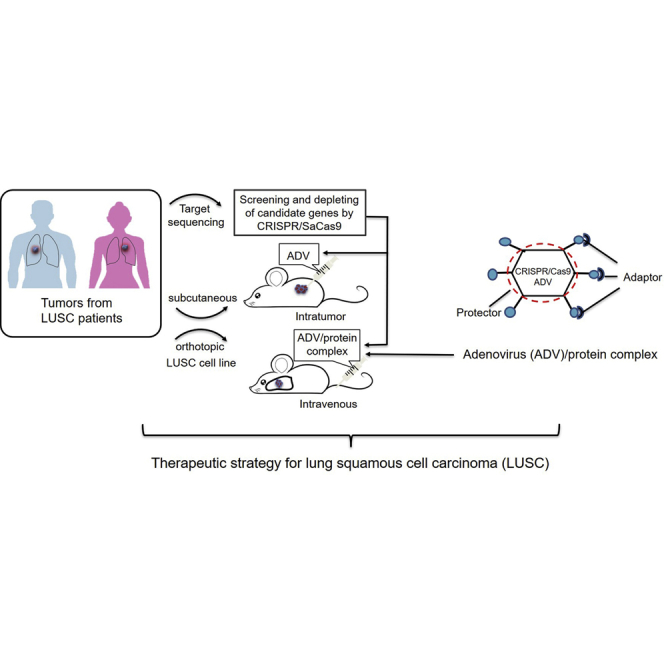
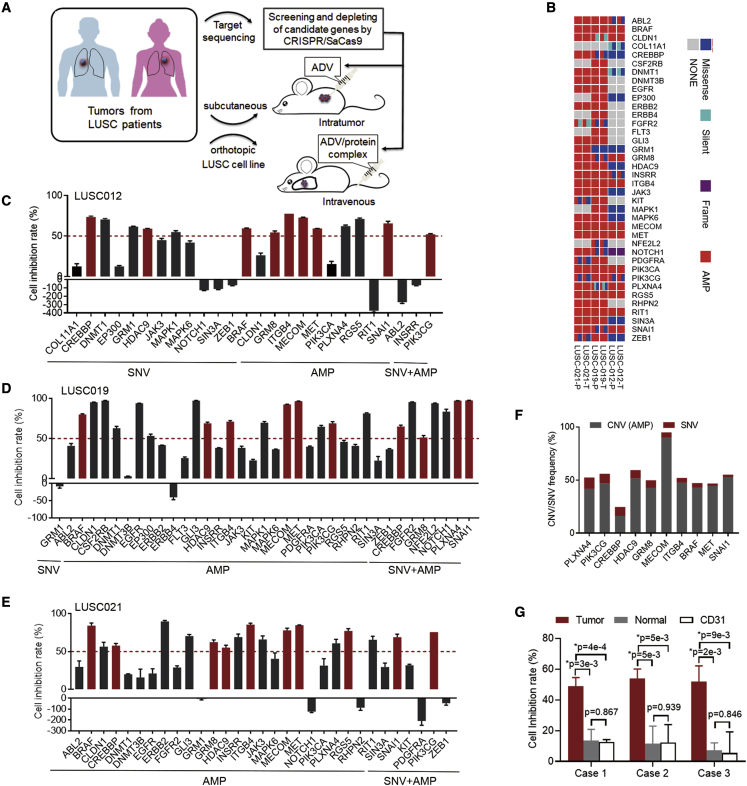
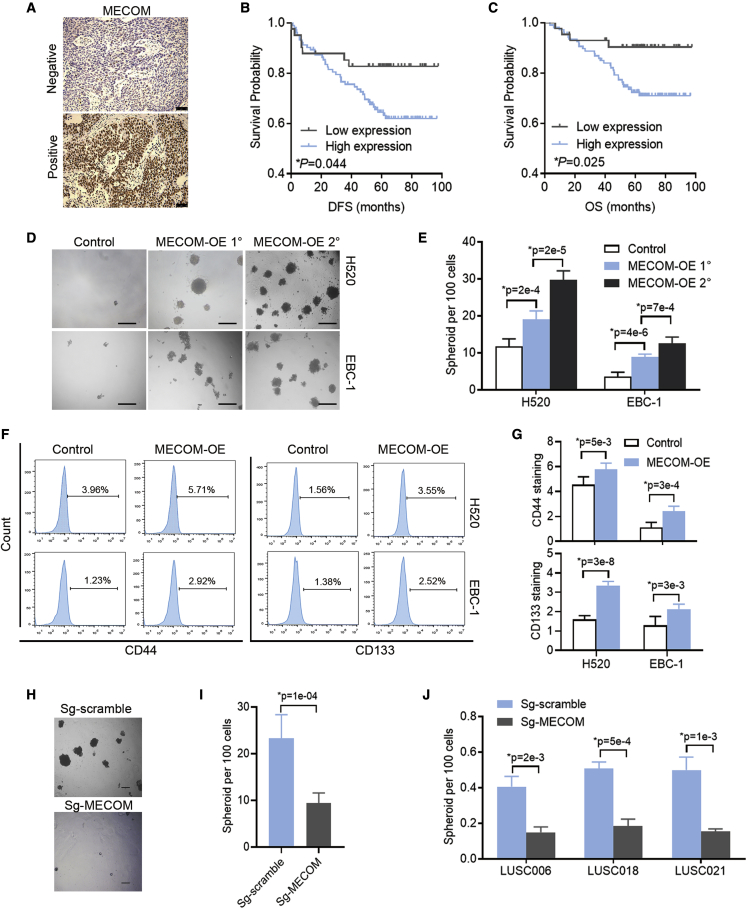
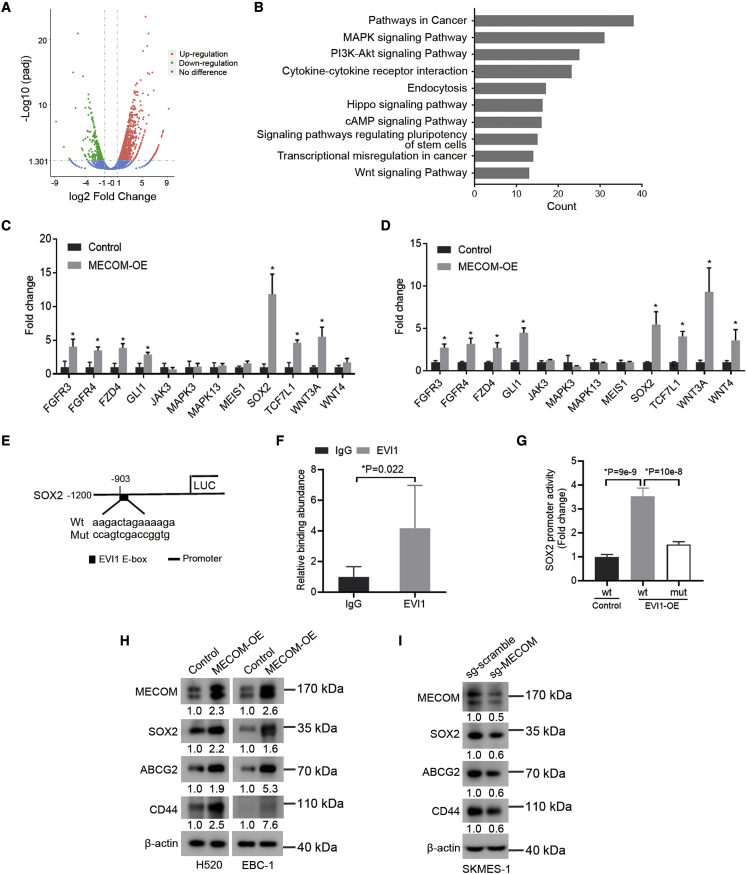
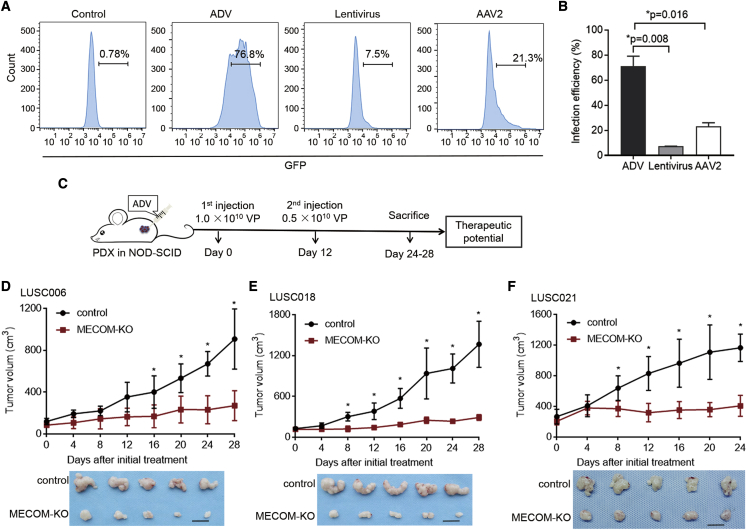
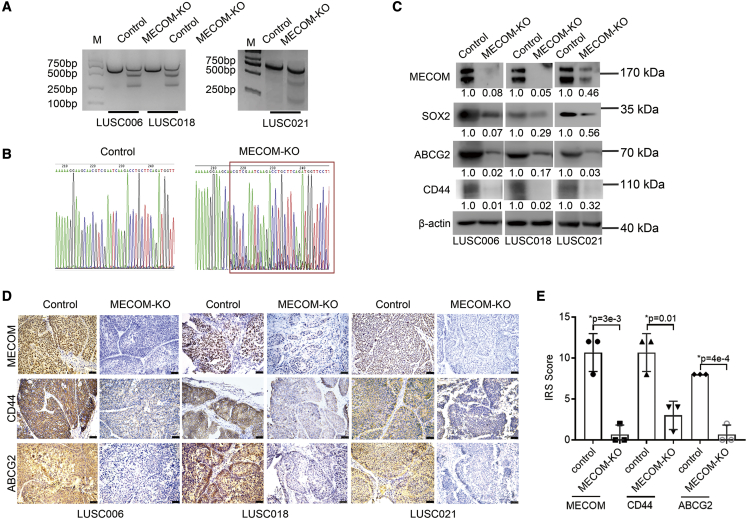
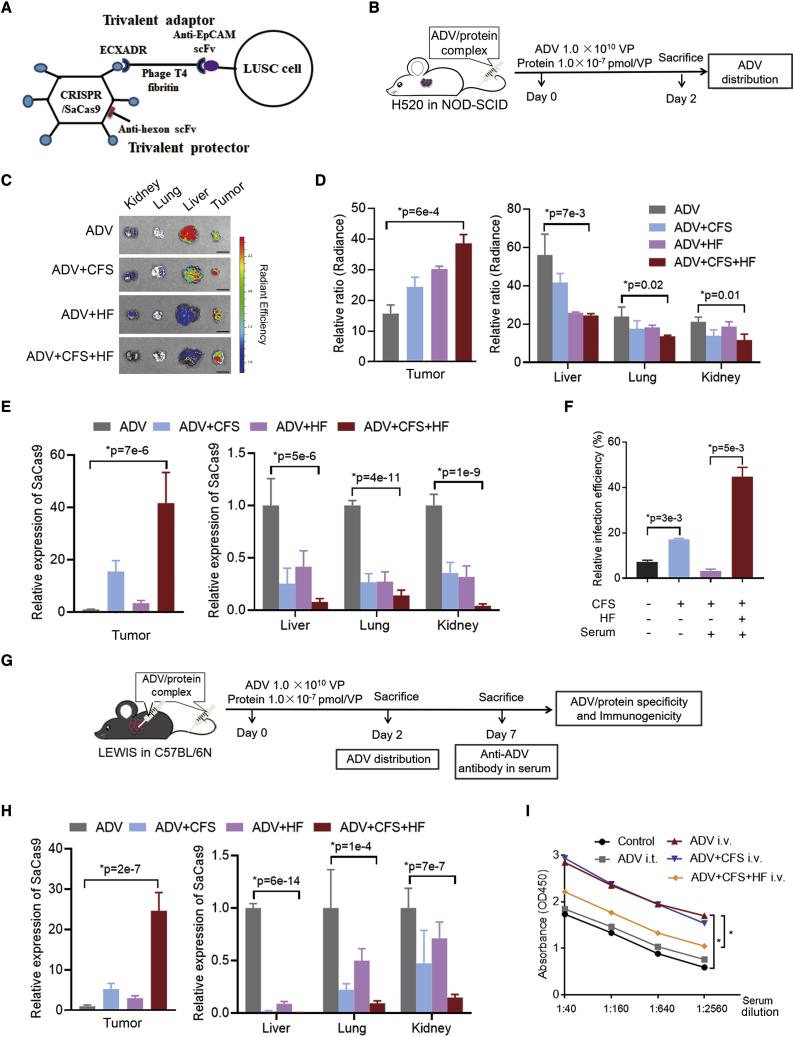
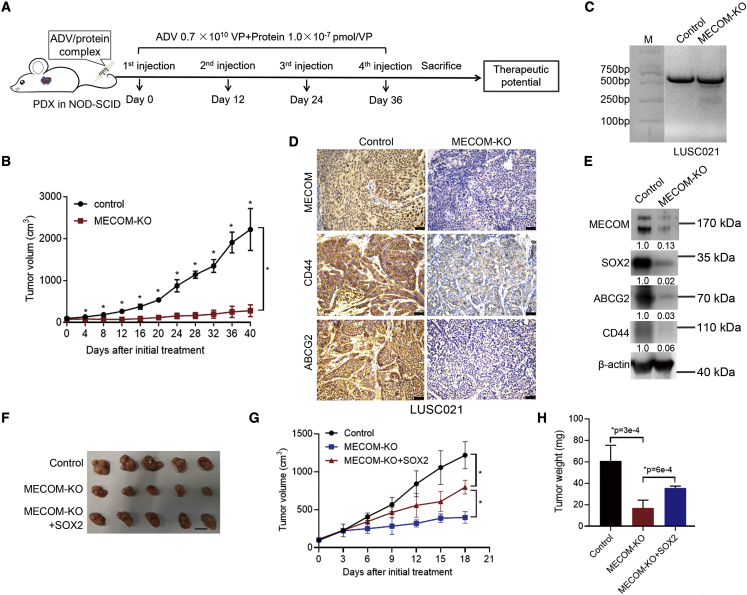
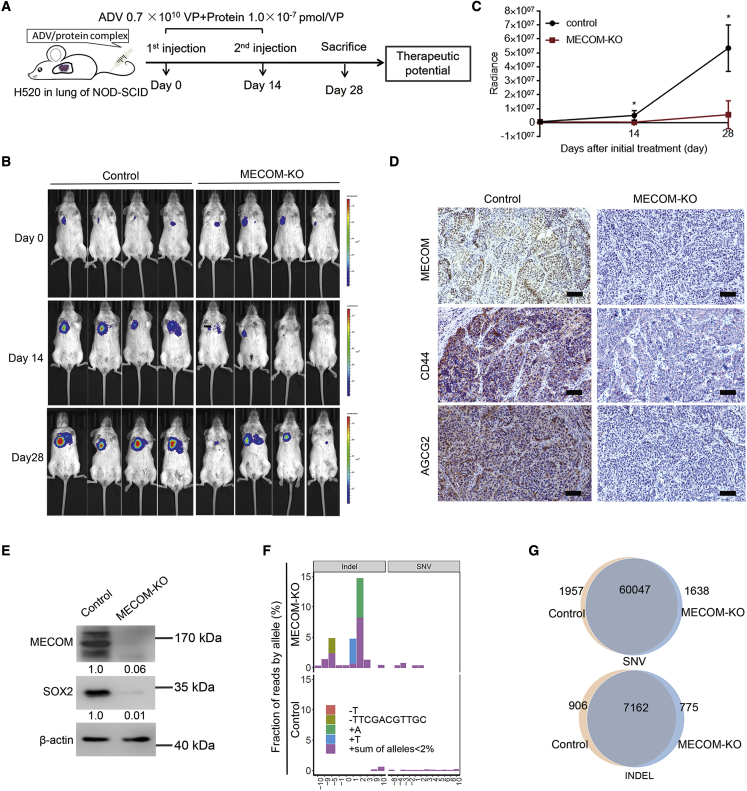
Targeted therapy for lung squamous cell carcinoma (LUSC) remains a challenge due to the lack of robust targets. Here, we identified MECOM as a candidate of therapeutic target for LUSC by screening 38 genes that were commonly amplified in three pairs of primary tumors and patient-derived xenografts (PDXs) using a clustered regularly interspaced short palindromic repeats (CRISPR)-mediated approach. High MECOM expression levels were associated with poor prognosis. Forced expression of MECOM in LUSC cell lines promoted cancer stem cell (CSC) properties, and its knockout inhibited CSC phenotypes. Furthermore, systemic delivery of CRISPR-mediated MECOM depletion cassette using adenovirus with an adaptor, which is composed of a single-chain fragment variable (scFv) against epithelial cell adhesion molecules (EpCAM) fused to the ectodomain of coxsackievirus and adenovirus receptor, and a protector, which consists of the scFv connected to the hexon symmetry of the adenovirus, could specifically target subcutaneous and orthotopic LUSC and retard tumor growth. This study could provide a novel therapeutic strategy for LUSC with high efficacy and specificity.

Keywords: CRISPR; MECOM; cancer stem cells; lung squamous cell carcinoma.


Conflict of interest statement

Declaration of interests The authors declare no competing interests.

Figures

None
Graphical abstract
Figure 1
Figure 1
Identification of the therapeutic targets for LUSC (A) Diagram of the present study for identification of the driver-gene targets and evaluation of therapeutic potential using CRISPR-SaCas9-mediated depletion in vitro and in vivo. (B) Aberrant status of 38 driver genes was detected by target sequence in primary (T) and PDX tumors (P) of LUSC012, LUSC19, and LUSC21. AMP, amplification. (C–E) The PDX tumor cells of LUSC012 (C), LUSC019 (D), and LUSC021 (E) were infected with the lentivirus expressing the corresponding sgRNA for 38 driver genes for 48 h. The inhibition rate of the sgRNA for the driver gene in PDX tumor cells was analyzed, compared to non-targeting sgRNA using CellTiter-Glo detection. The aberrant status was labeled as SNV, amplification (AMP), and SNV + AMP. The dotted lines indicate the inhibition rates of 50%. (F) SNV and AMP frequencies of 10 candidate genes in 501 LUSC cases (The Cancer Genome Atlas [TCGA] database). (G) The primary tumor cells, corresponding normal lung cells, and endothelial cells (CD31+) from 3 cases of LUSC patients were infected with lentivirus expressing non-targeting sgRNA and the sgRNA of MECOM depletion for 48 h by CellTiter-Glo detection. Cell inhibitory rates was calculated. n = 4. ∗p < 0.05, unpaired 2-tailed t test.
Figure 2
Figure 2
The role of MECOM in prognosis of LUSC patients and CSC properties (A) Representative images of MECOM expression in the tumor tissues of LUSC patients by immunohistochemistry. Scale bars, 50 μm. (B and C) DFS (B) and OS (C) curves of 150 LUSC cases with different expression levels of MECOM. (D and E) The representative photographs (D) and statistical efficiencies (E) of primary (1°) and secondary (2°) spheroids in H520 and EBC-1 cells with forced expression of MECOM (MECOM-OE). n = 6. Scale bars, 100 μm. (F and G) The representative images (F) and percentages (G) of CD44 and CD133 in H520 and EBC-1 cells with forced expression of MECOM (MECOM-OE). n = 6. (H and I) The representative photographs (H) and statistical efficiencies (I) of spheroids in SKMES-1 cells with depleted MECOM (sg-MECOM). Scramble sgRNA (Sg-scramble) was as the control. n = 6. Scale bars, 100 μm. (J) Spheroid efficiencies in PDX tumor cells of LUSC006, LUSC018, and LUSC021 with depleted MECOM. n = 3. ∗p < 0.05, unpaired 2-tailed t test in (E), (G), (I), and (J).
Figure 3
Figure 3
MECOM stimulates SOX2′ transcriptional response (A and B) Volcano map (upregulation, 1,217; downregulation, 428; no difference, 20,317; padj < 0.05, log2 fold change >1) and functional enrichment (B) of differential genes regulated by MECOM, which is forcedly expressed in H520 cells using RNA sequencing analyses. (C and D) The gene expression was examined in H520 (C) and EBC-1 (D) cells with forced expression of MECOM (MECOM-OE) by quantitative real-time-PCR analysis. n = 3. (E) The wild-type (WT) and mutant sequences of predicted binding sites on the promoter of SOX2 with EVI1, using JASPAR online software. (F) The ChIP assay was done in H520 cells with forced expression of MECOM using EVI1 antibody or immunoglobulin G (IgG). The specific primers were used to amplify the binding sequence on the promoter of SOX2 by quantitative real-time-PCR. n = 6. (G) The control and forcedly expressed EVI1 (EVI1-OE) cells of H520 were transfected with the pGL3-basic vectors with WT or mutant (mut) EVI1′ binding sequences for 48 h. The relative binding activity of EVI1 with the SOX2′ promoter was analyzed using luciferase reporter assays. Renilla reporter was used as the internal control for normalizing luciferase values. n = 6. (H) Western blots show expression of MECOM, SOX2, ABCG2, and CD44 in H520 and EBC-1 cells with forced expression of MECOM (MECOM-OE). (I) Western blots demonstrate expression of the indicated protein in SKMES-1 cells with depleted MECOM (sg-MECOM). β-actin was used as loading control. The numerical value under the band shows densitometric analyses of the indicated protein expression, compared to the corresponding control, which was normalized as “1.0.” ∗p < 0.05, unpaired 2-tailed t test in (C), (D), (F), and (G).
Figure 4
Figure 4
ADV-CRISPR-SaCas9-mediated MECOM depletion inhibits tumor growth in LUSC PDX models (A and B) Three types of viruses (ADV, 1 × 1010 VP; lentivirus, 1 × 109 VP; AAV2, 1 × 1012 VP) expressing GFP were intratumorally injected into the LUSC021 PDX model (NOD-SCID mice). The representative images (A) and infection efficiencies (B) of ADV, lentivirus, and AAV2 in the tumors isolated from those mice treated with different viruses by flow cytometry detection. (C–F) A diagram (C) for intratumoral administration of ADV-CRISPR-SaCas9-mediated MECOM depletion in PDX models (NOD-SCID mice). The ADV system was intratumorally injected at days 0 and 12 with the amounts of 1.0 × 1010 VP and 0.5 × 1010 VP, respectively. Tumor growth curves and representative tumor photos of PDX models including LUSC006 (D), LUSC018 (E), and LUSC021 (F) treated with MECOM-depleted ADV (MECOM-KO) or control ADV. Scale bars, 1 cm. n = 5. ∗p < 0.05, unpaired 2-tailed t test.
Figure 5
Figure 5
MECOM depletion suppressed CSC-associated factors (A and B) ADV-CRISPR-SaCas9 with MECOM depletion (MECOM-KO) was intratumorally injected into the PDX models. After 2 days, the tumors were isolated from the LUSC006, LUSC018, and LUSC021 cases for gene editing analyses using T7EI assay (A: LUSC006, LUSC018, and LUSC021) and Sanger sequence (B: LUSC021). (C–E) After 24–28 days, the treated tumors were isolated from the LUSC006, LUSC018, and LUSC021 cases for western blot and immunohistochemistry assays. Western blots (C) show MECOM, SOX2, ABCG2, CD44, and β-actin expression in the tumor samples of LUSC006, LUSC018, and LUSC021 models with depleted MECOM (MECOM-KO). β-Actin was used as the loading control. The numerical value under the band shows densitometric analyses of the indicated protein expression, compared to the corresponding control, which was normalized as “1.0.” Photographs (D) and IRS scores (E) of MECOM, CD44, and ABCG2 in the tumor samples of LUSC006, LUSC018, and LUSC021 models with MECOM-depleted ADV (MECOM-KO) by immunohistochemistry analyses. Scale bars, 50 μm. ∗p < 0.05, unpaired 2-tailed t test.
Figure 6
Figure 6
The function of adaptor and protector (A) Construction of adaptor (CFS) and protector (HF) proteins. The CFS was composed of a humanized anti-EpCAM scFv, the ectodomain of CXADR, and a phage T4 fibritin polypeptide. The HF was composed of a humanized scFv against the hexon protein of ADV and a phage T4 fibritin polypeptide. (B–E) A diagram (B) for intravenous administration of ADV with or without CFS and HF proteins on NOD-SCID mice with H520 xenograft. ADV was incubated with CFS, HF, and CFS + HF for 2 h, and this ADV/protein complex was injected into the mice via the tail vein. The amount of ADV was 1.0 × 1010 VP and concentration of the protein was 1.0 × 10−7 pmol/VP. After administration of ADV, ADV + CFS, ADV + HF, and ADV + CFS + HF for 48 h, the tumor, liver, lung, and kidney isolated from the mice were analyzed for distribution of ADV expressing GFP and SaCas9. The representative images (C) and relative abundance (D) of GFP bioluminescence and quantitative real-time-PCR analyses of SaCas9 (E) were demonstrated. n = 3. (F) ADV expressing GFP was incubated with CFS and HF proteins for 2 h, followed by adding serum of C57BL/6N mice for 1 h. The amounts of proteins and serum were 1.0 × 10−7 pmol/VP and 5 μL, respectively. The mixture was added in the LEWIS cells (mouse lung cancer cell line) for 48 h. The multiplicity of infection (MOI) of ADV was 1:500. The relative infection efficiencies were detected by comparing the ratios of GFP by flow cytometry. (G–I) A diagram (G) for intratumoral and intravenous administration of ADV with or without CFS and HF on LEWIS xenograft (C57BL/6N mice). ADV was incubated with CFS, HF, and CFS + HF for 2 h, and this ADV/protein complex was injected into the mice via intratumor and tail vein. The amount of ADV was 1.0 × 1010 VP and concentration of the protein was 1.0 × 10−7 pmol/VP. The ADV distribution in the isolated tumor, liver, lung, and kidney of C57BL/6N mice was detected after 2 days by quantitative real-time-PCR analyses of SaCas9 (H). The abundance of anti-ADV antibody in serum of C57BL/6N mice was administrated with ADV/protein complex as indicated by ELISA analyses after 7 days (I). The control mice were untreated. i.t., intratumor; i.v., intravenous, via tail vein. n = 3. ∗p < 0.05, unpaired 2-tailed t test in (D–(F), (H), and (I).
Figure 7
Figure 7
Intravenous administration of MECOM depletion by ADV, adaptor, and protector complex (A and B) A diagram (A) for therapeutic treatment with the complex CFS, HF, and ADV with depleted MECOM in NOD-SCID mice (LUSC021 PDX model) via tail-vein injection. MECOM-depleted ADV was incubated with CFS and HF to form ADV/protein complex for 2 h. The complex was injected into the NOD-SCID mice via tail vein for 4 rounds with a 12-day interval. The ADV amount was 0.7 × 1010 VP, and the protein concentration was 1.0 × 10−7 pmol/VP. The growth curve (B) of LUSC021 PDX mice with the ADV/protein complex (MECOM-KO) via tail-vein injection. The ADV/protein complex expressing non-targeting sgRNA was used as the control. n = 4, ∗p < 0.05, unpaired 2-tailed t test. (C) The image of T7EI detection in the ADV/protein-treated tumors after administration for 48 h. (D) Immunohistochemistry staining shows MECOM, ABCG2, and CD44 expression in the tumors with treatment of ADV/protein. Scale bar, 50 μm. (E) Western blots demonstrate the indicated protein expression in the tumors with treatment of ADV/protein. β-Actin was used as loading control. The numerical value under the band shows densitometric analyses of the indicated protein expression, compared to the corresponding control, which was normalized as “1.0.” (F–H) The ADV viruses including control, MECOM depletion (MECOM-KO), and MECOM-KO plus SOX2 overexpression (MECOM-KO + SOX2) were intratumorally injected into the NOS-SCID mice (LUSC021). The ADV was intratumorally injected at days 0 and 12 with the amounts of 1.0 × 1010 VP and 0.5 × 1010 VP, respectively. Tumor image (F), growth curve (G), and tumor weight graph (H) of LUSC021 PDX model with indicated treatment. Scale bar, 1 cm. n = 5, ∗p < 0.05, unpaired 2-tailed t test.
Figure 8
Figure 8
Intravenous administration of MECOM-depleted ADV/protein complex in orthotopic xenograft model (A–C) A diagram (A) for intravenous administration of ADV/protein complex with MECOM depletion in H520 orthotopic xenograft (NOD-SCID mice). MECOM-depleted ADV was incubated with CFS and HF proteins to form ADV/protein complex for 2 h. The complex was injected into the mice via tail vein for 2 rounds with a 14-day interval. The ADV amount was 0.7 × 1010 VP, and the protein concentration was 1.0 × 10−7 pmol/VP. The bioluminescent imaging (BI) was taken on days 0, 14, and 28 after ADV delivery to demonstrate the tumor growth. Bioluminescent images (B) and growth curves (C) of orthotopic tumors treated with MECOM-depleted ADV/protein complex (MECOM-KO) via tail-vein injection. n = 4. ∗p < 0.05, unpaired 2-tailed t test. (D) Immunohistochemistry staining demonstrates MECOM, ABCG2, and CD44 expression in the H520 orthotopic xenografts treated with ADV/protein complex including control and MECOM depletion groups. Scale bar, 100 μm. (E) Western blots show the indicated proteins in the H520 orthotopic xenografts treated with ADV/protein complex, including control and MECOM depletion groups. β-Actin was used as loading control. The numerical value under the band shows densitometric analyses of the indicated protein expression, compared to the corresponding control, which was normalized as “1.0.” (F) On-target and off-target mutations detected by WES sequencing in tumor tissues of orthotopic models with MECOM depletion. The frequencies and locations of various on-target and off-target mutations were respectively presented in bar plots with different colors. (G) The charts show the numbers of SNVs and indels detected in the tumors derived from H520 orthotopic xenograft with ADV/protein treatment.

Similar articles

Cited by

References

    1. Siegel R.L., Miller K.D., Jemal A. Cancer statistics, 2020. CA Cancer J. Clin. 2020;70:7–30. doi: 10.3322/caac.21590. - DOI - PubMed
    1. Hirsch F.R., Scagliotti G.V., Mulshine J.L., Kwon R., Curran W.J., Jr., Wu Y.L., Paz-Ares L. Lung cancer: current therapies and new targeted treatments. Lancet. 2017;389:299–311. doi: 10.1016/S0140-6736(16)30958-8. - DOI - PubMed
    1. Behan F.M., Iorio F., Picco G., Gonçalves E., Beaver C.M., Migliardi G., Santos R., Rao Y., Sassi F., Pinnelli M., et al. Prioritization of cancer therapeutic targets using CRISPR-Cas9 screens. Nature. 2019;568:511–516. doi: 10.1038/s41586-019-1103-9. - DOI - PubMed
    1. Gandara D.R., Hammerman P.S., Sos M.L., Lara P.N., Jr., Hirsch F.R. Squamous cell lung cancer: from tumor genomics to cancer therapeutics. Clin. Cancer Res. 2015;21:2236–2243. doi: 10.1158/1078-0432.CCR-14-3039. - DOI - PMC - PubMed
    1. Cancer Genome Atlas Research N. Comprehensive genomic characterization of squamous cell lung cancers. Nature. 2012;489:519–525. doi: 10.1038/nature11404. - DOI - PMC - PubMed

Publication types

MeSH terms

Substances