. 2022 Jul 19;121(14):2684-2692.
doi: 10.1016/j.bpj.2022.06.020. Epub 2022 Jun 22.

Probing local chromatin dynamics by tracking telomeres

Affiliations

Probing local chromatin dynamics by tracking telomeres

Rebecca Benelli et al. Biophys J. .

Abstract

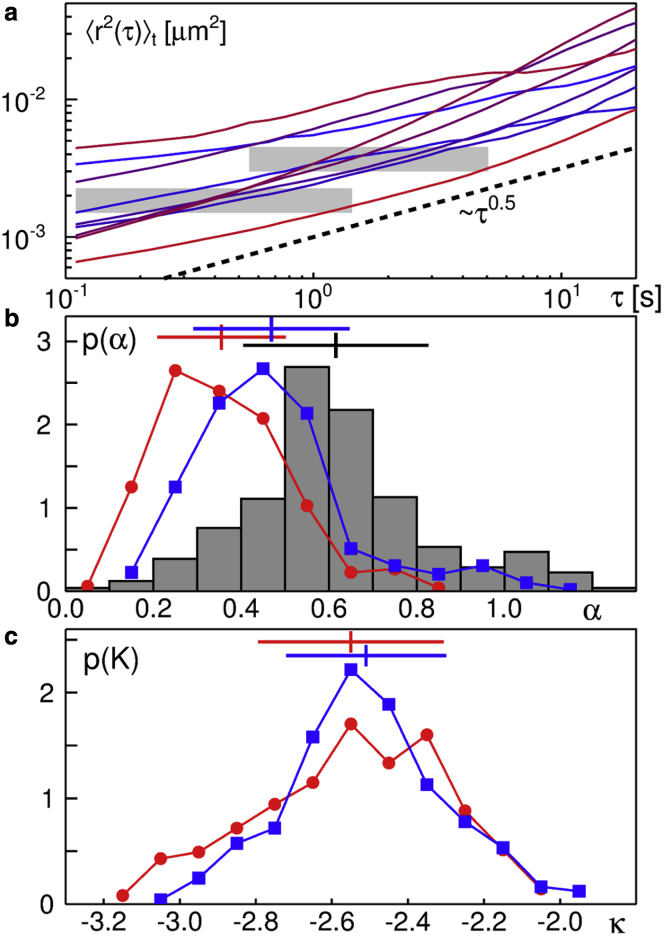
Chromatin dynamics is key for cell viability and replication. In interphase, chromatin is decondensed, allowing the transcription machinery to access a plethora of DNA loci. Yet, decondensed chromatin occupies almost the entire nucleus, suggesting that DNA molecules can hardly move. Recent reports have even indicated that interphase chromatin behaves like a solid body on mesoscopic scales. To explore the local chromatin dynamics, we have performed single-particle tracking on telomeres under varying conditions. We find that mobile telomeres feature, under all conditions, a strongly subdiffusive, antipersistent motion that is consistent with the monomer motion of a Rouse polymer in viscoelastic media. In addition, telomere trajectories show intermittent accumulations in local niches at physiological conditions, suggesting that the surrounding chromatin reorganizes on these timescales. Reducing the temperature or exposing cells to osmotic stress resulted in a significant reduction of mobile telomeres and the number of visited niches. Altogether, our data indicate a vivid local chromatin dynamics, akin to a semidilute polymer solution, unless perturbations enforce a more rigid or entangled state of chromatin.


Conflict of interest statement

Declaration of interests The authors declare no competing interests.

Figures

Figure 1
Figure 1
(a) Representative TA-MSDs of telomeres obtained from U2OS cells at physiological conditions. As a guide to the eye, a sublinear power law is shown as a dashed line. Due to different local environments, individual TA-MSDs show a considerable variation in their scaling and their mobility coefficient (cf. Eq. 2). Fit regions (A) and (B), defined as 1τ/Δt13 and 5τ/Δt46, are highlighted by horizontal gray bars. (b) The PDF of scaling exponents, p(α), as obtained by fitting TA-MSDs in the intervals (A) and (B) (red circles and blue squares) feature a similar width σ but different means α (indicated by haircrosses). In line with the anticipated effect of a static localization error, a larger mean is obtained for fit interval (B). Using a resampling approach yields a considerably wider PDF (gray histogram) with an even more elevated mean. See also main text for discussion. (c) The associated PDF of generalized diffusion coefficients, p(K), for convenience shown here as a function of κ that reports on the typical area covered within 1 s (cf. Eq. 3), features a roughly lognormal shape with a similar mean for both fitting intervals. To see this figure in color, go online.
Figure 2
Figure 2
(a) The ensemble- and time-averaged VACF (Eq. 5) of telomeres in untreated cells at 37°C, shown for n = 3, 5, and 7 (circles, diamonds, and squares), is well captured by the analytical prediction for FBM in the presence of a static localization error (gray line). Deviations to the prediction of an unperturbed FBM random walk (thin black line) are clearly visible. Inset: the value C(ξ=1) for n = 3 changes with the anomaly exponent α (from fit interval (B)) as predicted for FBM processes (gray line). (b) Ensemble-averaged PSDs for x and y coordinates (black line and diamonds) follow the anticipated power-law decay (dashed line), about which the PSD of individual trajectory coordinates fluctuate (examples shown in different colors). Inset: the coefficient of variation γ converges to unity for large frequencies, as predicted for FBM processes. To see this figure in color, go online.
Figure 3
Figure 3
(a) Two representative trajectories (clouds of black dots, with their respective envelope indicated in red) are classified by our automatic image analysis to consist of one and two blobs, respectively (see grey-shaded regions on the right). (b) The average number of blobs nB within a trajectory shows a roughly linear increase with the trajectory length N in cells at physiological conditions (open black circles and full black line). For very long trajectories, considerable fluctuations around this trend are observed. Simulated FBM trajectories with α = 0.4, 0.5, and 0.6 (blue, orange, and green symbols and lines) also show a linear increase, yet with a significantly lower slope. To see this figure in color, go online.
Figure 4
Figure 4
(a) Change of the mean anomaly exponent α and mean logarithmic diffusion coefficient κ (Eq. 3) at different temperatures. Error bars denote the standard deviation of the associated PDF. Testing any two PDFs p(α) from different conditions were rated to be significantly different by a Kolmogorov-Smirnov test at a level p < 0.001. (b) The mean number of blobs, nB, as a function of trajectory length, N, decreases with temperature but stays above the result for FBM trajectories with α = 0.6 (dashed green). Full lines were obtained by linear regression of the respective datasets. To see this figure in color, go online.
Figure 5
Figure 5
(a) Change of mean anomaly exponent α and mean logarithmic diffusion coefficient κ (Eq. 3) at different conditions (un, untreated; c1, c2, and c2, hyperosmotic shock with 250 mM, 500 mM, or 1 M sugar; dil, hypoosmotic shock). Error bars denote the width of the associated PDFs. Testing any two PDFs p(α) from different conditions were rated to be significantly different by a Kolmogorov-Smirnov test at a level of p < 0.001. (b) The mean number of blobs, nB, observed for different trajectory lengths decreases rapidly upon applying any osmotic shock. A strong reduction compared with untreated cells (red line) is observable already for condition c1 (blue line). For larger osmotic shocks (blue background) and dilution (black symbols), virtually no increase in blob number beyond unity can be detected. To see this figure in color, go online.

Similar articles

Cited by

References

    1. Alberts B. Sixth edition. Garland Science, Taylor and Francis Group; 2015. Molecular Biology of the Cell; p. 1.
    1. Halverson J.D., Smrek J., et al. Grosberg A.Y. From a melt of rings to chromosome territories: the role of topological constraints in genome folding. Rep. Prog. Phys. 2014;77:022601. doi: 10.1088/0034-4885/77/2/022601. - DOI - PubMed
    1. Zidovska A. Chromatin: liquid or solid? Cell. 2020;183:1737–1739. doi: 10.1016/j.cell.2020.11.044. - DOI - PubMed
    1. Zidovska A., Weitz D.A., Mitchison T.J. Micron-scale coherence in interphase chromatin dynamics. Proc. Natl. Acad. Sci. USA. 2013;110:15555–15560. doi: 10.1073/pnas.1220313110. - DOI - PMC - PubMed
    1. Strickfaden H., Tolsma T.O., et al. Hendzel M.J. Condensed chromatin behaves like a solid on the mesoscale in vitro and in living cells. Cell. 2020;183:1772–1784.e13. doi: 10.1016/j.cell.2020.11.027. - DOI - PubMed

Publication types

LinkOut - more resources