. 2023 Jan;56(1):e13297.
doi: 10.1111/cpr.13297. Epub 2022 Jun 22.

N6 -methyladenosine-modified circRNA RERE modulates osteoarthritis by regulating β-catenin ubiquitination and degradation

Affiliations

N6 -methyladenosine-modified circRNA RERE modulates osteoarthritis by regulating β-catenin ubiquitination and degradation

Yuxi Liu et al. Cell Prolif. 2023 Jan.

Abstract

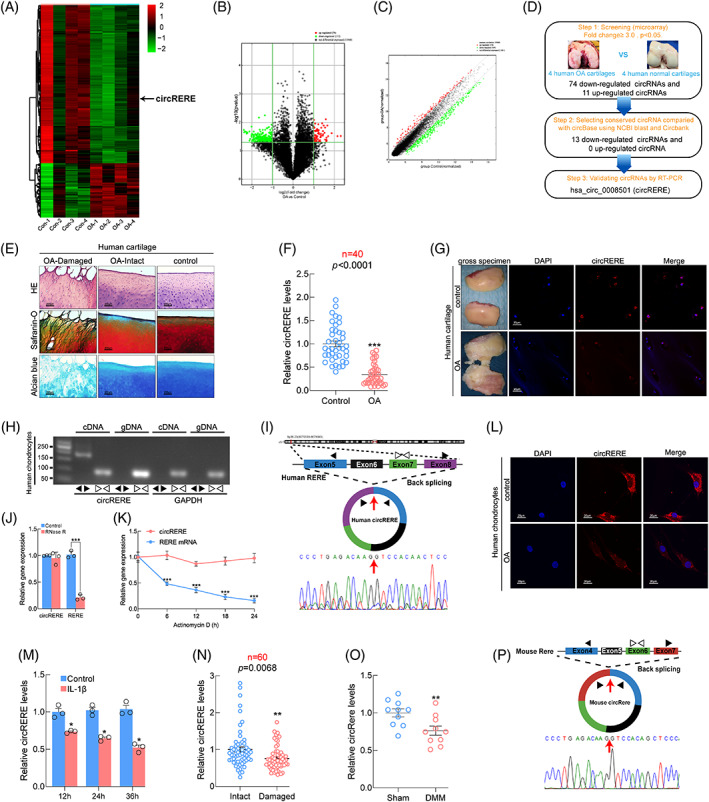
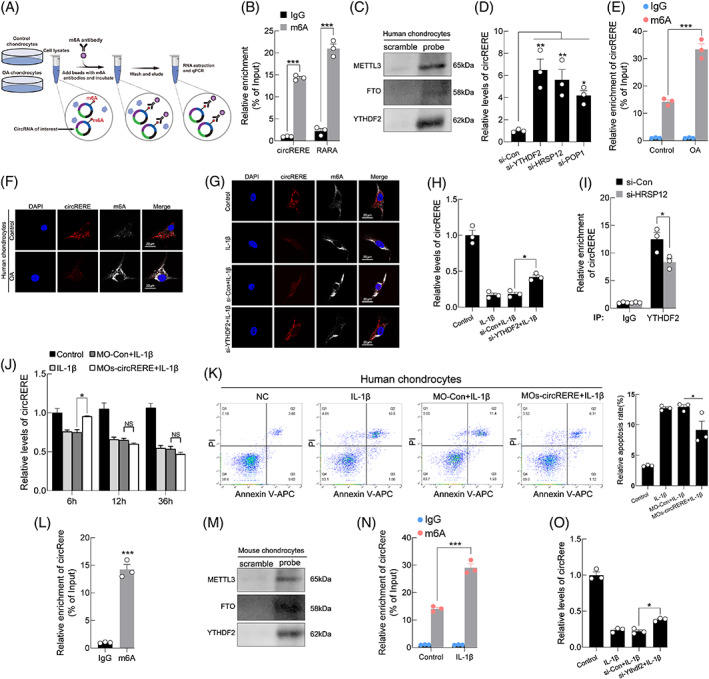
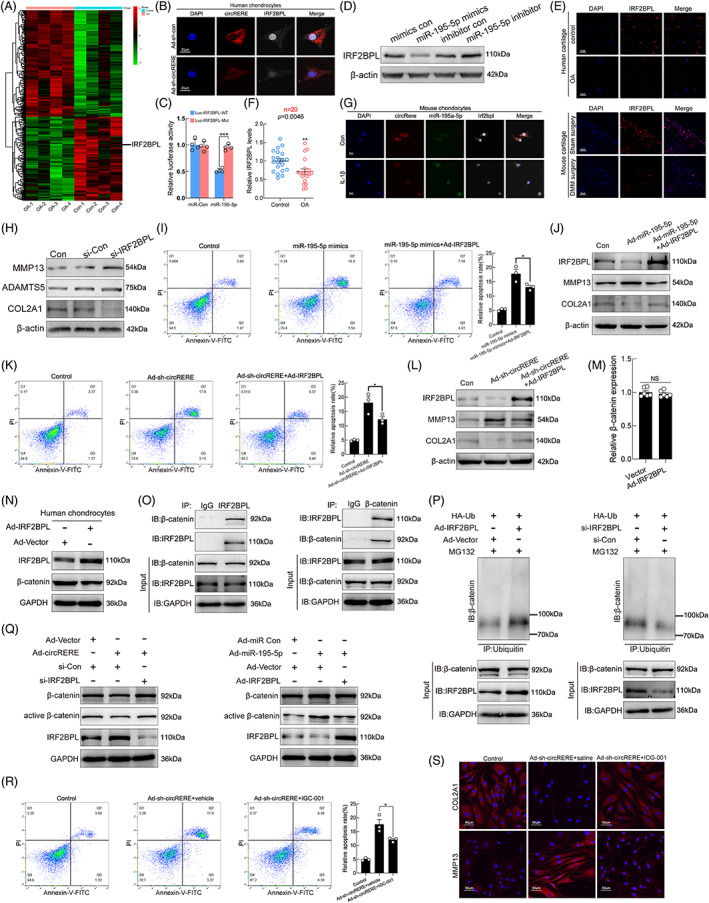
Objectives: N6 -methyladenosine (m6A) is one of the most abundant internal RNA modifications. We investigated the role of m6A-modified circRERE in osteoarthritis (OA) and its mechanism.

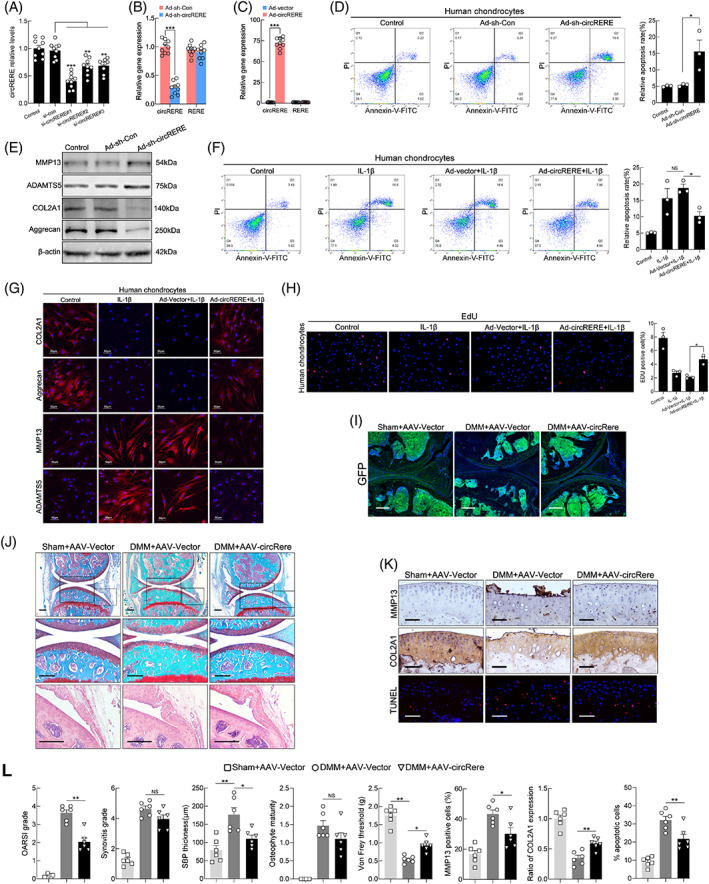
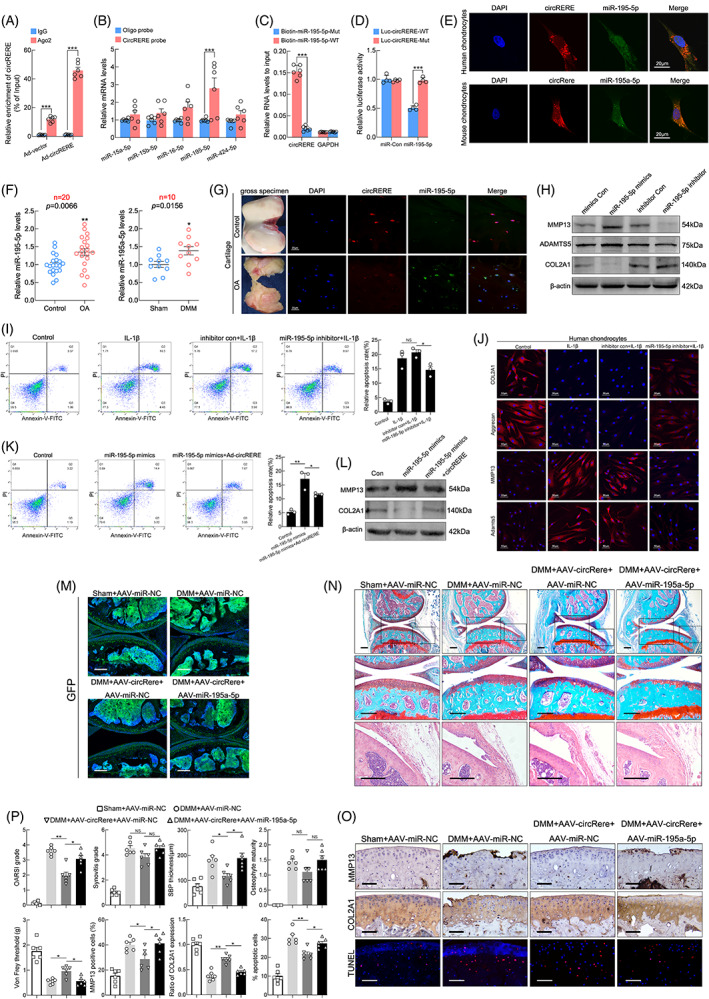
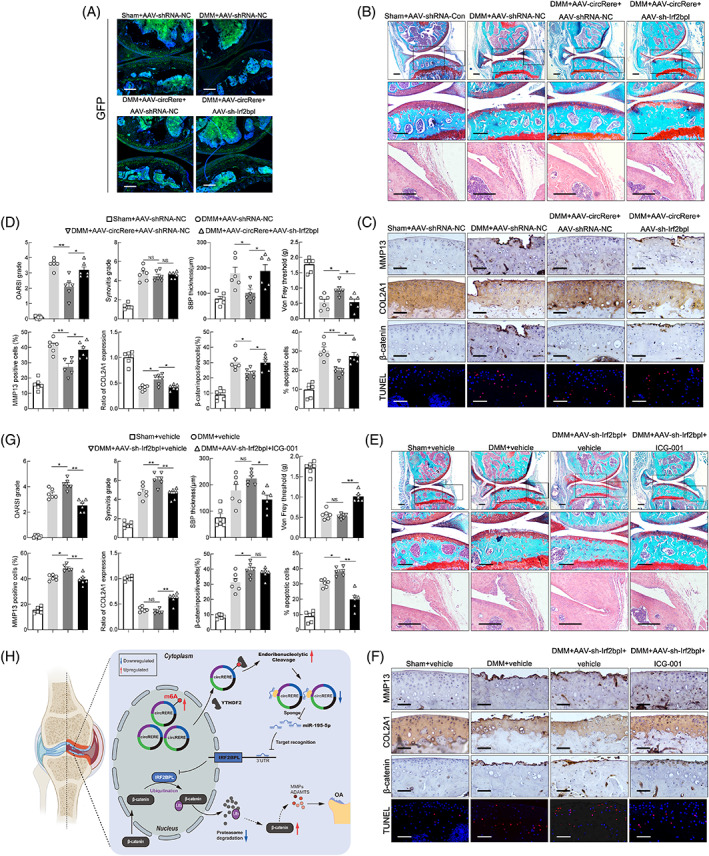
Materials and methods: CircRERE and IRF2BPL were screened by microarrays. The role of m6A-modification in circRERE was examined by methylated RNA precipitation and morpholino oligo (MOs) treatment. The axis of circRERE/miR-195-5p/IRF2BPL/β-catenin was determined using flow cytometry, western blotting and immunofluorescence in human chondrocytes (HCs) and corroborated using a mouse model of destabilization of medial meniscus (DMM) with intra-articular (IA) injection of adeno-associated viruses (AAV).

Results: CircRERE was decreased in OA cartilage and chondrocytes compared with control. CircRERE downregulation was likely attributed to its increased m6A modification prone to endoribonucleolytic cleavage by YTHDF2-HRSP12-RNase P/MRP in OA chondrocytes. MOs transfection targeting HRSP12 binding motifs in circRERE partially reversed decreased circRERE expression and increased apoptosis in HCs treated with IL-1β for 6 h. CircRERE exerted chondroprotective effects by targeting miR-195-5p/IRF2BPL, thus regulating the ubiquitination and degradation of β-catenin. CircRere (mouse homologue) overexpression by IA-injection of AAV-circRere into mice attenuated the severity of DMM-induced OA, whereas AAV-miR-195a-5p or AAV-sh-Irf2bpl reduced the protective effects. The detrimental effects of AAV-sh-Irf2bpl on DMM-induced OA were substantially counteracted by ICG-001, an inhibitor of β-catenin.

Conclusions: Our study is a proof-of-concept demonstration for targeting m6A-modified circRERE and its target miR-195-5p/IRF2BPL/β-catenin as potential therapeutic strategies for OA treatment.


Conflict of interest statement

The authors declare no competing interests.

Figures

FIGURE 1
FIGURE 1
Identification of circRERE in human chondrocytes and cartilage. (A) Heat map representing differentially expressed circRNAs between human control and osteoarthritis (OA) cartilage (Fold change≥2, p < 0.05). CircRERE is indicated. (B, C) Volcano and Scatter plots illustrating the statistical significance of differentially expressed circRNAs. (D) Steps for identification of circRERE. (E) Representative histomorphological staining of human damaged and intact OA cartilage and control cartilage. Scale bar, 200 μm. (F) QRT‐PCR for expression of circRERE in human control and OA cartilage (n = 40). ***p < 0.01 by Mann–Whitney U test. (G) fluorescence in situ hybridization (FISH) of circRERE in human control and OA cartilage. Scale bar, 20 μm. (H, I) Validation of circRERE in HCs by RT‐PCR and Sanger sequence. (J) QRT‐PCR for the expression of circRERE and RERE in HCs treated with or without RNase R (n = 3). ***p < 0.001 by two‐tailed unpaired t test. (K) QRT‐PCR for the abundance of circRERE and RERE in HCs treated with Actinomycin D at indicated time (n = 3). ***p < 0.001 by two‐way ANOVA with Tukey's post hoc test. (L) FISH of circRERE in human control and OA chondrocytes. Scale bar, 20 μm. (M) Changes of circRERE in IL‐1β‐stimulated (10 ng/mL) HCs at indicated time. *p < 0.05 versus control by two‐way ANOVA with Tukey's post hoc test. (N) Relative expression of circRERE in human paired damaged and intact OA cartilage (n = 60). **p < 0.01 by two‐tailed Wilcoxon matched‐pairs signed rank test. (O) QRT‐PCR for expression of circRere in mouse cartilage from DMM and sham groups (n = 10). **p < 0.01 by two‐tailed unpaired t test. (P) Validation of circRere by Sanger sequence. Data are presented as mean ± SEM
FIGURE 2
FIGURE 2
Overexpression of circRERE/circRere ameliorated osteoarthritis (OA) progression. (A) QRT‐PCR for circRERE expression in HCs transfected with circRERE siRNA or negative control (n = 9, concentration of 20 nM, 48 h). **p < 0.01, ***p < 0.001 by one‐way ANOVA with Tukey's post hoc test. (B, C) QRT‐PCR for circRERE and RERE expression in HCs infected with Ad‐sh‐Con, Ad‐sh‐circRERE, Ad‐vector or Ad‐circRERE (n = 9). ***p < 0.001 by two‐tailed unpaired t test. (D, E) HCs were infected with Ad‐sh‐Con or Ad‐sh‐circRERE. Cell apoptosis was determined by flow cytometry (FCM) (D, n = 3). *p < 0.05 by one‐way ANOVA with Tukey's post hoc test. Western blotting (WB) analysis for MMP13, ADAMTS5, COL2A1 and Aggrecan in HCs (E). (F‐H) HCs were infected with Ad‐vector or Ad‐circRERE and stimulated with IL‐1β (10 ng/mL) for 48 h. FCM assays for detection of apoptosis in HCs (n = 3, F). *p < 0.05 by one‐way ANOVA with Tukey's post hoc test. Immunofluorescence (IF) of COL2A1, Aggrecan, MMP13 and ADAMTS5 in HCs (G). Scale bar, 50 μm. Proliferation of HCs was determined by EdU assays (n = 3, H). *p < 0.05 by one‐way ANOVA with Tukey's post hoc test. (I) To investigate the infected efficiency of AAV, representative knee cartilage fluorescence (GFP) images in knee sections from three groups were obtained by a confocal microscope. Scale bar, 200 μm. (J) Representative images of Safranin O‐fast green and haematoxylin–eosin (HE) staining in knee sections from three groups 8 weeks after DMM. Scale bar, 200 μm. (K) IHC staining for MMP13 and COL2A1, and TUNEL assay in mouse cartilage. Scale bar, 50 μm. (L) Scoring of OA parameters (OARSI grade, synovitis score, subchondral bone plate (SBP) thickness, osteophyte maturity and Von Frey threshold). Quantification of MMP13 and COL2A1 expression, and apoptotic chondrocytes in mouse cartilage (n = 6). *p < 0.05, **p < 0.01 by one‐way ANOVA with Tukey's post hoc test. Data are presented as mean ± SEM. NS, no significance
FIGURE 3
FIGURE 3
Modulation of m6A methylation on circRERE. (A) Flow chart of m6A‐specific immunoprecipitation (MeRIP) assays. (B) MeRIP assay showing that circRERE was highly enriched in immunoprecipitates (IPs) of m6A antibody (n = 3). ***p < 0.001 by two‐tailed unpaired t test. RARA, which is a known m6A‐containing RNA, was used as a positive control. (C) RNA pulldown assays and WB analysis for METTL3, FTO and YTHDF2 using a circRERE probe. (D) The expression of endogenous circRERE in HCs transfected with indicated siRNA (at final concentration of 20 nM) (n = 3). *p < 0.05, **p < 0.01 by one‐way ANOVA with Tukey's post hoc test. (E) MeRIP assays indicating the increased m6A‐modification of circRERE in human osteoarthritis (OA) chondrocytes compared with control (n = 3). The percentage of the input is shown. ***p < 0.001 by two‐way ANOVA with Tukey's post hoc test. (F) Fluorescence in situ hybridization (FISH) (circRERE)‐IF (m6A) staining in human OA and control chondrocytes. (G, H) FISH (circRERE)‐IF (m6A) staining (G) and qRT‐PCR for the expression of circRERE in HCs transfected with si‐YTHDF2 and stimulated with IL‐1β (10 ng/mL) for 48 h (H, n = 3). *p < 0.05 by one‐way ANOVA with Tukey's post hoc test. (I) CO‐IP of YTHDF2 in HCs transfected with si‐Con or si‐HRSP12 (n = 3). The amount of CO‐IPed endogenous circRERE was normalized to the level of endogenous GAPDH mRNA. Then, the normalized levels obtained in IPs with IgG in si‐Con transfected HCs were arbitrarily set to 1. *p < 0.05 by two‐tailed unpaired t test. (J) QRT‐PCR for circRERE expression in HCs transfected with MOs‐circRERE and stimulated with IL‐1β (10 ng/mL) at indicated time (n = 3). *p < 0.05 by two‐way ANOVA with Tukey's post hoc test. (K) FCM of HCs treated with MOs‐circRERE and stimulated with IL‐1β for 6 h (n = 3). *p < 0.05 by one‐way ANOVA with Tukey's post hoc test. (L) MeRIP assay showing that circRere was highly enriched in IPs of m6A antibody (n = 3). ***p < 0.001by two‐tailed unpaired t test. (M) RNA pulldown assays and WB analysis for METTL3, FTO and YTHDF2 using a circRere probe. (N) MeRIP assay showing the increased percentage of m6A‐containing circRere in MCs treated with IL‐1β (10 ng/mL, 48 h) compared with control (n = 3). ***p < 0.001 by two‐way ANOVA with Tukey's post hoc test. (O) QRT‐PCR for circRere expression in MCs transfected with si‐Ythdf2 and stimulated with IL‐1β. *p < 0.05 by one‐way ANOVA with Tukey's post hoc test. Data are presented as mean ± SEM
FIGURE 4
FIGURE 4
CircRERE functions as a sponge for miR‐195‐5p in osteoarthritis (OA). (A) Ago2 RIP assay was performed to detect circRERE levels in HCs infected with Ad‐vector or Ad‐circRERE (n = 6). ***p < 0.001 by two‐tailed unpaired Welch's t test. (B) RNA pull‐down and qRT‐PCR assays for miRNAs in HCs lysates pull‐downed by circRERE or oligo probe (n = 6). ***p < 0.001 by two‐tailed unpaired Welch's t test. (C) Wild‐type (WT) or mutant (Mut) biotinylated‐miR‐195‐5p mimics were transfected into circRERE overexpressing HCs. After streptavidin capture, circRERE levels were analysed by qRT‐PCR (n = 6). ***p < 0.001 by two‐tailed unpaired t test. (D) MiR‐195‐5p mimic or control was co‐transfected with WT or MUT circRERE luciferase reporter vector into HEK293T cells (n = 4). ***p < 0.001by two‐tailed unpaired t test. (E) Fluorescence in situ hybridization (FISH) of circRERE/miR‐195‐5p and circRere/miR‐195a‐5p in HCs and MCs. (F) QRT‐PCR for miR‐195‐5p in human OA and control cartilage (Left, n = 20). **p < 0.01 by two‐tailed unpaired Welch's t test. QRT‐PCR for miR‐195a‐5p in mouse cartilage from DMM and sham groups (Right, n = 10). *p < 0.05 by two‐tailed unpaired t test. (G) FISH of circRERE/miR‐195‐5p in human control and OA cartilage. (H) WB analysis for MMP13, ADAMTS5 and COL2A1 in HCs upon different transfections. (I, J) HCs were transfected with miR‐195‐5p inhibitor or control and stimulated with IL‐1β (10 ng/mL, 48 h). Cell apoptosis was determined by FCM (I, n = 3). *p < 0.05 by one‐way ANOVA with Tukey's post hoc test. IF of COL2A1, Aggrecan, MMP13 and ADAMTS5 in HCs (J). (K) Overexpression of both miR‐195‐5p and circRERE resulted in decreased apoptosis of HCs compared with HCs overexpressing miR‐195‐5p alone (n = 3). *p < 0.05 by one‐way ANOVA with Tukey's post hoc test. (L) WB analysis for MMP13 and COL2A1 in HCs under the same experimental condition of Figure 4K. (M) To investigate the infected efficiency of AAVs, representative knee cartilage fluorescence (GFP) images in knee sections from four groups were obtained by a confocal microscope. Scale bar, 200 μm. (N) Representative images of Safranin O‐fast green, HE staining in knee sections from four groups 8 weeks after DMM. Scale bar, 200 μm. (O) IHC staining for MMP13 and COL2A1, and TUNEL assay in mouse cartilage. Scale bar, 50 μm. (P) Scoring of OA parameters. Quantification of MMP13 and COL2A1 expression, and apoptotic chondrocytes in mouse cartilage (n = 6). *p < 0.05, **p < 0.01 by one‐way ANOVA with Tukey's post hoc test. Data are presented as mean ± SEM
FIGURE 5
FIGURE 5
Modulation of circRERE on β‐Catenin ubiquitination and degradation via targeting miR‐195‐5p/IRF2BPL in human chondrocytes. (A) Heat map representing all differentially expressed mRNAs between human osteoarthritis (OA) and control cartilage (Fold change≥2, p < 0.05). IRF2BPL is indicated. (B) IF (IRF2BPL)‐fluorescence in situ hybridization (FISH) (circRERE) assay showing the decreased IRF2BPL protein level upon circRERE knockdown in HCs. Scale bar, 20 μm. (C) MiR‐195‐5p mimic or mimic control was co‐transfected with WT or MUT IRF2BPL 3'‐UTR luciferase reporter vector into HEK‐293 T cells (n = 4). ***p < 0.001by two‐tailed unpaired t test. (D) WB analysis for IRF2BPL in HCs upon different transfections. (E) IF of IRF2BPL in control and OA cartilage from humans and mice. Scale bar, 20 μm. (F) QRT‐PCR for IRF2BPL expression in human OA and control cartilage (n = 20). **p < 0.01 by Mann–Whitney U test. (G) FISH‐IF staining of circRere/miR‐195a‐5p/IRF2BPL in MCs treated with IL‐β (10 ng/mL, 48 h) or not. Scale bar, 20 μm. (H) Related protein levels in HCs. (I) Overexpression of both miR‐195‐5p and IRF2BPL resulted in decreased apoptosis of HCs compared with HCs overexpressing miR‐195‐5p alone (n = 3). *p < 0.05 by one‐way ANOVA with Tukey's post hoc test. (J) Related protein levels of HCs under the same experimental conditions of Figure 5I. (K) CircRERE knockdown with IRF2BPL overexpression resulted in fewer apoptotic HCs than those observed with circRERE knockdown alone (n = 3). *p < 0.05 by one‐way ANOVA with Tukey's post hoc test. (L) WB analysis for related proteins in HCs. (M, N) HCs were infected with Ad‐Vector or Ad‐IRF2BPL. Then mRNA and protein levels of β‐catenin were detected by qRT‐PCR (M) and WB (N) respectively. (O) CO‐IP of IRF2BPL and β‐catenin in HCs. (P) β‐catenin ubiquitination level upon IRF2BPL overexpression or downregulation was detected by IP. HCs were incubated with indicated adenoviruses, plasmid and siRNA. (Q) WB analysis for β‐catenin, active β‐catenin, IRF2BPL, and GAPDH in HCs after incubation with indicated adenoviruses and siRNA. (R) CircRERE downregulation with ICG‐001 treatment (5 μM) resulted in decreased apoptotic HCs compared with those observed with circRERE downregulation alone (n = 3). *p < 0.05 by one‐way ANOVA with Tukey's post hoc test. (S) IF of COL2A1 and MMP13 in HCs. Data are presented as mean ± SEM
FIGURE 6
FIGURE 6
The role of circRere/miR‐195a‐5p/Irf2bpl/β‐catenin axis in the progression of DMM‐induced osteoarthritis (OA). (A) To investigate the infected efficiency of AAVs, representative knee cartilage fluorescence (GFP) images in knee sections from four groups were obtained by a confocal microscope. Scale bar, 200 μm. (B) Representative images of Safranin O‐fast green and HE staining in knee sections from four groups 8 weeks after DMM. Scale bar, 200 μm. (C) IHC staining for MMP13, COL2A1 and β‐catenin and TUNEL assay in mouse cartilage from above four groups. Scale bar, 50 μm. (D) Scoring of OA parameters. Quantification of MMP13, COL2A1 and β‐catenin expression, and apoptotic chondrocytes in mouse cartilage (n = 6). *p < 0.05, **p < 0.01 by one‐way ANOVA with Tukey's post hoc test. (E) Representative images of Safranin O‐fast green, HE staining in knee sections from four groups 8 weeks after DMM. Scale bar, 200 μm. (F) IHC staining for MMP13, COL2A1 and β‐catenin and TUNEL assay in mouse cartilage from four groups. Scale bar, 50 μm. (G) Scoring of OA parameters. Quantification of MMP13, COL2A1 and β‐catenin expression, and apoptotic chondrocytes in mouse cartilage (n = 6). *p < 0.05, **p < 0.01 by one‐way ANOVA with Tukey's post hoc test. (H) Proposed schematic of m6A‐moidified circRERE and downstream targets during the pathogenesis of OA. Data are presented as mean ± SEM

Similar articles

Cited by

References

    1. Choi WS, Lee G, Song WH, et al. The CH25H‐CYP7B1‐RORalpha axis of cholesterol metabolism regulates osteoarthritis. Nature. 2019;566(7743):254‐258. - PubMed
    1. Hugle T, Geurts J. What drives osteoarthritis?‐synovial versus subchondral bone pathology. Rheumatology (Oxford). 2017;56(9):1461‐1471. - PubMed
    1. Martel‐Pelletier J, Barr AJ, Cicuttini FM, et al. Osteoarthritis. Nat Rev Dis Primers. 2016;2:16072. - PubMed
    1. Zheng L, Zhang Z, Sheng P, Mobasheri A. The role of metabolism in chondrocyte dysfunction and the progression of osteoarthritis. Ageing Res Rev. 2021;66:101249. - PubMed
    1. Rice SJ, Beier F, Young DA, Loughlin J. Interplay between genetics and epigenetics in osteoarthritis. Nat Rev Rheumatol. 2020;16(5):268‐281. - PubMed