. 2022 Sep;55(9):e13278.
doi: 10.1111/cpr.13278. Epub 2022 Jun 22.

Triptolide promotes autophagy to inhibit mesangial cell proliferation in IgA nephropathy via the CARD9/p38 MAPK pathway

Affiliations

Triptolide promotes autophagy to inhibit mesangial cell proliferation in IgA nephropathy via the CARD9/p38 MAPK pathway

Lu Zhao et al. Cell Prolif. 2022 Sep.

Abstract

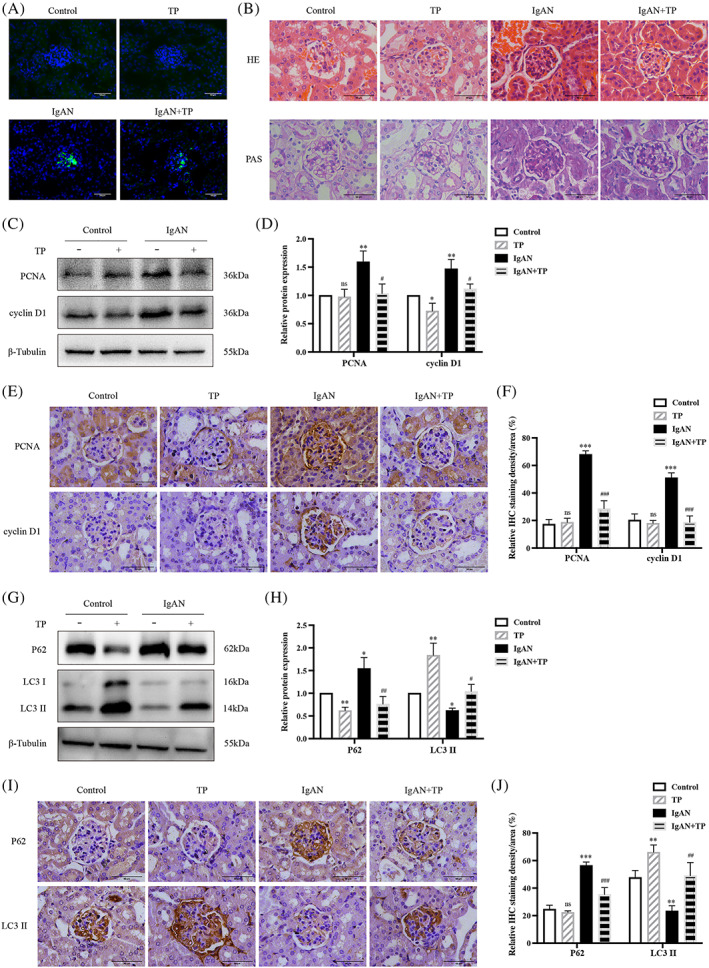
Background: Mesangial cell proliferation is the most basic pathological feature of immunoglobulin A nephropathy (IgAN); however, the specific underlying mechanism and an appropriate therapeutic strategy are yet to be unearthed. This study aimed to investigate the therapeutic effect of triptolide (TP) on IgAN and the mechanism by which TP regulates autophagy and proliferation of mesangial cells through the CARD9/p38 MAPK pathway.

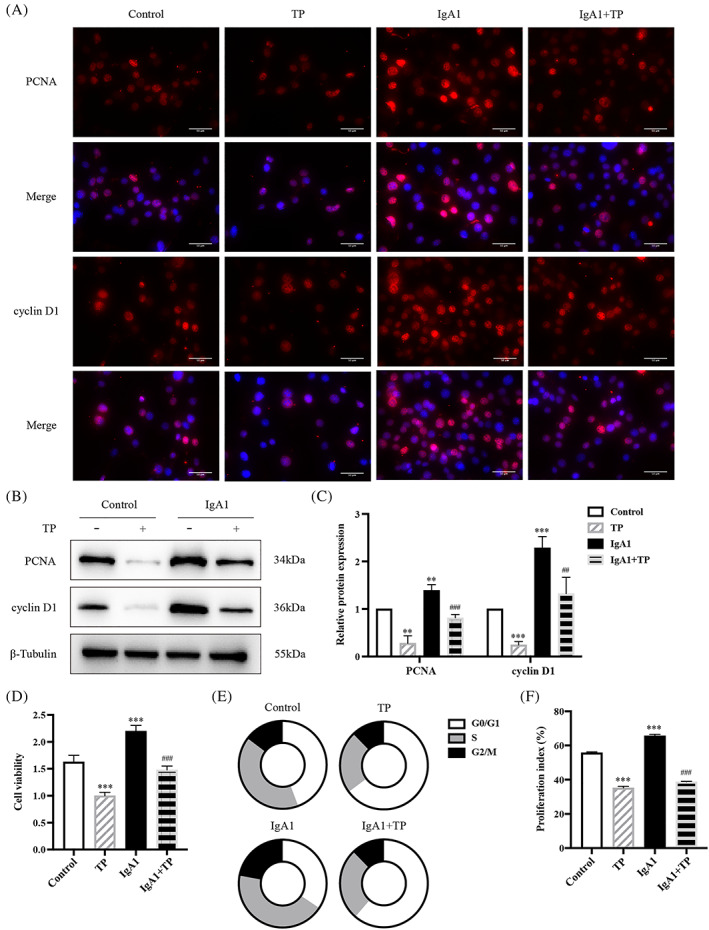
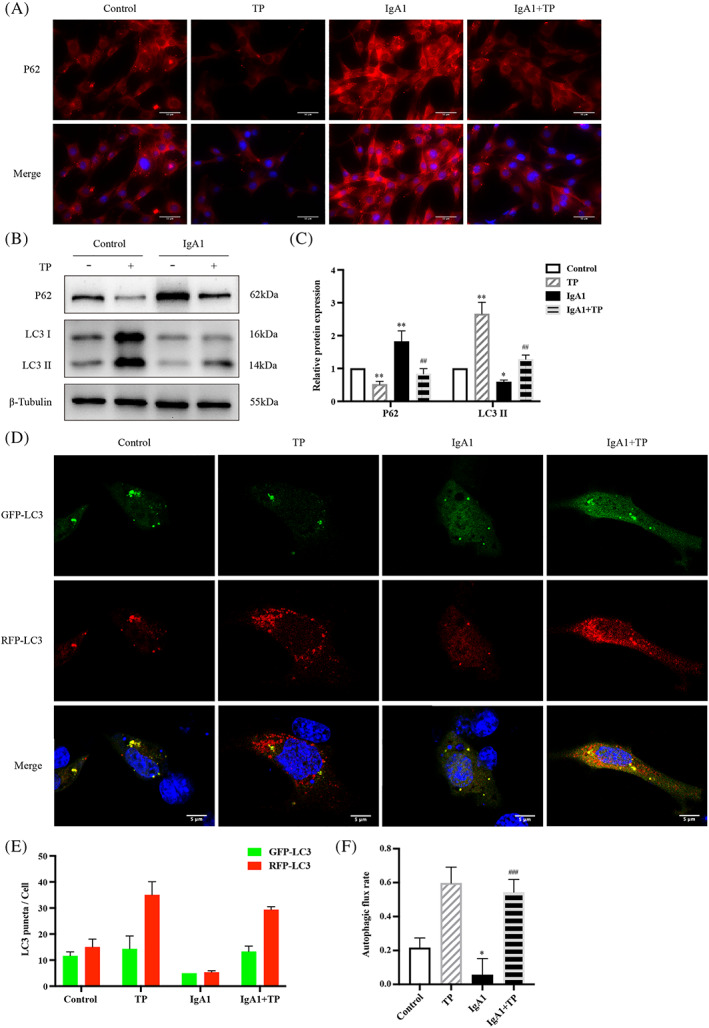
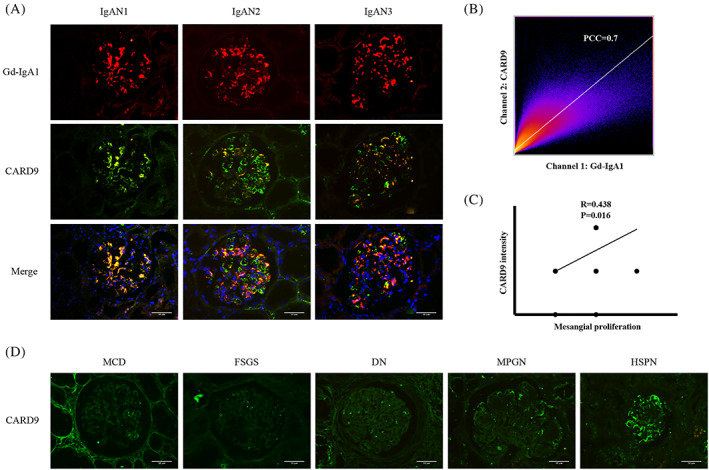
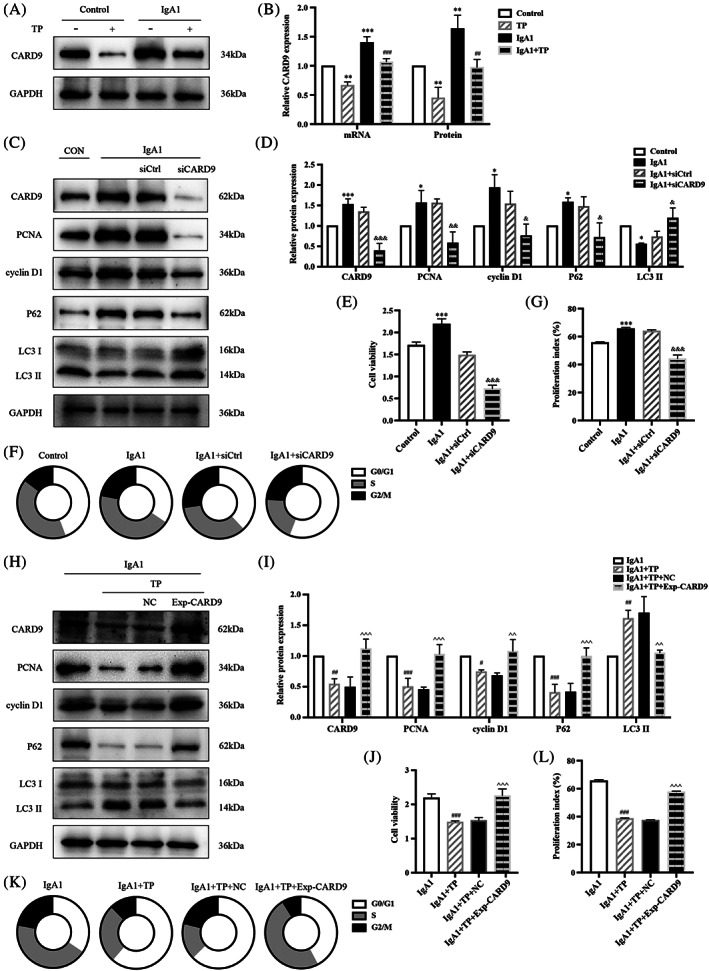
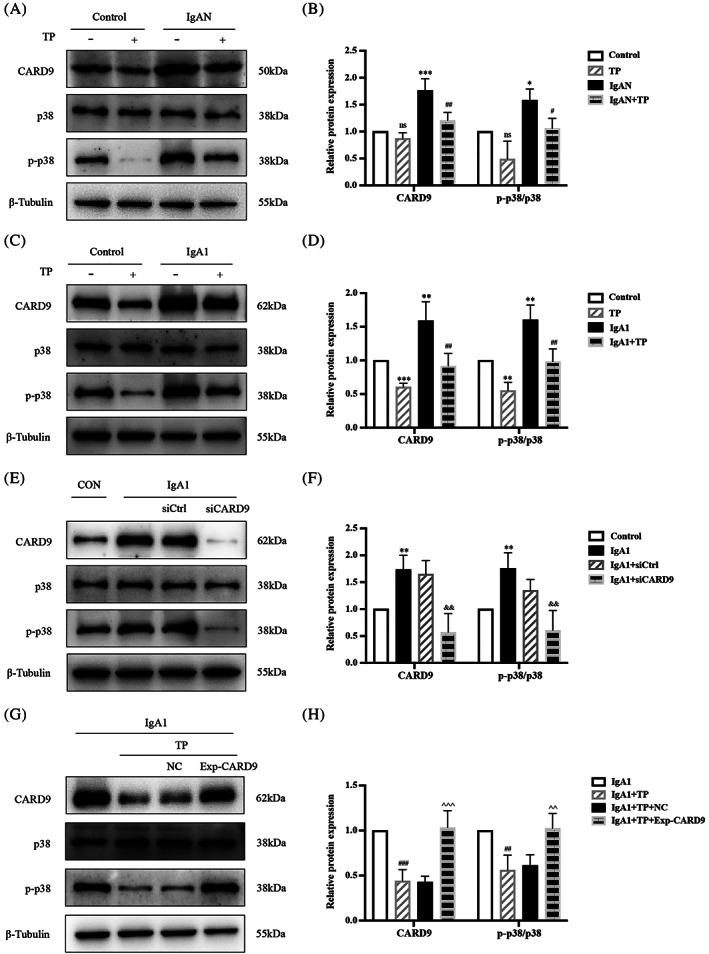
Methods: We established a TP-treated IgAN mouse model and produced IgA1-induced human mesangial cells (HMC) and divided them into control, TP, IgAN, and IgAN+TP groups. The levels of mesangial cell proliferation (PCNA, cyclin D1, cell viability, and cell cycle) and autophagy (P62, LC3 II, and autophagy flux rate) were measured, with the autophagy inhibitor 3-Methyladenine used to explore the relationship between autophagy and proliferation. We observed CARD9 expression in renal biopsies from patients and analyzed its clinical significance. CARD9 siRNA and overexpression plasmids were constructed to investigate the changes in mesangial cell proliferation and autophagy as well as the expression of CARD9 and p-p38 MAPK/p38 MAPK following TP treatment.

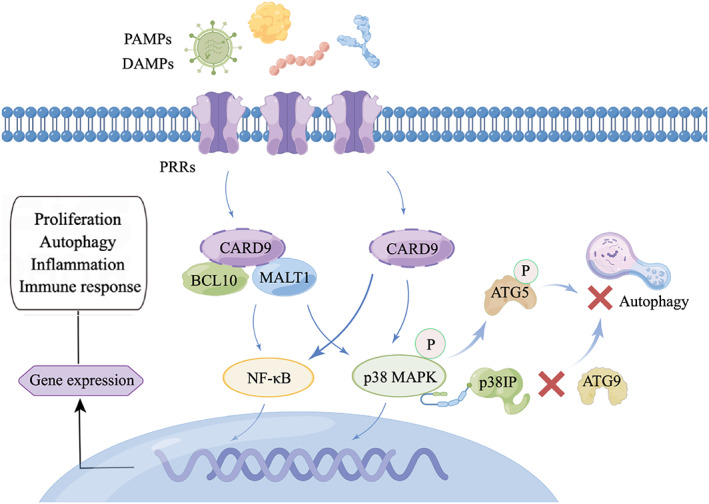
Results: Administering TP was safe and effectively alleviated mesangial cell proliferation in IgAN mice. Moreover, TP inhibited IgA1-induced HMC proliferation by promoting autophagy. The high expression of CARD9 in IgAN patients was positively correlated with the severity of HMC proliferation. CARD9/p38 MAPK was involved in the regulation of HMC autophagy and proliferation, and TP promoted autophagy to inhibit HMC proliferation by downregulating the CARD9/p38 MAPK pathway in IgAN.

Conclusion: TP promotes autophagy to inhibit mesangial cell proliferation in IgAN via the CARD9/p38 MAPK pathway.


Conflict of interest statement

The authors declare no conflict of interest.

Figures

FIGURE 1
FIGURE 1
TP inhibits mesangial cell proliferation and promotes autophagy in IgAN mice. (A) Immunofluorescence of IgA in glomeruli. (B) HE and PAS staining. Representative western blots (C) and quantitative analysis (D) of PCNA and cyclin D1 in renal cortex. IHC staining (E) and quantitative analysis (F) of PCNA and cyclin D1 in glomeruli. Representative western blots (G) and quantitative analysis (H) of P62 and LC3 II in renal cortex. IHC staining (I) and quantitative analysis (J) of P62 and LC3 II in glomeruli. All data presented as mean ± SD, n = 3. ns: p > 0.05 vs. Control, *p < 0.05, **p < 0.01, ***p < 0.001 vs. Control, # p < 0.05, ## p < 0.01, ### p < 0.001 vs. IgAN. Bars = 50 μm; All images ×400.
FIGURE 2
FIGURE 2
TP inhibits IgA1‐induced HMC proliferation. (A) Immunofluorescence of PCNA and cyclin D1 in HMCs. Bars = 50 μm, All images ×400. Representative western blots (B) and quantitative analysis (C) of PCNA and cyclin D1 in HMCs. (D) Cell viability was assessed by CCK8 assay. (E,F) Flow cytometry analysis of cell cycle in HMCs. The proliferation index is calculated as the sum of the percentages of cells in the S phase and G2/M phase. All data presented as mean ± SD, n = 3. *p < 0.05, **p < 0.01, ***p < 0.001 vs. Control, # p < 0.05, ## p < 0.01, ### p < 0.001 vs. IgA1.
FIGURE 3
FIGURE 3
TP promotes autophagy in IgA1‐induced HMC. (A) Immunofluorescence of P62 in HMCs. Bars = 50 μm, All images ×400. Representative western blots (B) and quantitative analysis (C) of P62 and LC3 II in HMCs. (D) Representative images of GFP‐LC3 and RFP‐LC3 puncta in transfected HMCs. Bars = 5 μm, All images ×630. (E) Quantitative analysis of GFP‐LC3 and RFP‐LC3 puncta. (F) Analysis of autophagic flux rate. All data presented as mean ± SD, n = 3. *p < 0.05, **p < 0.01 vs. Control, ## p < 0.01, ### p < 0.001 vs. IgA1.
FIGURE 4
FIGURE 4
TP inhibits HMC proliferation by promoting autophagy. Representative western blots (A) and quantitative analysis (B) of PCNA, cyclin D1, P62, and LC3 II in IgA1‐induced HMCs under TP or 3‐MA conditions. All data presented as mean ± SD, n = 3. # p < 0.05, ## p < 0.01 vs. IgA1; & p < 0.05, && p < 0.01 vs. IgA1 + 3‐MA; ^ p < 0.05, ^^ p < 0.01 vs. IgA1 + TP.
FIGURE 5
FIGURE 5
CARD9 positively correlates with IgAN mesangial proliferation. (A) Double immunofluorescence of Gd‐IgA1 and CARD9 in IgAN patients. (B) Colocalization analysis of Gd‐IgA1 and CARD9 in IgAN patients (PCC = 0.7). (C) Correlation analysis between CARD9 intensity and mesangial proliferation (R = 0.438, p = 0.016). (D) Immunofluorescence of CARD9 in patients with MCD, FSGS, DN, MPGN, and HSPN. Bars = 50 μm. All images ×400.
FIGURE 6
FIGURE 6
TP regulates HMC autophagy and proliferation by CARD9. Representative western blots of CARD9 (A) and quantitative analysis of CARD9 mRNA and protein levels (B). Representative western blots (C) and quantitative analysis (D) of PCNA, cyclin D1, P62, and LC3 II in CARD9‐knockdown HMCs. (E) Cell viability was assessed by CCK8 assay. (F,G) Flow cytometry analysis of cell cycle. The proliferation index is calculated as the sum of the percentages of cells in S phase and G2/M phase. Representative western blots (H) and quantitative analysis (I) of PCNA, cyclin D1, P62, and LC3 II in CARD9‐overexpression HMCs. (J) Cell viability was assessed by CCK8 assay. (K,L) Flow cytometry analysis of cell cycle. All data presented as mean ± SD, n = 3. **p < 0.01, **p < 0.01, ***p < 0.001 vs. Control; # p < 0.05, ## p < 0.01, ### p < 0.001 vs. IgA1; & p < 0.05, && p < 0.01, &&& p < 0.001 vs. IgA1 + siCtrl; ^ p < 0.05, ^^ p < 0.01, ^^^ p < 0.001 vs. IgA1 + TP + NC.
FIGURE 7
FIGURE 7
TP regulates HMC autophagy and proliferation via the CARD9/p38 MAPK pathway. Representative western blots of CARD9, p‐p38 MAPK, and p38 MAPK in (A) mice, (C) HMCs, (E) CARD9‐knockdown HMCs, and (G) CARD9‐overexpression HMCs. (B, D, F, H) Quantitative analysis of CARD9 and p‐p38 MAPK/p38 MAPK. All data presented as mean ± SD, n = 3. ns: p > 0.05 vs. Control, *p < 0.05, **p < 0.01, ***p < 0.001 vs. Control; # p < 0.05, ## p < 0.01, ### p < 0.001 vs. IgAN/IgA1; && p < 0.01 vs. IgA1 + siCtrl; ^^ p < 0.01, ^^^ p < 0.001 vs. IgA1 + TP + NC.
FIGURE 8
FIGURE 8
Physiological functions of CARD9 signaling. DAMPs and PAMPs sensed by PRRs lead to CARD9 activation. Next, CARD9 recruits BCL10 and MALT1 to form the CBM complex for the activation of MAPK and NF‐κB. PRRs can also directly activate CARD9. Finally, the activation of MAPK and NF‐κB contributes to gene expression related to cell proliferation, autophagy, apoptosis, differentiation, and immune response. In this interaction network, the preferential binding of p‐p38 MAPK to p38IP isolated p38IP from ATG9, thereby indirectly impairing ATG9 transport and autophagosome formation. Besides, p‐p38 MAPK‐mediated ATG5 phosphorylation inhibits autophagosome‐lysosome fusion, leading to autophagy suppression.

References

    1. Lai K, Tang SCW, Schena FP, et al. IgA Nephropathy. Nat Rev Dis Primers. 2016;2:16001. - PubMed
    1. Chen T, Li X, Li Y, et al. Prediction and risk stratification of kidney outcomes in IgA nephropathy. Am J Kidney Dis. 2019;74(3):300‐309. - PubMed
    1. O'Shaughnessy M, Hogan SL, Thompson BD, et al. Glomerular disease frequencies by race, sex and region: results from the International Kidney Biopsy Survey. Nephrol Dial Transpl. 2018;33(4):661‐669. - PMC - PubMed
    1. KDIGO . Clinical practice guideline for the Management of Glomerular Diseases. Kidney Int. 2021;2021(100):S1‐S276. - PubMed
    1. Barbour S, Coppo R, Zhang H, et al. Evaluating a new international risk‐prediction tool in IgA nephropathy. JAMA Intern Med. 2019;179(7):942‐952. - PMC - PubMed