. 2022 Jun 1;6(2):301-319.
doi: 10.1162/netn_a_00245. eCollection 2022 Jun.

Minimum spanning tree analysis of brain networks: A systematic review of network size effects, sensitivity for neuropsychiatric pathology, and disorder specificity

Affiliations

Minimum spanning tree analysis of brain networks: A systematic review of network size effects, sensitivity for neuropsychiatric pathology, and disorder specificity

N Blomsma et al. Netw Neurosci. .

Abstract

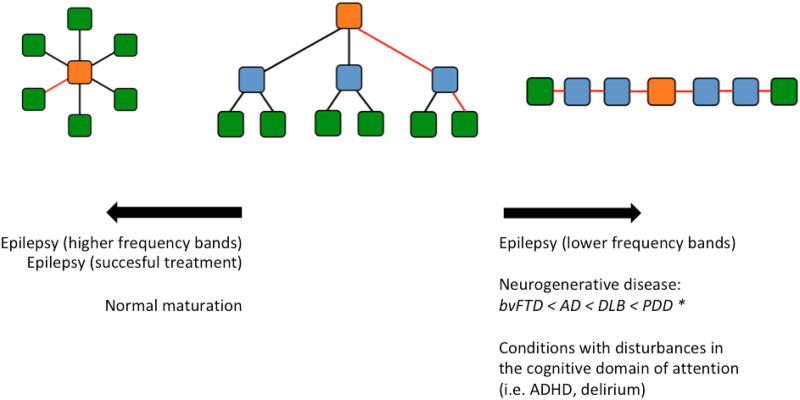
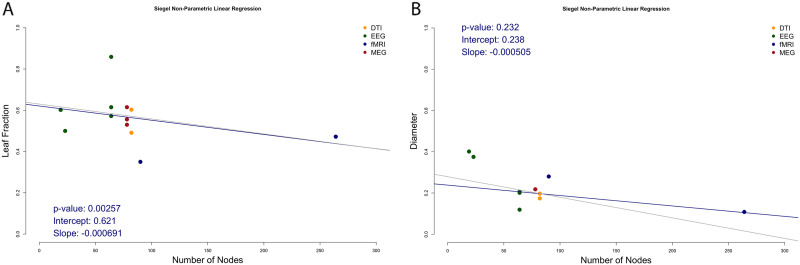
Brain network characteristics' potential to serve as a neurological and psychiatric pathology biomarker has been hampered by the so-called thresholding problem. The minimum spanning tree (MST) is increasingly applied to overcome this problem. It is yet unknown whether this approach leads to more consistent findings across studies and converging outcomes of either disease-specific biomarkers or transdiagnostic effects. We performed a systematic review on MST analysis in neurophysiological and neuroimaging studies (N = 43) to study consistency of MST metrics between different network sizes and assessed disease specificity and transdiagnostic sensitivity of MST metrics for neurological and psychiatric conditions. Analysis of data from control groups (12 studies) showed that MST leaf fraction but not diameter decreased with increasing network size. Studies showed a broad range in metric values, suggesting that specific processing pipelines affect MST topology. Contradicting findings remain in the inconclusive literature of MST brain network studies, but some trends were seen: (1) a more linelike organization characterizes neurodegenerative disorders across pathologies, and is associated with symptom severity and disease progression; (2) neurophysiological studies in epilepsy show frequency band specific MST alterations that normalize after successful treatment; and (3) less efficient MST topology in alpha band is found across disorders associated with attention impairments.

Keywords: Minimum spanning tree; multimodal; network neuroscience; network size; transdiagnostic.


Figures

<b>Figure 1.</b>
Figure 1.
Schematic depiction of three different minimum spanning trees, with a starlike, intermediate and linelike configuration from left to right. The green nodes represent leaf nodes. Central nodes are depicted in orange. Diameter is depicted in red. Individual conditions and the correlated changes in network topology as described in the discussion section are displayed, with an arrow depicting the direction of the change. For neurodegenerative diseases conditions are displayed left to right from having the least shift toward a more linelike topology (bvFTD) to the most (PDD). AD, Alzheimer’s disease; bvFTD, behavioral variant of frontotemporal dementia; DLB, dementia with Lewy bodies; PDD, Parkinson’s disease dementia.
<b>Figure 2.</b>
Figure 2.
Nonparametric linear regression for number of nodes and normalized leaf fraction (A) and diameter (B). The gray line indicates the same regression, but excluding studies with more than 250 nodes; in this analysis for leaf fraction (2.1) the p value is 0.023, with an intercept of 0.63 and a slope of −0.0007. For diameter the p value is 0.426, with an intercept of 0.279 and a slope of −0.001.
<b>Figure 3.</b>
Figure 3.
Forest plots for fixed-effect and random-effects meta-analysis on the standardized difference of the mean estimates for mean diameter. Studies are stratified by imaging modality. MEG/EEG studies are aggregated, but stratified for each frequency band. Low heterogeneity indicates that the included studies agree about the magnitude and direction of effect. The p value indicates whether the calculated heterogeneity deviates significantly. Meta-analyses with more studies tend to have a higher power to detect significant heterogeneity. SMD, standardized mean difference; 95%-CI, 95% confidence interval; TE, estimate of treatment effect, for example, log hazard ratio or risk difference; seTE, standard error of treatment estimate; ADHD, attention-deficit hyperactivity disorder; LHON, Leber’s hereditary optic neuropathy; MCI, mild cognitive impairment; MS, multiple sclerosis; DLB, dementia with Lewy bodies.
<b>Figure 4.</b>
Figure 4.
Forest plots for fixed-effect and random-effects meta-analysis on the standardized difference of the mean estimates for mean leaf fraction. Studies are stratified by imaging modality. MEG/EEG studies are aggregated, but stratified for each frequency band. SMD, standardized mean difference; 95%-CI, 95% confidence interval; TE, estimate of treatment effect, for example, log hazard ratio or risk difference; seTE, standard error of treatment estimate; ADHD, attention-deficit hyperactivity disorder; MCI, mild cognitive impairment; AD, Alzheimer’s disease; DLB, dementia with Lewy bodies; LHON, Leber’s hereditary optic neuropathy; MS, multiple sclerosis; PD, Parkinson’s disease.

Similar articles

Cited by

References

    1. Anjomshoa, A., Dolatshahi, M., Amirkhani, F., Rahmani, F., Mirbagheri, M. M., & Aarabi, M. H. (2016). Structural brain network analysis in schizophrenia using minimum spanning tree. In 38th annual international conference of the IEEE engineering in medicine and biology society (EMBC) (pp. 4075–4078). Orlando, FL: IEEE. 10.1109/EMBC.2016.7591622, - DOI - PubMed
    1. Bassett, D. S., & Bullmore, E. T. (2009). Human brain networks in health and disease. Current Opinion in Neurology, 22, 340–347. 10.1097/wco.0b013e32832d93dd, - DOI - PMC - PubMed
    1. Boersma, M., Smit, D. J. A., Boomsma, D. I., de Geus, E. J. C., delemarre-Van de Waal, H. A., & Stam, C. J. (2013). Growing trees in child brains: Graph theoretical analysis of electroencephalography-derived minimum spanning tree in 5- and 7-year-old children reflects brain maturation. Brain Connectivity, 3(1), 50–60. 10.1089/brain.2012.0106, - DOI - PubMed
    1. Borsboom, D. (2017). A network theory of mental disorders. World Psychiatry, 16(1), 5–13. 10.1002/wps.20375, - DOI - PMC - PubMed
    1. Bullmore, E., & Sporns, O. (2009). Complex brain networks: Graph theoretical analysis of structural and functional systems. Nature Reviews Neuroscience, 10(3), 186–198. 10.1038/nrn2575, - DOI - PubMed

LinkOut - more resources