. 2022 Jun 14;3(3):101469.
doi: 10.1016/j.xpro.2022.101469. eCollection 2022 Sep 16.

Protocol for live cell image segmentation to profile cellular morphodynamics using MARS-Net

Affiliations

Protocol for live cell image segmentation to profile cellular morphodynamics using MARS-Net

Junbong Jang et al. STAR Protoc. .

Abstract

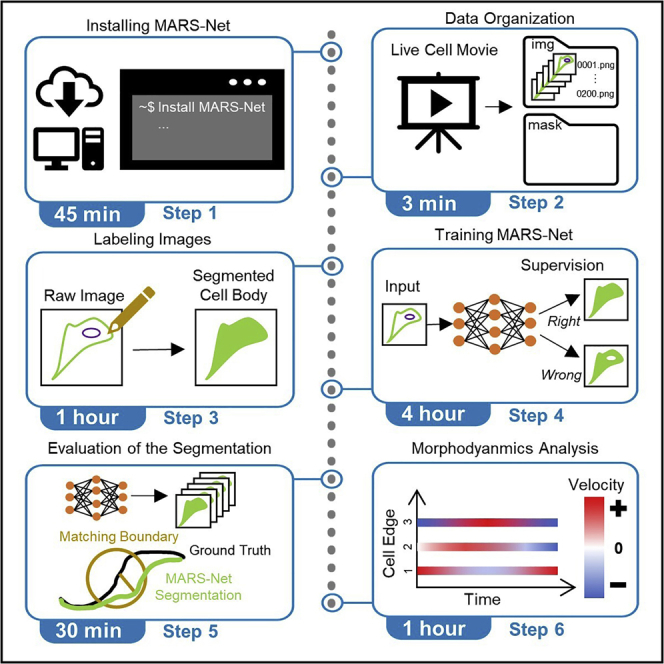
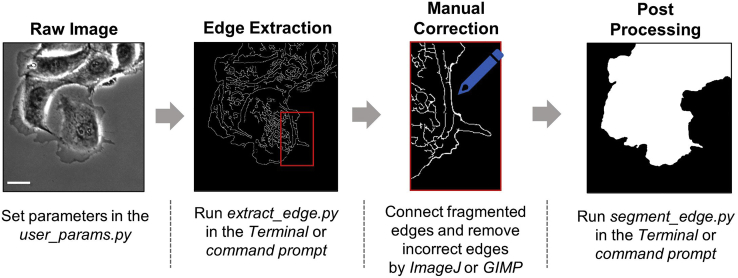
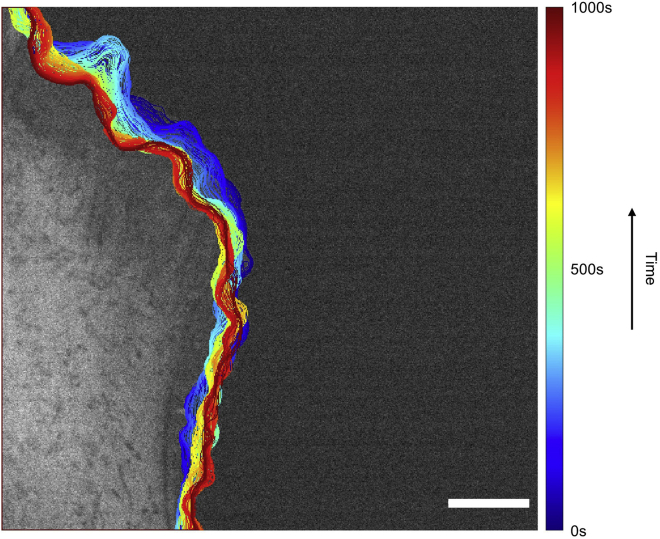
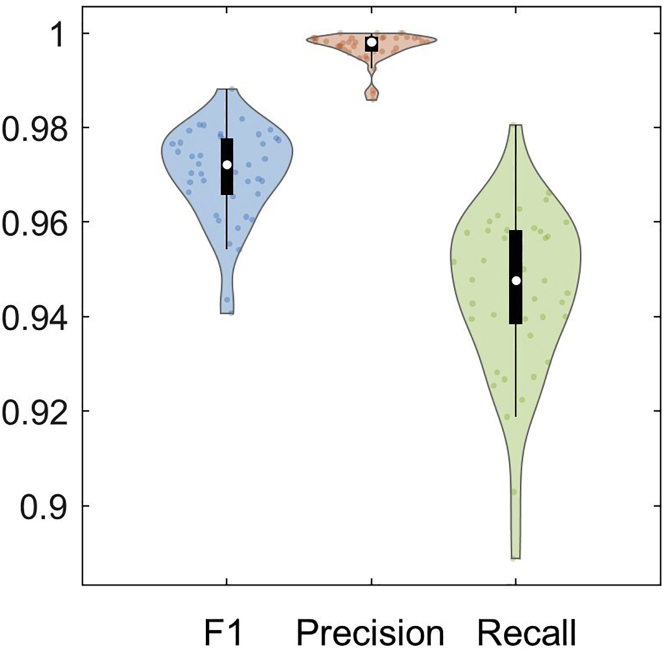
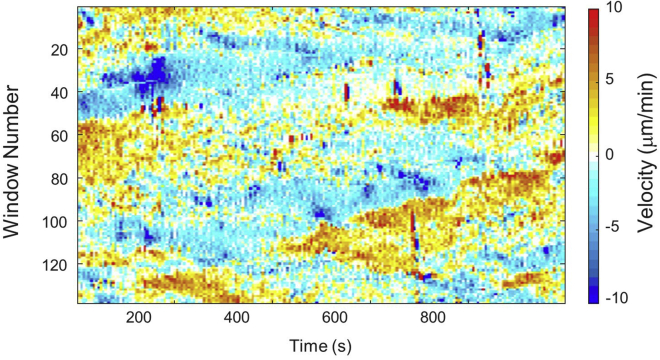
Quantitative studies of cellular morphodynamics rely on accurate cell segmentation in live cell images. However, fluorescence and phase contrast imaging hinder accurate edge localization. To address this challenge, we developed MARS-Net, a deep learning model integrating ImageNet-pretrained VGG19 encoder and U-Net decoder trained on the datasets from multiple types of microscopy images. Here, we provide the protocol for installing MARS-Net, labeling images, training MARS-Net for edge localization, evaluating the trained models' performance, and performing the quantitative profiling of cellular morphodynamics. For complete details on the use and execution of this protocol, please refer to Jang et al. (2021).

Keywords: Bioinformatics; Cell Biology; Computer sciences; Microscopy.


Conflict of interest statement

The authors declare no competing interests.

Figures

None
Graphical abstract
Figure 1
Figure 1
Labeling procedure Simplified diagram of four steps involved in semi-automatically labeling live cell movie. In the first step, prepare the raw image and set the parameters of the label tool. In the second step, extract the edge from the raw image. It is inaccurate since edge extraction is performed by a traditional algorithm. Therefore, in the third step, a user needs to fix extracted edge image by connecting fragmented edges or removing incorrect edges. A manually corrected image is shown as an example. Then in the fourth step, a simple flood fill algorithm can segment the cell body region in the fully connected edge image. Scale Bar: 32.5 μm.
Figure 2
Figure 2
Manual correction of labels The image on the left contains fragmented edges or isolated edges that are extracted due to noise. The red circles are used to indicate some of those regions. The image on the right shows the result after all fragmented or isolated edges that are corrected manually in GIMP. Scale bars: 32.5 μm.
Figure 3
Figure 3
Segmented image example (A) Original phase contrast image from the dataset being analyzed. (B) Segmented phase contrast image from the dataset being analyzed. Scale Bar: 32.5 μm.
Figure 4
Figure 4
Edge progression image example Edge progression overlaid on the original phase contrast image. Note that the dark blue color indicates initial progression at t=0 s while the dark red indicates the end of the progression at t=1000 s. Scale Bar: 32.5 μm.
Figure 5
Figure 5
Evaluation results viewed in MATLAB The main window on the left shows the list of values of one variable opened by the user’s double click. There are only 12 values shown in the window, but the user can scroll right to view more values. The workspace on the right shows four variables stored in the .mat file and the size of each variable. The row index of image_list corresponds to the column index of model_F_score, model_precision, and model_recall. There are 41 evaluated images in this example.
Figure 6
Figure 6
Violin plot of evaluation results The distribution of F1 score, precision, and recall are shown in the violin plot. There is a boxplot in black within the violin plot with a median indicated by the white circle. Individual evaluated results from 41 frames are plotted as small dots within the violin plot. This model has high precision and low recall, but the performance is good overall, with a median F1-score higher than 0.97.
Figure 7
Figure 7
Protrusion velocity map example The heatmap is colored to represent the cell edge velocity ranging from -10 μm/min to +10 μm/min. The red-colored region indicates a portion of the protruding cell edge, and the blue colored region indicates a portion of the retracting cell edge. In cellular dynamics of morphology, protrusion means the cell edge is moving away from the cell body and retraction means the cell edge is moving toward the cell body. The horizontal axis represents the duration of the movie for which the cell was observed, and the vertical axis represents window id or fragments of cell edge. Given a cell edge with two endpoints, the window id 1 represents one endpoint, and the window id 140 represents the other endpoint.

References

    1. Arbelaez P., Maire M., Fowlkes C., Malik J. Contour detection and hierarchical image segmentation. IEEE Trans. Pattern Anal. Mach. Intell. 2010;33:898–916. doi: 10.1109/TPAMI.2010.161. - DOI - PubMed
    1. Bertasius G., Shi J., Torresani L. Deepedge: a multi-scale bifurcated deep network for top-down contour detection. Proceedings of the IEEE Conference on Computer Vision and Pattern Recognition. 2015 doi: 10.1109/CVPR.2015.7299067. - DOI
    1. Canny J. A computational approach to edge detection. IEEE Trans. Pattern Anal. Mach. Intell. 1986;8:679–698. doi: 10.1109/tpami.1986.4767851. - DOI - PubMed
    1. Choi H.J., Wang C., Pan X., Jang J., Cao M., Brazzo J.A., 3rd, Bae Y., Lee K. Emerging machine learning approaches to phenotyping cellular motility and morphodynamics. Phys. Biol. 2021;18:041001. doi: 10.1088/1478-3975/abffbe. - DOI - PMC - PubMed
    1. Deng J., Dong W., Socher R., Li L.-J., Kai L., Li F.-F. IEEE; 2009. ImageNet: A Large-Scale Hierarchical Image Database.

Publication types

MeSH terms

LinkOut - more resources