. 2022 Apr 19;13(21):6233-6243.
doi: 10.1039/d1sc05894k. eCollection 2022 Jun 1.

Harnessing natural-product-inspired combinatorial chemistry and computation-guided synthesis to develop N-glycan modulators as anticancer agents

Affiliations

Harnessing natural-product-inspired combinatorial chemistry and computation-guided synthesis to develop N-glycan modulators as anticancer agents

Wei-An Chen et al. Chem Sci. .

Abstract

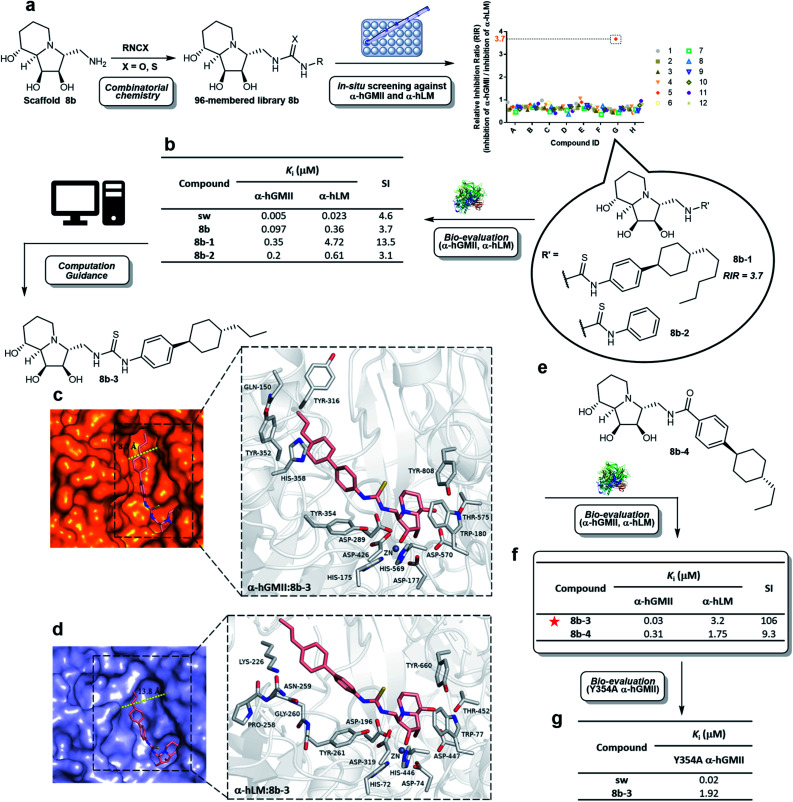
Modulation of N-glycosylation using human Golgi α-mannosidase II (α-hGMII) inhibitors is a potential anticancer approach, but the clinical utility of current α-hGMII inhibitors is limited by their co-inhibition of human lysosomal α-mannosidase (α-hLM), resulting in abnormal storage of oligomannoses. We describe the synthesis and screening of a small library of novel bicyclic iminosugar-based scaffolds, prepared via natural product-inspired combinatorial chemistry (NPICC), which resulted in the identification of a primary α-hGMII inhibitor with 13.5-fold selectivity over α-hLM. Derivatization of this primary inhibitor using computation-guided synthesis (CGS) yielded an advanced α-hGMII inhibitor with nanomolar potency and 106-fold selectivity over α-hLM. In vitro studies demonstrated its N-glycan modulation and inhibitory effect on hepatocellular carcinoma (HCC) cells. In vivo studies confirmed its encouraging anti-HCC activity, without evidence of oligomannose accumulation.


Conflict of interest statement

There are no conflicts to declare.

Figures

Fig. 1
Fig. 1. The natural product-inspired discovery of new selective α-hGMII inhibitors. Inspired by (a) sw and (b) AN9-type molecules from our in-house molecular arsenal to (c) design and synthesize novel scaffolds with core-, configuration- and substituent diversity in a divergent manner for exploration of selective α-hGMII inhibitors assisted by combinatorial chemistry and computation-guided synthesis.
Fig. 2
Fig. 2. Pathways for synthesis of target scaffolds 8a, 8b, 10a and 10b. Reagents and conditions: (a) TMSCN, MeOH, 50 °C, 2 h, 90%. (b) (1) RANEY® Ni, H2, Boc2O, MeOH, 8 h, rt, 74%; (2) HCOOH, Et2O, rt, 2 h, 78%. (c) DMP, CH2Cl2, rt, 2 h, 99%. (d) AllylMgCl, THF, 0 °C to rt, 1 h, 64%. (e) BH3-THF, THF, rt, 1 h, then, NaOH(aq), H2O2, rt, 1 h, 75%. (f) (1) DMP (1.1 eq.), CH2Cl2, rt, 2 h. (2) TFA, CH2Cl2, 0 °C, 1 h. (3) Pd/C, H2, MeOH, rt, o.n. (g) 3-butenylMgBr, THF, 0 °C to rt, 1 h, 78%. (h) (1) ZnBr2, CH2Cl2, rt, 12 h; (2) CbzCl, NaHCO3(aq), THF, rt, 3 h, 69% (7a) and 76% (9a) over 2 steps. (i) (1) OsO4, NaIO4, 2,6-lutidine, dioxane/H2O, rt, 8 h; (2) Pd/C, H2, MeOH, rt, o.n. (3) HCl, MeOH, rt, 8 h, 80% (8a), 90% (8b), 84% (10a) and 78% (10b) over 3 steps. (j) Tf2O, py, CH2Cl2, 0 °C to rt, 3 h, 73% (6b) and 75% (9b). (k) (1) LiOH, EtOH, H2O, 90 °C, 12 h; (2) CbzCl, NaHCO3(aq), THF, rt, 3 h, 69% (7b) and 73% (S17) over 2 steps. HRMS refers to high resolution mass.
Fig. 3
Fig. 3. Synthesis and evaluation of a compound library. (a) Parallel synthesis of library 8b followed by in situ enzyme-based inhibition evaluation against α-hGMII and α-hLM to discover potentially selective α-hGMII inhibitors. (b) Table of α-hLM, α-hGMII inhibition data of sw, 8b, 8b-1 and 8b-2. Computational modeling of the complex between (c) α-hGMII and 8b-3 and (d) α-hLM and 8b-3. (e) Molecular structure of 8b-4. (f) Table of α-hLM, α-hGMII inhibition data of 8b-3 and 8b-4. (g) Table of Y354A α-hGMII inhibition data of sw and 8b-3. Assays were conducted using Man-α-4MU as the substrate (5 mM for wild-type α-hGMII; 2.5 mM for α-hLM and Y354A α-hGMII) and are described in the ESI. The Km of α-hLM, α-hGMII and Y354A α-hGMII toward 4MU-α-Man is 0.56, 1.22 and 0.63 mM, respectively (ESI Fig. S4†). RIR: Relative inhibition ratio = inhibition percentage against α-hGMII/inhibition percentage against α-hLM at certain concentrations; Ki: inhibition constant; SI: selectivity index = [(α-hLM Ki)/(α-hGMII Ki)]; data are the mean of three determinations.
Fig. 4
Fig. 4. Study of selectivity index of 8b-3 for α-hLM vs. α-hGMII inhibition with oligosaccharides as a natural substrate. The α-hGMII and the glycan substrate (GlcNAcMan5GlcNAc2-2AB, also called GlcNAcMan5-2AB) were treated with (a) sw and (b) 8b-3 in a dose-dependent manner (0, 0.3, 0.1, 0.03 μM) for 24 h at 37 °C using Gal-β-1,4-GlcNAc-β-1,3-Gal-β-1,4-Glc-2AB (LNnT-2AB) as the internal standard based on the peak area ratio to determine the inhibition activity. The α-hLM and the glycan substrate (Man5GlcNAc2-2AB, also called Man5-2AB) were treated with (c) sw and (d) 8b-3 in a dose-dependent manner (0, 0.3, 0.1, 0.03 μM) for 24 h at 37 °C using (Gal-GlcNAc)2Man3(GlcNAc)2-2AB (NA2-2AB) as the internal standard based on the peak area ratio to determine the inhibition activity. (e) Glycan based α-hLM and α-hGMII inhibition data (ESI Fig. S11†), and selectivity index (SI) of sw and 8b-3. (f) Lineweaver–Burk plot for Ki determination of inhibitor 8b-3 against α-hGMII. Assays were conducted as described in the ESI. IC50: half-maximal inhibitory concentration; SI: selectivity index = [(α-hLM IC50)/(α-hGMII IC50)]; data are the mean of three determinations.
Fig. 5
Fig. 5. Cellular effect of sw and 8b-3 in Golgi and lysosome. (a) Schematic representation of the effect of inhibition of sw and 8b-3 against α-LM and α-GMII in the cell. (b) Histogram showing LC-MS analysis of total accumulated oligomannose substrate Man2-9GlcNAc(M2-9G) and (c) accumulation of Man2-9GlcNAc in human normal fibroblast (08C0015) in the presence of mannosidase inhibitors sw or 8b-3 from 5 to 20 μM compared to the control culture (accumulated substrate in the cell treated with 20 μM sw is denoted as 100%). (d) Relative N-glycan abundance of HepG2 and Huh7 treated with 8b-3 in a dose-dependent manner compared to the control culture was analyzed by LC-MS. Mean values of glycan abundance (%) are shown as means of two independent experiments. Microscope images of untreated and 8b-3-treated HepG2 cells stained with (e) FITC conjugated concanavalin (ConA-FITC, green) and (f) Alexa Fluor 555 conjugated Galectin 1 (Gal1-555, red), and Huh7 cells stained with (g) ConA-FITC and (h) Gal1-555. *P < 0.05, **P < 0.01, ***P < 0.001, P < 0.05 is considered statistically significant.
Fig. 6
Fig. 6. Iminosugar 8b-3 inhibits HCC in vitro and in vivo compared with sorafenib. (a) Table of cell viability data (MTT) of HepG2, Huh7, and human primary hepatocyte treated with 8b-3 and sorafenib for 72 h. The assay was conducted as described in the ESI. NI: no inhibition. IC50: half-maximal inhibitory concentration; data are the mean of three determinations. The effects of 8b-3 on cell (b) migration and (c) invasion of HepG2 and Huh7 cells were tested by the Transwell assay. (d) Animal experimental schedule. (e) The bodyweights of mice were monitored. (f) The tumor volume (mm3) was recorded. (g) The final weights of the subcutaneous xenograft tumors. Assessment of the hepatorenal toxicity of the drugs by analyzing (h) the aspartate aminotransferase (AST), alanine aminotransferase (ALT), total bilirubin (TBIL), creatinine (CRE), and blood urea nitrogen (BUN) levels. (i) Histogram showing the LC-MS analysis of total accumulated oligomannose substrate (Man2-9GlcNAc) in the serum sample from control and 8b-3 treated mice (accumulated substrate in the serum from mice treated with 8b-3 is denoted as 100%). *P < 0.05, **P < 0.01, ***P < 0.001, P < 0.05 is considered statistically significant, n. s. refers to not significant.

Similar articles

Cited by

References

    1. Ohtsubo K. Marth J. D. Cell. 2006;126:855–867. doi: 10.1016/j.cell.2006.08.019. - DOI - PubMed
    1. Hart G. W. Copeland R. J. Cell. 2010;143:672–676. doi: 10.1016/j.cell.2010.11.008. - DOI - PMC - PubMed
    1. Pinho S. S. Reis C. A. Nat. Rev. Cancer. 2015;15:540–555. doi: 10.1038/nrc3982. - DOI - PubMed
    1. Reily C. Stewart T. J. Renfrow M. B. Novak J. Nat. Rev. Nephrol. 2019;15:346–366. doi: 10.1038/s41581-019-0129-4. - DOI - PMC - PubMed
    1. Fuster M. M. Esko J. D. Nat. Rev. Cancer. 2005;5:526–542. doi: 10.1038/nrc1649. - DOI - PubMed