

This is a preprint.
SARS-CoV-2 infection of human brain microvascular endothelial cells leads to inflammatory activation through NF-κB non-canonical pathway and mitochondrial remodeling
- PMID: 35734080
- PMCID: PMC9216721
- DOI: 10.1101/2022.06.16.496324
SARS-CoV-2 infection of human brain microvascular endothelial cells leads to inflammatory activation through NF-κB non-canonical pathway and mitochondrial remodeling
Update in
-
Human Brain Microvascular Endothelial Cells Exposure to SARS-CoV-2 Leads to Inflammatory Activation through NF-κB Non-Canonical Pathway and Mitochondrial Remodeling.Viruses. 2023 Mar 14;15(3):745. doi: 10.3390/v15030745. Viruses. 2023. PMID: 36992454 Free PMC article.
Abstract
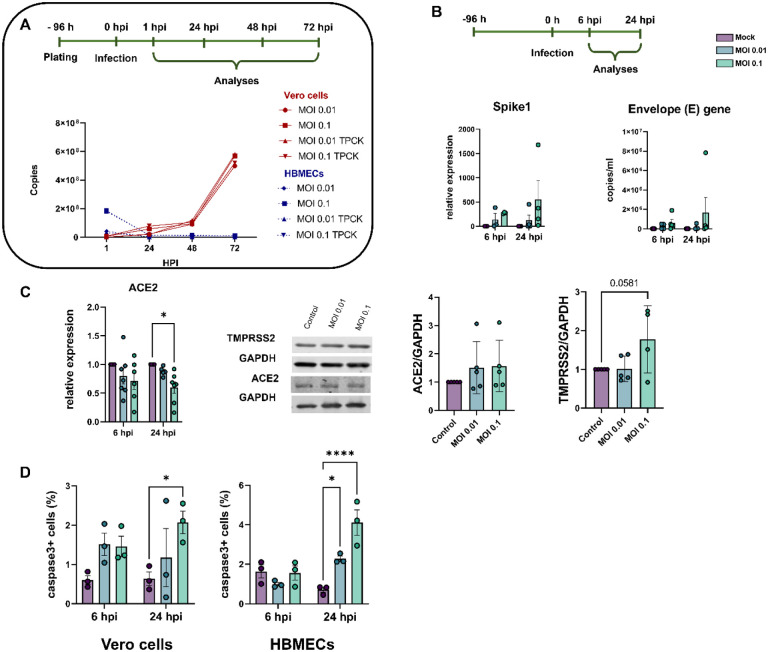
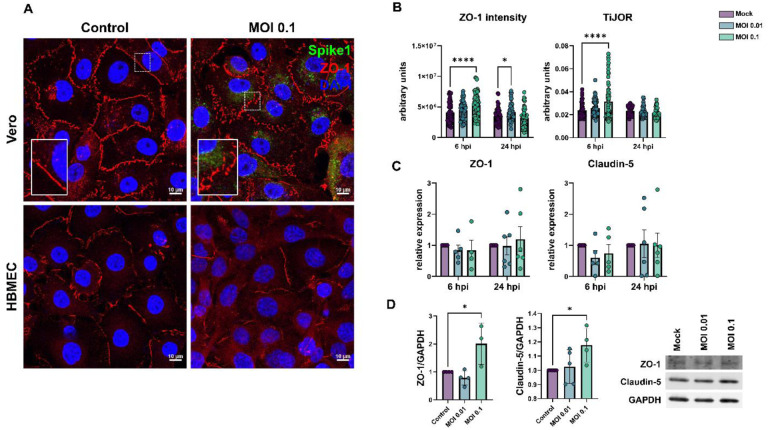
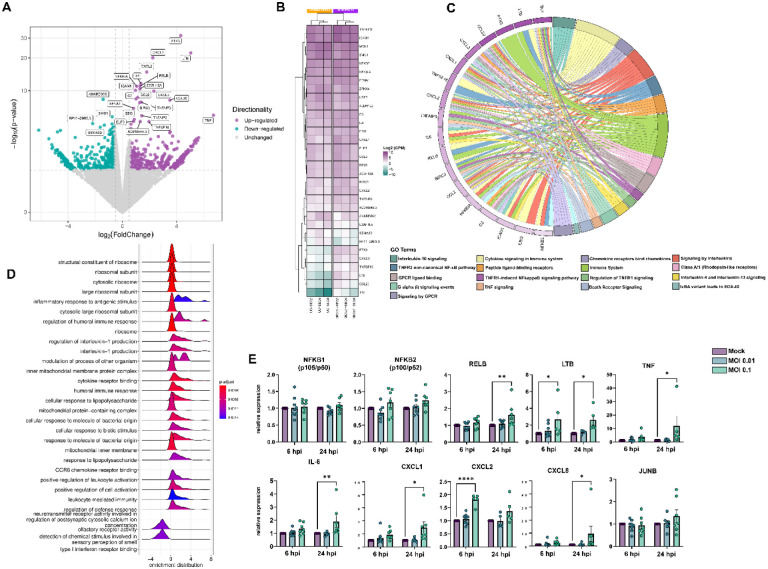
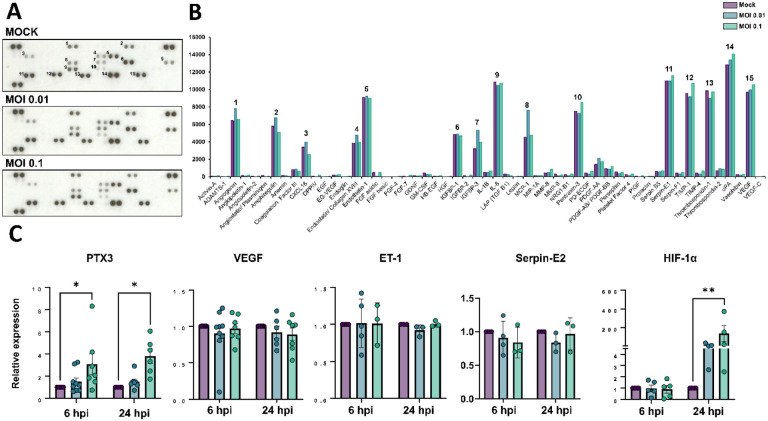
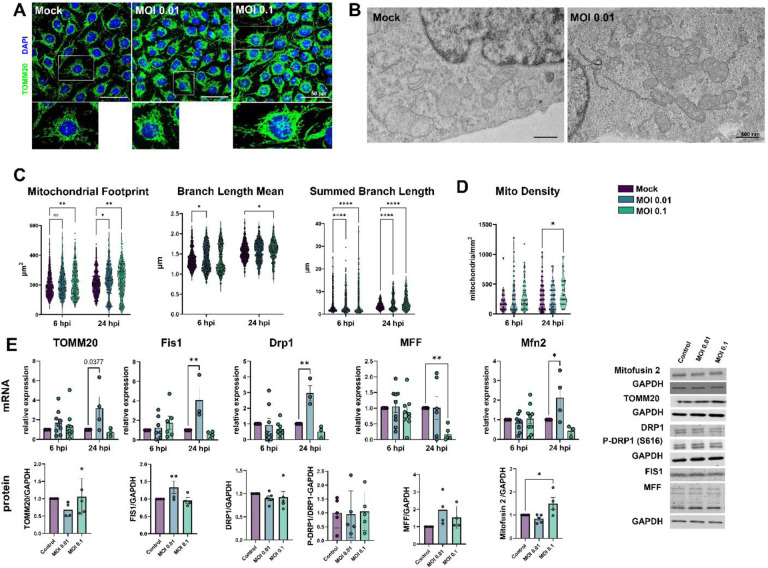
Neurological effects of COVID-19 and long-COVID-19 as well as neuroinvasion by SARS-CoV-2 still pose several questions and are of both clinical and scientific relevance. We described the cellular and molecular effects of the human brain microvascular endothelial cells (HBMECs) in vitro infection by SARS-CoV-2 to understand the underlying mechanisms of viral transmigration through the Blood-Brain Barrier. Despite the low to non-productive viral replication, SARS-CoV-2-infected cultures displayed increased apoptotic cell death and tight junction protein expression and immunolocalization. Transcriptomic profiling of infected cultures revealed endothelial activation via NF-κB non-canonical pathway, including RELB overexpression, and mitochondrial dysfunction. Additionally, SARS-CoV-2 led to altered secretion of key angiogenic factors and to significant changes in mitochondrial dynamics, with increased mitofusin-2 expression and increased mitochondrial networks. Endothelial activation and remodeling can further contribute to neuroinflammatory processes and lead to further BBB permeability in COVID-19.
Figures
Similar articles
-
SARS-CoV-2 infection of human brain microvascular endothelial cells leads to inflammatory activation through NF-κB non-canonical pathway and mitochondrial remodeling.Res Sq [Preprint]. 2022 Jun 16:rs.3.rs-1762855. doi: 10.21203/rs.3.rs-1762855/v1. Res Sq. 2022. Update in: Viruses. 2023 Mar 14;15(3):745. doi: 10.3390/v15030745. PMID: 35734086 Free PMC article. Updated. Preprint.
-
Human Brain Microvascular Endothelial Cells Exposure to SARS-CoV-2 Leads to Inflammatory Activation through NF-κB Non-Canonical Pathway and Mitochondrial Remodeling.Viruses. 2023 Mar 14;15(3):745. doi: 10.3390/v15030745. Viruses. 2023. PMID: 36992454 Free PMC article.
-
SARS-CoV-2 causes dysfunction in human iPSC-derived brain microvascular endothelial cells potentially by modulating the Wnt signaling pathway.Fluids Barriers CNS. 2024 Apr 8;21(1):32. doi: 10.1186/s12987-024-00533-9. Fluids Barriers CNS. 2024. PMID: 38584257 Free PMC article.
-
COVID-19 and Long COVID: Disruption of the Neurovascular Unit, Blood-Brain Barrier, and Tight Junctions.Neuroscientist. 2024 Aug;30(4):421-439. doi: 10.1177/10738584231194927. Epub 2023 Sep 11. Neuroscientist. 2024. PMID: 37694571 Review.
-
Cerebral microvascular complications associated with SARS-CoV-2 infection: How did it occur and how should it be treated?Biomed Pharmacother. 2022 Oct;154:113534. doi: 10.1016/j.biopha.2022.113534. Epub 2022 Aug 17. Biomed Pharmacother. 2022. PMID: 35994816 Free PMC article. Review.
References
-
- Otsu N. A threshold selection method from gray-level histograms. IEEE Trans Syst Man Cybern. 1979;9(1):62–66.
-
- Lee TC, Kashyap RL, Chu CN. Building Skeleton Models via 3-D Medial Surface Axis Thinning Algorithms. CVGIP Graph Model Image Process. 1994. Doi:10.1006/cgip.1994.1042 - DOI
-
- HISAT2: Kim D, Langmead B and Salzberg SL. (2015) HISAT: a fast spliced aligner with low memory requirements. Nature Methods. http://ccb.jhu.edu/software/hisat2/index.shtml - PMC - PubMed
Publication types
Grants and funding
LinkOut - more resources
Full Text Sources
Miscellaneous