. 2022 Jun 6:13:917497.
doi: 10.3389/fimmu.2022.917497. eCollection 2022.

Effects and Molecular Regulation Mechanisms of Salinity Stress on the Health and Disease Resistance of Grass Carp

Affiliations

Effects and Molecular Regulation Mechanisms of Salinity Stress on the Health and Disease Resistance of Grass Carp

Hong Fang et al. Front Immunol. .

Abstract

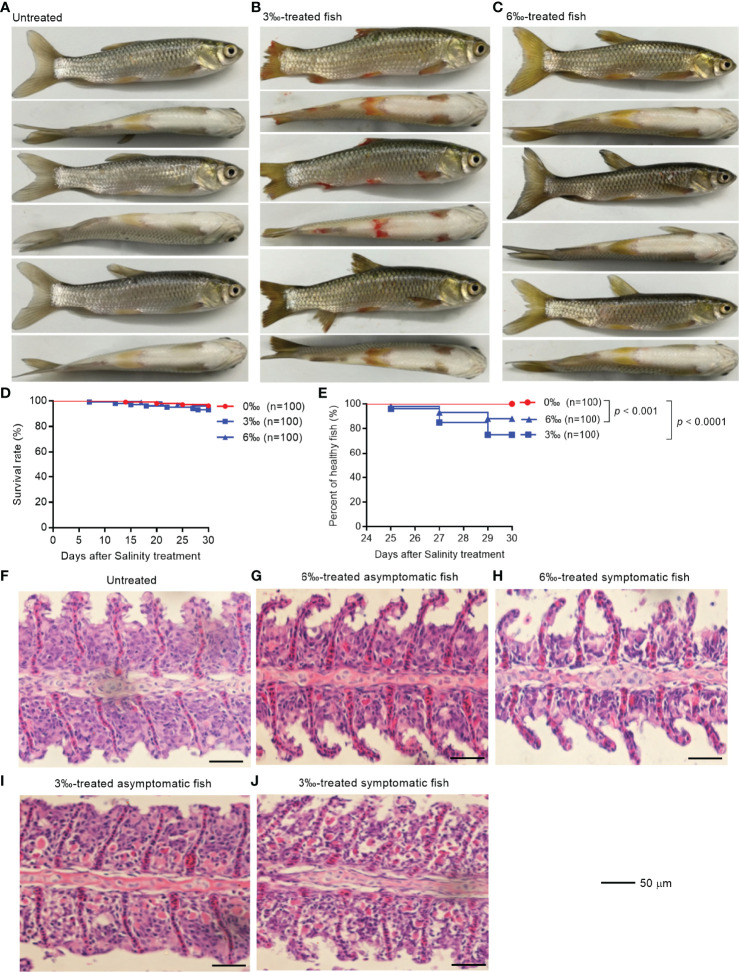
Though some freshwater fish have been successfully cultivated in saline-alkali water, the survival rates of freshwater fish are greatly affected by different saline-alkali conditions. The mechanisms of immune adaptation or immunosuppression of freshwater fish under different saline-alkali stress remain unclear. Here, grass carp were exposed to 3‰ and 6‰ salinity for 30 days. It was observed that salinity treatments had no obvious effects on survival rates, but significantly increased the percent of unhealthy fish. Salinity treatments also increased the susceptibility of grass carp against Flavobacterium columnare infection. The fatality rate (16.67%) of grass carp treated with 6‰ salinity was much lower than that treated with 3‰ salinity (40%). In the absence of infection, higher numbers of immune-related DEGs and signaling pathways were enriched in 6‰ salinity-treated asymptomatic fish than in 3‰ salinity-treated asymptomatic fish. Furthermore different from salinity-treated symptomatic fish, more DEGs involved in the upstream sensors of NOD-like receptor signaling pathway, such as NLRs, were induced in the gills of 6‰ salinity-treated asymptomatic fish. However in the case of F. columnare infection, more immune-related signaling pathways were impaired by salinity treatments. Among them, only NOD-like receptor signaling pathway was significantly enriched at early (1 and/or 2 dpi) and late (7 dpi) time points of infection both for 3‰ salinity-treated and 6‰ salinity-treated fish. Besides the innate immune responses, the adaptive immune responses such as the production of Ig levels were impaired by salinity treatments in the grass carp infected with F. columnare. The present study also characterized two novel NLRs regulated by salinity stress could inhibit bacterial proliferation and improve the survival rate of infected cells. Collectively, the present study provides the insights into the possible mechanisms why the percent of unhealthy fish in the absence of infection and mortality of grass carp in the case of F. columnare infection were much lower in the 6‰ salinity-treated grass carp than in 3‰ salinity-treated grass carp, and also offers a number of potential markers for sensing both environmental salinity stress and pathogen.

Keywords: F. columnare infection; NLRs; NOD-like receptor signaling pathway; grass carp; salinity treatments.


Conflict of interest statement

The authors declare that the research was conducted in the absence of any commercial or financial relationships that could be construed as a potential conflict of interest.

Figures

Figure 1
Figure 1
Salinity treatments impair the health of grass carp. (A) The untreated grass carp. (B) The pathological symptoms of 3‰ salinity-treated grass carp. (C) The pathological symptoms of 6‰ salinity-treated grass carp. (D) Effects of salinity treatments on the survival rate of grass carp. (E) Effects of salinity treatments on the percent of healthy grass carp. (F) Histopathological staining of gill tissue from the untreated grass carp. (G) Histopathological staining of gill tissue from the 6‰ salinity-treated asymptomatic fish. (H) Histopathological staining of gill tissue from the 6‰ salinity-treated symptomatic fish. (I) Histopathological staining of gill tissue from the 3‰ salinity-treated asymptomatic fish. (J) Histopathological staining of gill tissue from the 3‰ salinity-treated symptomatic fish.
Figure 2
Figure 2
Differentially expressed genes and significantly enriched KEGG pathways in grass carp treated with 3‰ or 6‰ salinity. (A) Venn diagrams showing overlaps of total DEGs in gill samples from salinity-treated asymptomatic and symptomatic fish. (B) Venn diagrams showing overlaps of up-regulated DEGs in gill samples from salinity-treated asymptomatic and symptomatic fish. (C) Venn diagrams showing overlaps of down-regulated DEGs in gill samples from salinity-treated asymptomatic and symptomatic fish. (D) The significantly enriched KEGG pathways in the 3‰-treated asymptomatic fish. (E) The significantly enriched KEGG pathways in the 3‰-treated symptomatic fish. (F) The significantly enriched KEGG pathways in the 6‰-treated asymptomatic fish. (G) The significantly enriched KEGG pathways in the 6‰-treated symptomatic fish. The common immune-related signaling pathways for 3‰ and 6‰-treated asymptomatic fish are underlined in black, and in red for 3‰ and 6‰-treated symptomatic fish.
Figure 3
Figure 3
Salinity treatments increase susceptibility to F. columnare infection. (A) The effect of salinity treatments on the bacteria proliferation. (B) The effect of salinity treatments on the larvae survival in response to F. columnarae infection. (C) The significantly enriched KEGG pathways for up-regulated DEGs in gills collected at 1, 2 and 7 dpi from the 3‰-treated grass carp infected with F. columnarae. (D) The significantly enriched KEGG pathways for up-regulated DEGs in gills collected at 1, 2 and 7 dpi from the 6‰-treated grass carp infected with F. columnarae. (E) The significantly enriched KEGG pathways for down-regulated DEGs in gills collected at 1, 2 and 7 dpi from the 3‰-treated grass carp infected with F. columnarae. (F) The significantly enriched KEGG pathways for down-regulated DEGs in gills collected at 1, 2 and 7 dpi from the 6‰-treated grass carp infected with F. columnarae.
Figure 4
Figure 4
The DEGs involved in NOD-like receptor signaling pathway and regulated by salinity stress in the absence of infection. (A) The gene cluster for DEGs involved in the NOD-like receptor signaling pathway in gills from con vs 3‰-treated symptomatic fish, con vs 6‰-treated asymptomatic fish and con vs 6‰-treated symptomatic fish. A color key denotes the gradient scale of gene expression from low (blue) to high (red) degrees. Those NLR genes are highlighted in red. (B) Domain diagrams for 5 differentially expressed NLRs with the complete open reading frame.
Figure 5
Figure 5
The DEGs involved in NOD-like receptor signaling pathway and regulated by salinity stress in the case of F. columnare infection. (A) The gene cluster for DEGs involved in the NOD-like receptor signaling pathway in gills collected at 1 dpi. (B) The gene cluster for DEGs involved in the NOD-like receptor signaling pathway in gills collected at 2 dpi. (C) The gene cluster for DEGs involved in the NOD-like receptor signaling pathway in gills collected at 7 dpi. Those NLR genes are highlighted in red. A color key denotes the gradient scale of gene expression from low (blue) to high (red) degrees.
Figure 6
Figure 6
The immune-related DEGs regulated by salinity treatments at all time points of infection. (A) The expression trend for DEGs in gills collected at 1, 2 and 7 dpi. The control group at each time point is highlighted in red. (B) The immune-related DEGs with the similar expression trend. Those NLR genes are highlighted in red. A color key denotes the gradient scale of gene expression from low (blue) to high (red) degrees.
Figure 7
Figure 7
Salinity treatments impair the innate and adaptive immune responses in the case of bacterial infection. (A) The expression trend for DEGs in gills collected at 1, 2 and 7 dpi. (B) The immune-related DEGs related to immunoglobulin light chain or heavy chain with the similar expression trend. (C) The immune-related DEGs related to cytokines or cytokine receptors with the similar expression trend. (D) The immune-related DEGs related to interferon responses with the similar expression trend. For (B–D), a color key denotes the gradient scale of gene expression from low (blue) to high (red) degrees. For (A–D), the control group at each time point is highlighted in red.
Figure 8
Figure 8
Validation of transcriptome data by qRT-PCR and Western Blotting. (A) Validation of transcriptome data by qRT-PCR for differentially expressed NLRs in gills collected at 2 dpi. Data represented means ± SEM (n=3), and were tested for statistical significance. **p < 0.01; ns, not significant. The asterisk above the bracket indicates statistical significance between the two groups connected by the bracket. (B) Validation of transcriptome data by Western Blotting for immunoglobulins in gills collected at 2 dpi. (C) Gray quantification for Ig protein bands. Western blotting results were quantified using Quantity One software. *p < 0.05; **p < 0.01.
Figure 9
Figure 9
The immune-related DEGs with the lower expressions in 3 ‰ salinity-treated fish than in 6‰ salinity-treated fish. (A) The expression trend for DEGs in gills collected from 3‰ and 6‰ salinity-treated fish. (B) The immune-related DEGs with the similar expression trend in the 3‰ and 6‰ salinity-treated fish. A color key denotes the gradient scale of gene expression from low (blue) to high (red) degrees.
Figure 10
Figure 10
The effects of NLRP12-like genes impaired by salinity treatments in bacterial infection. (A) Domain diagram for grass carp NLRP12-like 1. (B) Domain diagram for grass carp NLRP12-like 2. (C) The effect of grass carp NLRP12-like 1 on the F. columnare proliferation. (D) The effect of grass carp NLRP12-like 2 on the F. columnare proliferation. (E) The effect of grass carp NLRP12-like 1 on the cell survival. (F) The effect of grass carp NLRP12-like 2 on the cell survival. For (C–F), Data represented means ± SEM (n = 3), and were tested for statistical significance. **p < 0.01; ns, not significant. The asterisk above the bracket indicates statistical significance between the two groups connected by the bracket.

Similar articles

Cited by

References

    1. Wang H, Lai QF, Me ZL. Water Quality for Aquaculture in Saline-Alkaline Land. Aquatic Industry Standard of the People's Republic of China. (2012) pp. 1–6, SC/T9406.
    1. Xu W. Tolerance of 5 Species of Fish and Changes of Immune Related Indicators Under Salinity and Immunological Stress Reaction. Shanghai: Shanghai Ocean University; (2014).
    1. Xu W, Geng LW, Jiang HF, Tong GX. A Review of Development and Utilization of Fish Culture in Saline-Alkaline Water. Chin J Fish (2015) 28:44–7.
    1. Varsamos S, Nebel C, Charmantier G. Ontogeny of Osmoregulation in Postembryonic Fish: A Review. Comp Biochem Physiol A Mol Integr Physiol (2005) 141:401–29. doi: 10.1016/j.cbpb.2005.01.013 - DOI - PubMed
    1. Shirangi SA, Kalbassi MR, Khodabandeh S, Jafarian H, Lorin-Nebel C, Farcy E, et al. . Salinity Effects on Osmoregulation and Gill Morphology in Juvenile Persian Sturgeon (Acipenser Persicus). Fish Physiol Biochem (2016) 42:1741–54. doi: 10.1007/s10695-016-0254-y - DOI - PubMed

Publication types