

UTP14A, DKC1, DDX10, PinX1, and ESF1 Modulate Cardiac Angiogenesis Leading to Obesity-Induced Cardiac Injury
- PMID: 35734237
- PMCID: PMC9208995
- DOI: 10.1155/2022/2923291
UTP14A, DKC1, DDX10, PinX1, and ESF1 Modulate Cardiac Angiogenesis Leading to Obesity-Induced Cardiac Injury
Abstract
Background: This study is aimed at exploring the key genes and the possible mechanism of heart damage caused by obesity.
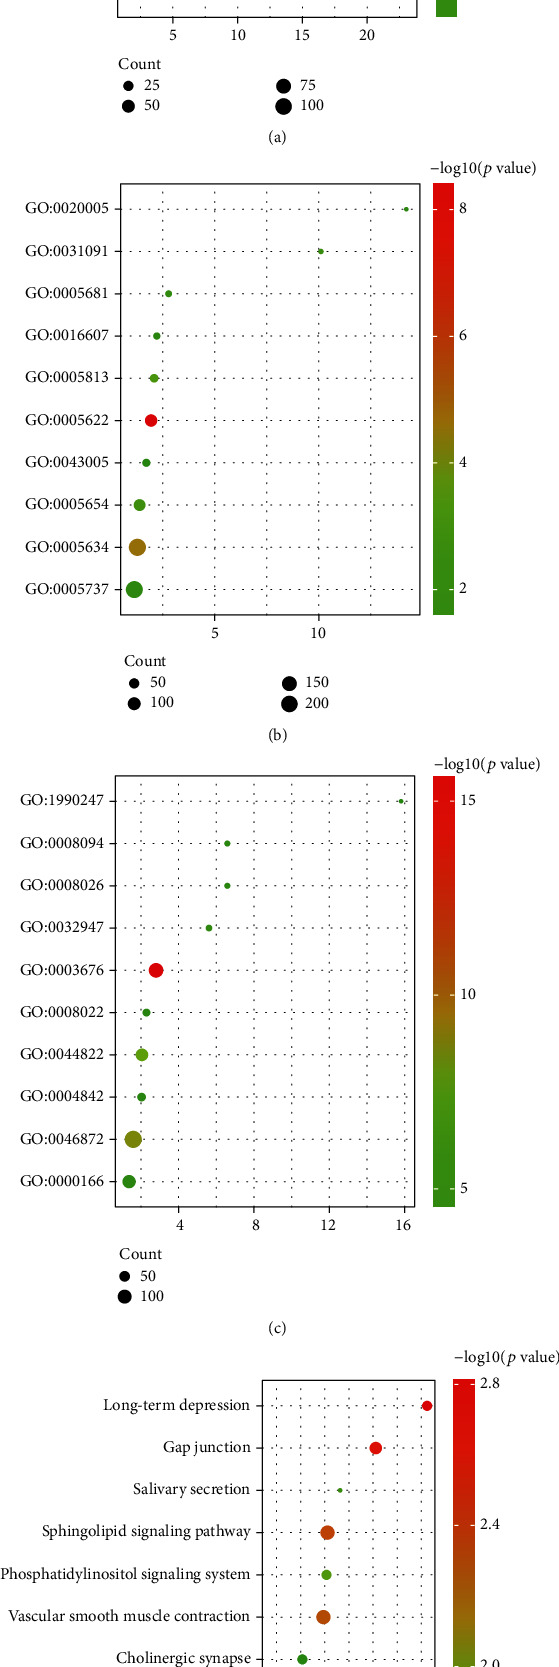
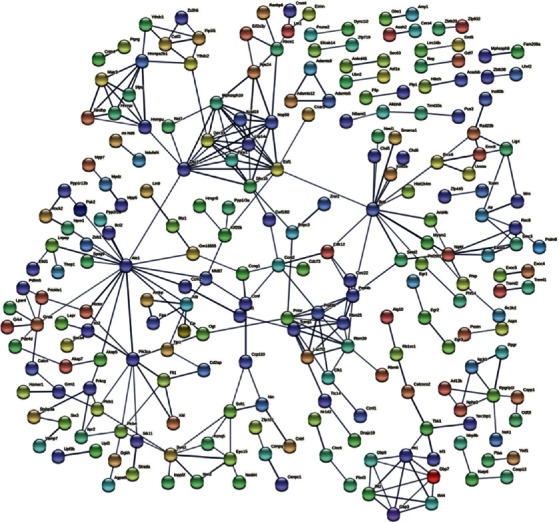
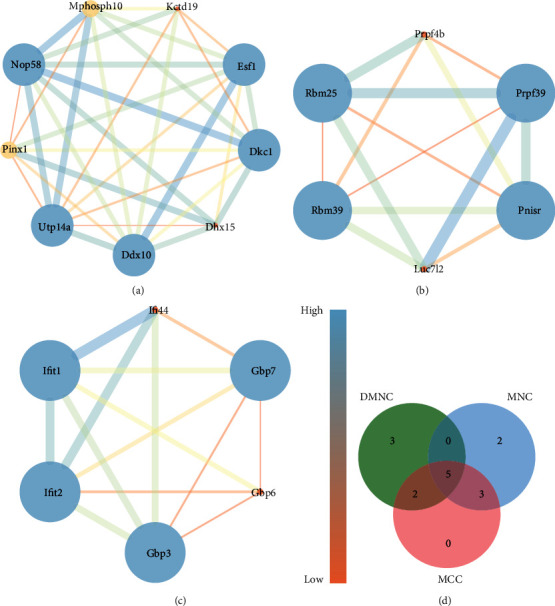
Methods: We analyzed the GSE98226 dataset. Firstly, differentially expressed genes (DEGs) were identified in heart tissues of obese and normal mice. Then, we analyzed DEGs using Gene Ontology (GO) and Kyoto Encyclopedia of Genes and Genomes (KEGG) pathway enrichment analysis. Thirdly, we constructed a protein-protein interaction (PPI) network and key modules and searched hub genes. Finally, we observed the pathological changes associated with obesity through histopathology.
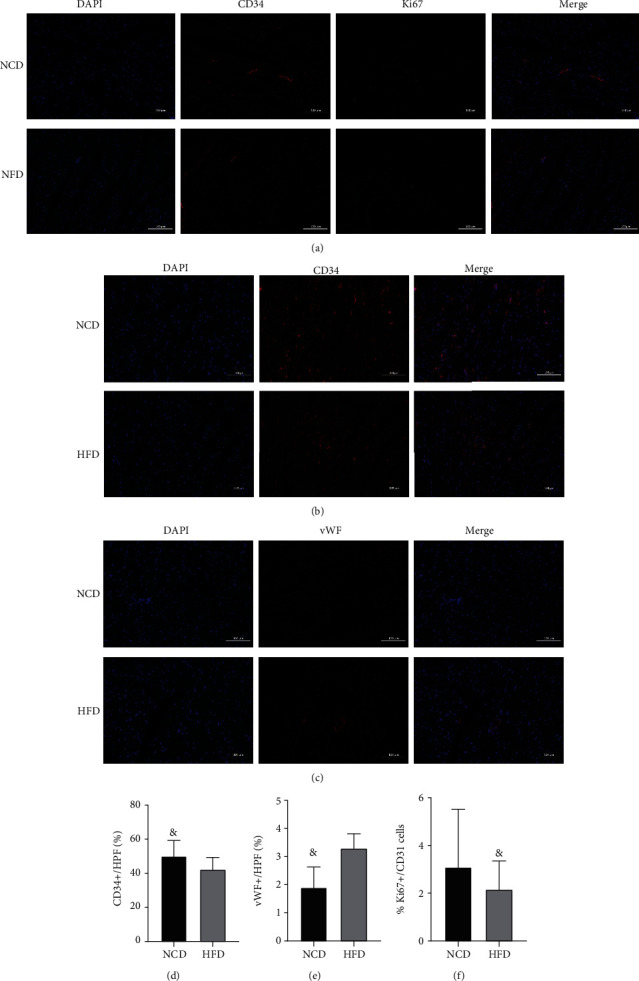
Results: A total of 763 DEGs were discovered, including 629 upregulated and 134 downregulated genes. GO enrichment analysis showed that these DEGs were mainly related to the regulation of transcription, DNA-templated, nucleic acid binding, and metal ion binding. KEGG pathway analysis revealed that the DEGs were enriched in long-term depression, gap junction, and sphingolipid signaling pathways. Finally, we identified UTP14A, DKC1, DDX10, PinX1, and ESF1 as the hub genes. Histopathologic analysis showed that obesity increased the number of collagen fibers and decreased the number of microvessels and proliferation of the endothelium and increased endothelial cell damage which further leads to dysfunction of cardiac microcirculation.
Conclusion: UTP14A, DKC1, DDX10, PinX1, and ESF1 have been identified as hub genes in obesity-induced pathological changes in the heart and may be involved in obesity-induced cardiac injury by affecting cardiac microcirculatory function.
Copyright © 2022 Xiaoyu Pan et al.
Conflict of interest statement
The authors declare no conflict of interest.
Figures


Similar articles
-
Identification of candidate biomarkers and pathways associated with SCLC by bioinformatics analysis.Mol Med Rep. 2018 Aug;18(2):1538-1550. doi: 10.3892/mmr.2018.9095. Epub 2018 May 29. Mol Med Rep. 2018. PMID: 29845250 Free PMC article.
-
Bioinformatics analyses of gene expression profile identify key genes and functional pathways involved in cutaneous lupus erythematosus.Clin Rheumatol. 2022 Feb;41(2):437-452. doi: 10.1007/s10067-021-05913-2. Epub 2021 Sep 23. Clin Rheumatol. 2022. PMID: 34553293
-
Bioinformatics analyses of significant genes, related pathways and candidate prognostic biomarkers in glioblastoma.Mol Med Rep. 2018 Nov;18(5):4185-4196. doi: 10.3892/mmr.2018.9411. Epub 2018 Aug 21. Mol Med Rep. 2018. PMID: 30132538 Free PMC article.
-
Integrated bioinformatics analysis for the screening of hub genes and therapeutic drugs in ovarian cancer.J Ovarian Res. 2020 Jan 27;13(1):10. doi: 10.1186/s13048-020-0613-2. J Ovarian Res. 2020. PMID: 31987036 Free PMC article.
-
The identification of key genes and pathways in hepatocellular carcinoma by bioinformatics analysis of high-throughput data.Med Oncol. 2017 Jun;34(6):101. doi: 10.1007/s12032-017-0963-9. Epub 2017 Apr 21. Med Oncol. 2017. PMID: 28432618 Free PMC article.
Cited by
-
Association of Triglyceride-Glucose Index and Liver Function Parameters Among Healthy Obese Civil Servants: A Center-Based Study.Diabetes Metab Syndr Obes. 2022 Nov 14;15:3519-3531. doi: 10.2147/DMSO.S392544. eCollection 2022. Diabetes Metab Syndr Obes. 2022. PMID: 36407008 Free PMC article.
-
Integrative bioinformatics and RNA sequencing based methodology results in the exploration of breast invasive carcinoma biomarkers.Am J Transl Res. 2023 May 15;15(5):3067-3091. eCollection 2023. Am J Transl Res. 2023. PMID: 37303632 Free PMC article.
-
Effects of Semaglutide on Cardiac Protein Expression and Cardiac Function of Obese Mice.J Inflamm Res. 2022 Nov 24;15:6409-6425. doi: 10.2147/JIR.S391859. eCollection 2022. J Inflamm Res. 2022. PMID: 36452054 Free PMC article.
-
Integrated multiplex network based approach reveled CC and CXC chemokines associated key biomarkers in colon adenocarcinoma patients.Am J Cancer Res. 2023 Nov 15;13(11):5531-5548. eCollection 2023. Am J Cancer Res. 2023. PMID: 38058831 Free PMC article.
-
Investigating novel biomarkers in uterine corpus endometrial carcinoma: in silico analysis and clinical specimens validation via RT-qPCR and immunohistochemistry.Am J Cancer Res. 2023 Sep 15;13(9):4376-4400. eCollection 2023. Am J Cancer Res. 2023. PMID: 37818076 Free PMC article.
References
-
- Keihani S., Alder N. J., Cheng P. J., Stoddard G. J., Pastuszak A. W., Hotaling J. M. Obesity and baseline estradiol levels are independent predictors for initiation of anastrozole in hypogonadal men on clomiphene citrate. The World Journal of Men's Health . 2020;38(4):582–590. doi: 10.5534/wjmh.190160. - DOI - PMC - PubMed
MeSH terms
Substances
LinkOut - more resources
Full Text Sources
Research Materials
Miscellaneous
