. 2022 Jun 6:13:918983.
doi: 10.3389/fgene.2022.918983. eCollection 2022.

N7-Methylguanosine Genes Related Prognostic Biomarker in Hepatocellular Carcinoma

Affiliations

N7-Methylguanosine Genes Related Prognostic Biomarker in Hepatocellular Carcinoma

Parbatraj Regmi et al. Front Genet. .

Abstract

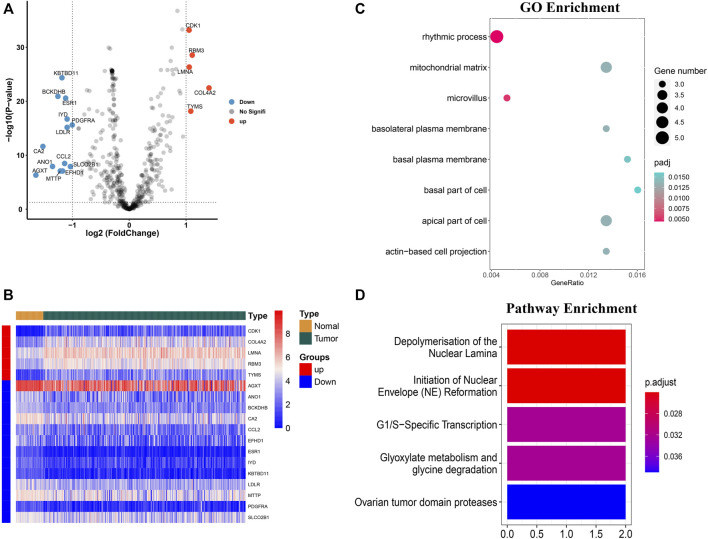
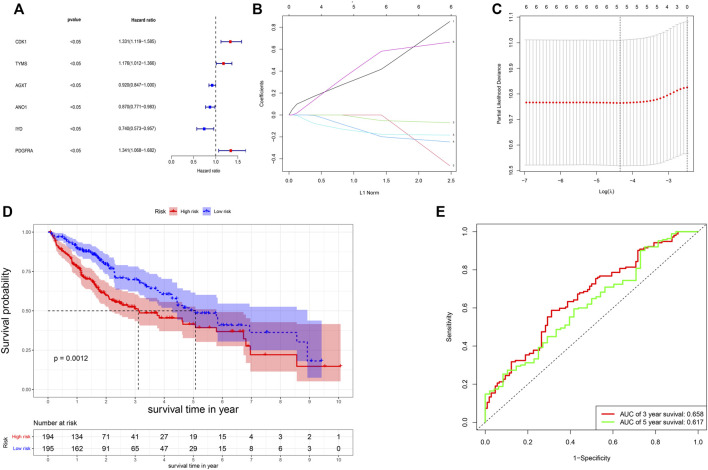
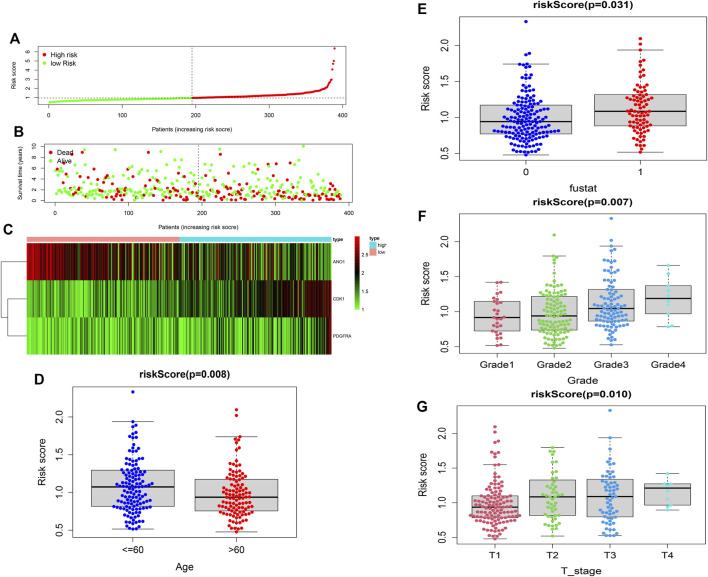
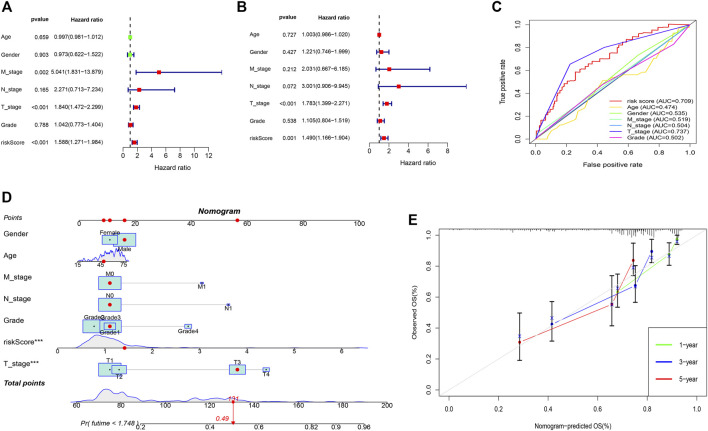
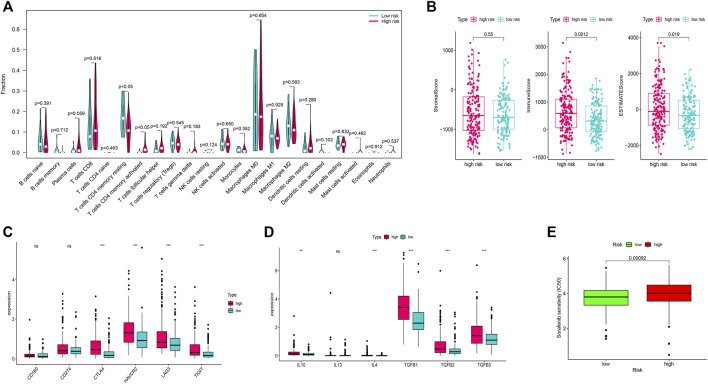
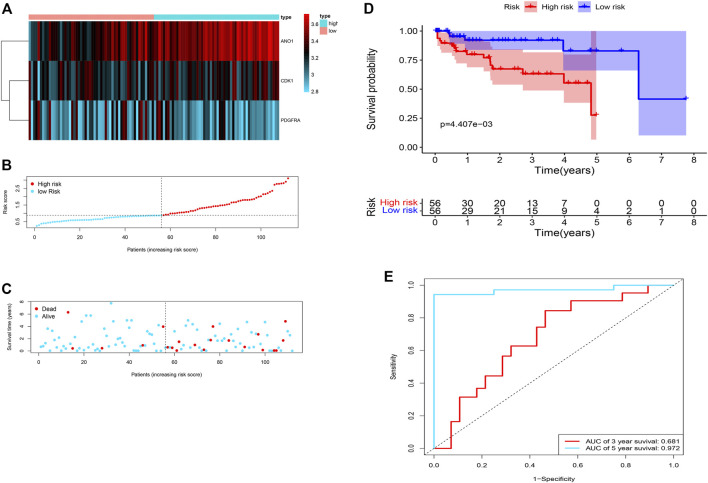
Background: About 90% of liver cancer-related deaths are caused by hepatocellular carcinoma (HCC). N7-methylguanosine (m7G) modification is associated with the biological process and regulation of various diseases. To the best of our knowledge, its role in the pathogenesis and prognosis of HCC has not been thoroughly investigated. Aim: To identify N7-methylguanosine (m7G) related prognostic biomarkers in HCC. Furthermore, we also studied the association of m7G-related prognostic gene signature with immune infiltration in HCC. Methods: The TCGA datasets were used as a training and GEO dataset "GSE76427" for validation of the results. Statistical analyses were performed using the R statistical software version 4.1.2. Results: Functional enrichment analysis identified some pathogenesis related to HCC. We identified 3 m7G-related genes (CDK1, ANO1, and PDGFRA) as prognostic biomarkers for HCC. A risk score was calculated from these 3 prognostic m7G-related genes which showed the high-risk group had a significantly poorer prognosis than the low-risk group in both training and validation datasets. The 3- and 5-years overall survival was predicted better with the risk score than the ideal model in the entire cohort in the predictive nomogram. Furthermore, immune checkpoint genes like CTLA4, HAVCR2, LAG3, and TIGT were expressed significantly higher in the high-risk group and the chemotherapy sensitivity analysis showed that the high-risk groups were responsive to sorafenib treatment. Conclusion: These 3 m7G genes related signature model can be used as prognostic biomarkers in HCC and a guide for immunotherapy and chemotherapy response. Future clinical study on this biomarker model is required to verify its clinical implications.

Keywords: hepatocellular carcinoma; m7G-related genes; nomogram; prognosis; risk-score.


Conflict of interest statement

The authors declare that the research was conducted in the absence of any commercial or financial relationships that could be construed as a potential conflict of interest.

Figures

FIGURE 1
FIGURE 1
Identification of the differentially expressed m7G-related genes and functional enrichment analysis. (A) Volcano plot of the differentially expressed m7g-related genes. (B) Heatmap of the differentially expressed m7G-related genes. (C) GO functional enrichment analysis. (D) Reactome pathway analysis.
FIGURE 2
FIGURE 2
Construction of the risk score. (A) Results of the univariate analysis; (B,C) Lasso regression analysis of the genes from univariate analysis. (D) Survival probability based on the high and low-risk group. (E) ROC curve for the 3- and 5-year overall survival.
FIGURE 3
FIGURE 3
Construction of the risk score. (A,B) Distribution of the survival, risk score, and survival of patients with HCC. (C) Heatmap of the expression of three m7G-related genes in HCC. (D) Relation of the risk score and patient’s age. (E) Relation of the risk score with survival status. (F) Relation of the risk score with tumor grade. (G) Relation of the risk score with T-stage.
FIGURE 4
FIGURE 4
Predictive nomogram. (A) Univariate analysis of the clinicopathologic features and the risk score. (B) Multivariate analysis of the clinicopathologic features and the risk score. (C) ROC curve of the clinicopathologic features and risk score. (D) Nomogram to predict the survival of the HCC patients. (E) Calibration curve for 1-, 3-, and 5-year survival.
FIGURE 5
FIGURE 5
Immune infiltration analysis and chemotherapy sensitivity. (A) Relation of the immune cells with a risk score. (B) Immune, stromal, and ESTIMATE scores in the high and low-risk groups. (C) Relation of the immune checkpoints with risk-score. (D): Relation of the immune-suppressive cytokines with a risk score. (E) Sorafenib sensitivity in high-risk and low-risk groups.
FIGURE 6
FIGURE 6
Validation of the risk score in the GEO dataset. (A) Heatmap of the 3 differentially expressed m7G-related genes in the validation dataset. (B,C) Distribution of the survival, risk score, and survival of patients with HCC. (D) Survival probability based on the high and low-risk group. (E) ROC curve for the 3- and 5-year overall survival.

Similar articles

Cited by

References

    1. Barbieri I., Tzelepis K., Pandolfini L., Shi J., Millán-Zambrano G., Robson S. C., et al. (2017). Promoter-bound METTL3 Maintains Myeloid Leukaemia by m6A-Dependent Translation Control. Nature 552, 126–131. 10.1038/nature24678 - DOI - PMC - PubMed
    1. Bray F., Ferlay J., Soerjomataram I., Siegel R. L., Torre L. A., Jemal A. (2018). Global Cancer Statistics 2018: GLOBOCAN Estimates of Incidence and Mortality Worldwide for 36 Cancers in 185 Countries. CA A Cancer J. Clin. 68, 394–424. 10.3322/caac.21492 - DOI - PubMed
    1. Bruix J., Reig M., Sherman M. (2016). Evidence-Based Diagnosis, Staging, and Treatment of Patients with Hepatocellular Carcinoma. Gastroenterology 150, 835–853. 10.1053/j.gastro.2015.12.041 - DOI - PubMed
    1. Chai X.-k., Qi W., Zou C.-Y., He C.-X., Su M., Zhao D.-Q. (2021). Potential Prognostic Value of a Seven m6A-Related LncRNAs Signature and the Correlative Immune Infiltration in Colon Adenocarcinoma. Front. Genet. 12, 774010. 10.3389/fgene.2021.774010 - DOI - PMC - PubMed
    1. Chen Z., Zhu W., Zhu S., Sun K., Liao J., Liu H., et al. (2021). METTL1 Promotes Hepatocarcinogenesis via M7G tRNA Modification-dependent Translation Control. Clin. Transl. Med. 11, e661. 10.1002/ctm2.661 - DOI - PMC - PubMed