. 2022 Oct 15;43(15):4699-4709.
doi: 10.1002/hbm.25984. Epub 2022 Jun 23.

Abnormal white-matter rich-club organization in obsessive-compulsive disorder

Affiliations

Abnormal white-matter rich-club organization in obsessive-compulsive disorder

Samantha Baldi et al. Hum Brain Mapp. .

Abstract

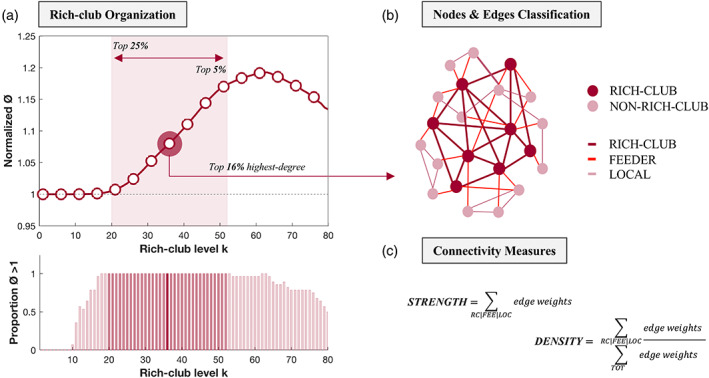
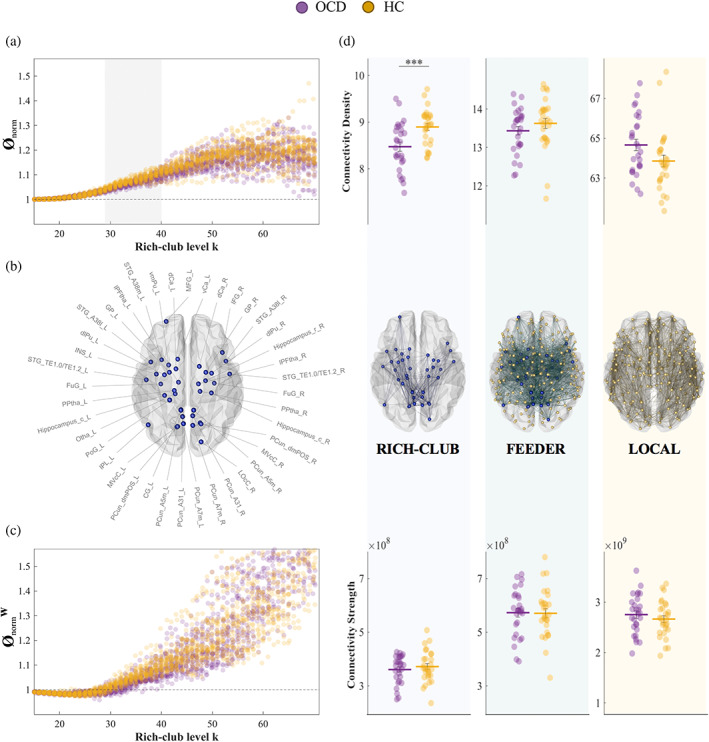
Rich-club organization is key to efficient global neuronal signaling and integration of information. Alterations interfere with higher-order cognitive processes, and are common to several psychiatric and neurological conditions. A few studies examining the structural connectome in obsessive-compulsive disorder (OCD) suggest lower efficiency of information transfer across the brain. However, it remains unclear whether this is due to alterations in rich-club organization. In the current study, the structural connectome of 28 unmedicated OCD patients, 8 of their unaffected siblings and 28 healthy controls was reconstructed by means of diffusion-weighted imaging and probabilistic tractography. Topological and weighted measures of rich-club organization and connectivity were computed, alongside global and nodal measures of network integration and segregation. The relationship between clinical scores and network properties was explored. Compared to healthy controls, OCD patients displayed significantly lower topological and weighted rich-club organization, allocating a smaller fraction of all connection weights to the rich-club core. Global clustering coefficient, local efficiency, and clustering of nonrich club nodes were significantly higher in OCD patients. Significant three-group differences emerged, with siblings displaying highest and lowest values in different measures. No significant correlation with any clinical score was found. Our results suggest weaker structural connectivity between rich-club nodes in OCD patients, possibly resulting in lower network integration in favor of higher network segregation. We highlight the need of looking at network-based alterations in brain organization and function when investigating the neurobiological basis of this disorder, and stimulate further research into potential familial protective factors against the development of OCD.

Keywords: connectivity; diffusion-weighted imaging; obsessive-compulsive disorder; probabilistic tractography; rich-club organization; structural networks.


Conflict of interest statement

Odile A. van den Heuvel received a one‐time consultation fee (2021) from Lundbeck. The other authors declare that they have no conflict of interest.

Figures

FIGURE 1
FIGURE 1
Schematic representation of the rich‐club analysis. First, rich‐club coefficients Ø (unweighted and weighted) are calculated at increasing rich‐club levels k and normalized by the averaged rich‐club curve of a set of comparable random networks. A schematic representation of the normalized groups average rich‐club curve is shown (a top). Normalized Ø > 1 (dashed line in a top) indicates significant rich‐club organization in a network. The bar graph represents the proportion p of participants for which this holds true across rich‐club levels (p = 1 indicates that all participants display significant rich‐club organization) (a bottom). Next, the nodes of the network are classified into rich‐club or nonrich‐club nodes (b). Members of the rich‐club are defined as the most highly connected nodes of the network common to all participants. Main results are reported for the top 16% highest‐degree regions, but a wider range is considered, including from the top 25% to the top 5% highest‐degree regions (red shaded area in a top and bottom). Network edges are classified accordingly into rich‐club (connections between rich‐club nodes), feeder (connections between rich‐club and nonrich‐club nodes) and local (connections between nonrich‐club nodes) (b). Two connectivity measures are finally computed; connectivity strength represents the sum of all edge weights within each connection class, and weighted connectivity density represents the ratio of the connectivity strength of each connection class to the connectivity strength of the whole brain (c). FEE, feeder connections; LOC, local connections; RC, rich‐club connections; TOT, whole‐brain connections
FIGURE 2
FIGURE 2
Individual normalized Ø and Øw are plotted for OCD patients (purple) and healthy controls (yellow) for different rich‐club levels. Normalized Ø > 1 (dashed line in a and c) indicates significant rich‐club organization. The grey shaded area indicates where rich‐club organization of the two groups is significantly different (p < .01, FDR‐corrected) (a, c). Rich‐club nodes are selected as the top 16% highest‐degree nodes of the network (b), and network edges are classified accordingly into rich‐club, feeder and local (d middle). Topological (i.e., connectivity density; D top) and weighted (i.e., connectivity strength; D bottom) properties are calculated for each connection class and compared between groups. ***p < .001. CG, cingulate gyrus; dCa, dorsal caudate; dlPu, dorsolateral putamen; FuG, fusiform gyrus; GP, globus pallidus; HC, healthy controls; IFG, inferior frontal gyrus; INS, insular gyrus; IPL, inferior parietal lobule; L, left; LOcC, lateral occipital cortex; lPFtha, lateral prefrontal thalamus; MFG, middle frontal gyrus; MVcC, medioventral occipital cortex; OCD, obsessive–compulsive disorder patients; Otha, occipital thalamus; PCun, precuneus; PoG, postcentral gyrus; PPtha, posterior parietal thalamus; R, right; STG, superior temporal gyrus; vCA, ventral caudate; vmPu, ventromedial putamen

References

    1. Alstott, J. , Panzarasa, P. , Rubinov, M. , Bullmore, E. T. , & Vértes, P. E. (2014). A unifying framework for measuring weighted rich clubs. Scientific Reports, 4(1), 1–6. - PMC - PubMed
    1. Andersson, J. L. , & Sotiropoulos, S. N. (2016). An integrated approach to correction for off‐resonance effects and subject movement in diffusion MR imaging. NeuroImage, 125, 1063–1078. - PMC - PubMed
    1. Association, A. P. , & Association, A. P. (2013). Diagnostic and statistical manual of mental disorders: DSM‐5. Arlington.
    1. Avants, B. B. , Epstein, C. L. , Grossman, M. , & Gee, J. C. (2008). Symmetric diffeomorphic image registration with cross‐correlation: Evaluating automated labeling of elderly and neurodegenerative brain. Medical Image Analysis, 12(1), 26–41. - PMC - PubMed
    1. Baggio, H. C. , Segura, B. , Junque, C. , de Reus, M. A. , Sala‐Llonch, R. , & van den Heuvel, M. P. (2015). Rich club organization and cognitive performance in healthy older participants. Journal of Cognitive Neuroscience, 27(9), 1801–1810. - PubMed

Publication types

MeSH terms