. 2022 Oct;42(7):872-884.
doi: 10.1177/0272989X221105079. Epub 2022 Jun 23.

Metamodeling for Policy Simulations with Multivariate Outcomes

Affiliations

Metamodeling for Policy Simulations with Multivariate Outcomes

Huaiyang Zhong et al. Med Decis Making. 2022 Oct.

Abstract

Purpose: Metamodels are simplified approximations of more complex models that can be used as surrogates for the original models. Challenges in using metamodels for policy analysis arise when there are multiple correlated outputs of interest. We develop a framework for metamodeling with policy simulations to accommodate multivariate outcomes.

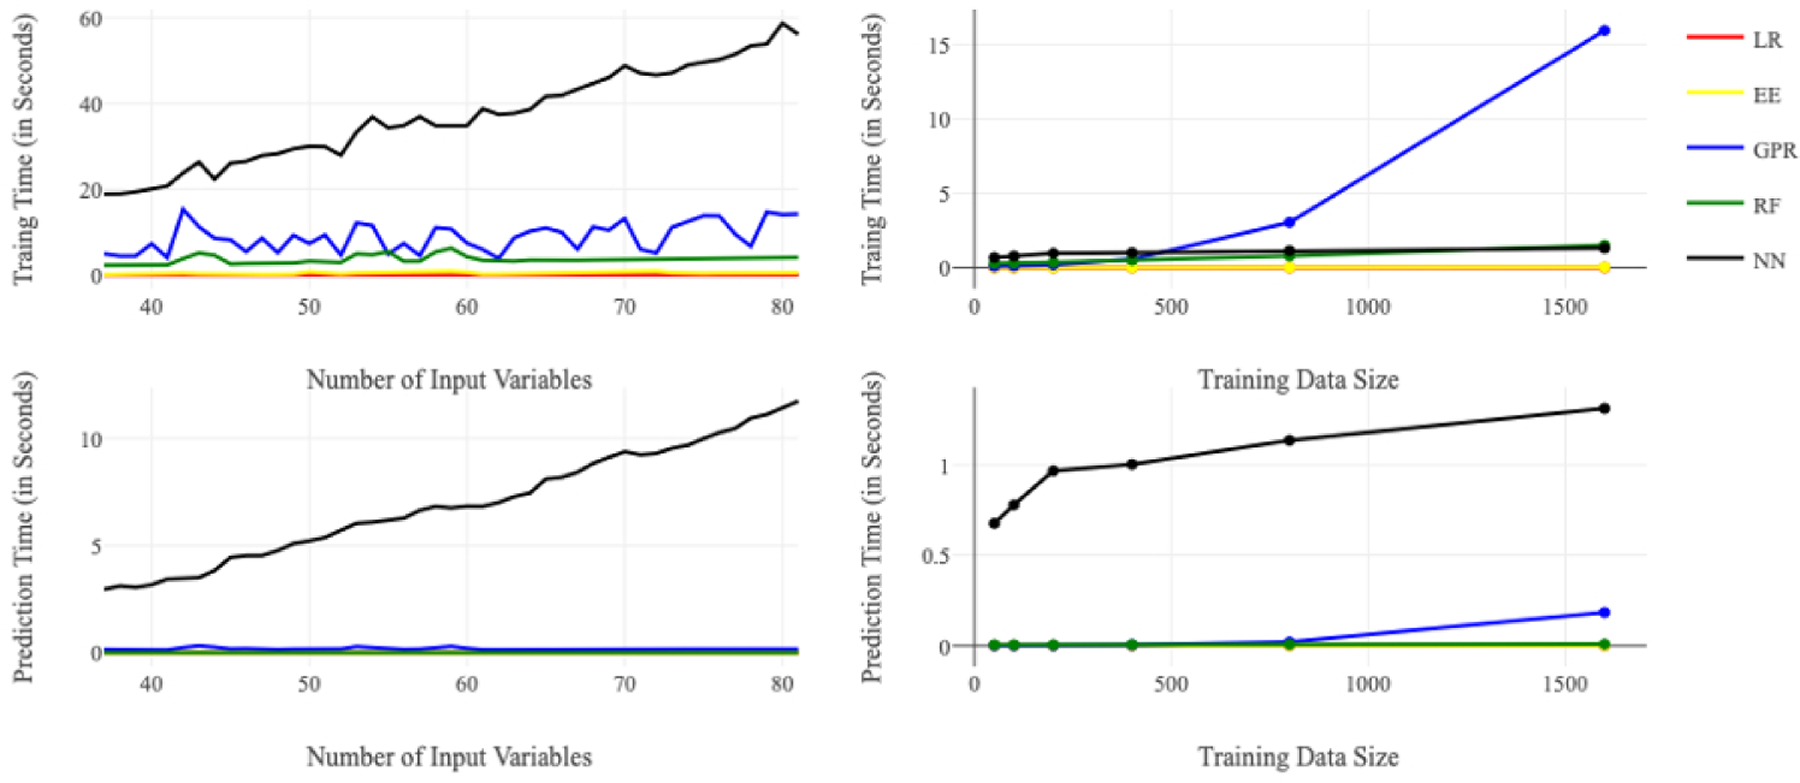
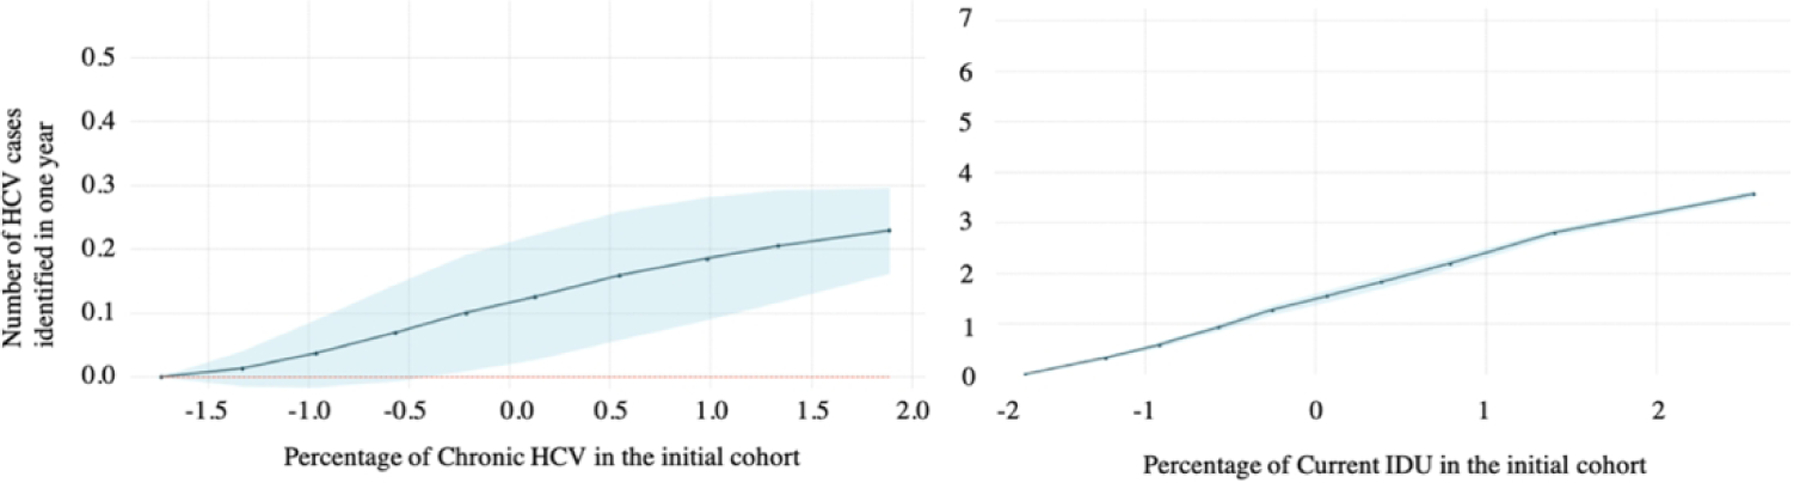
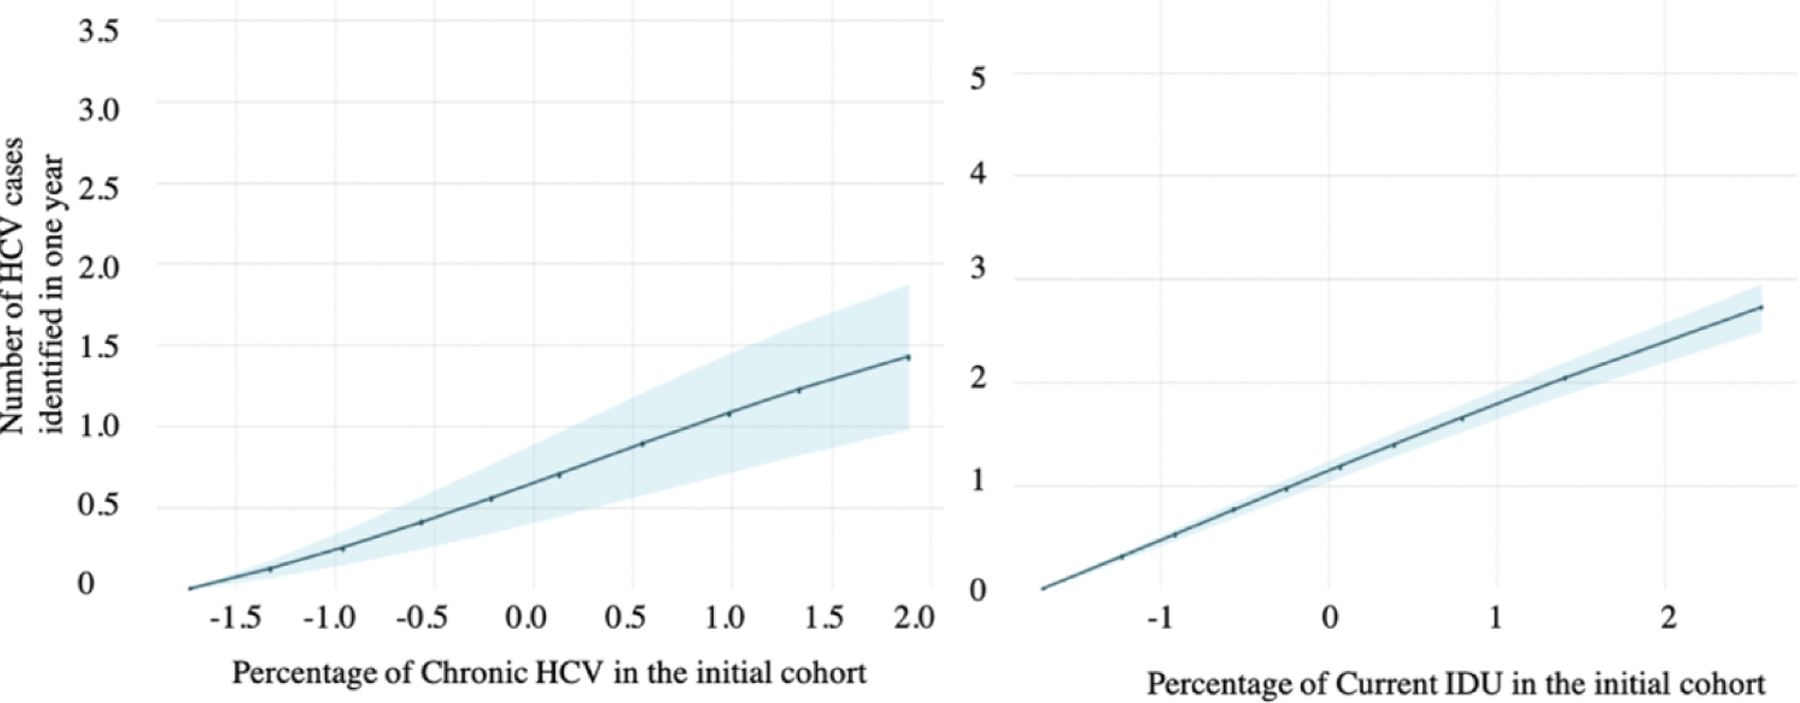
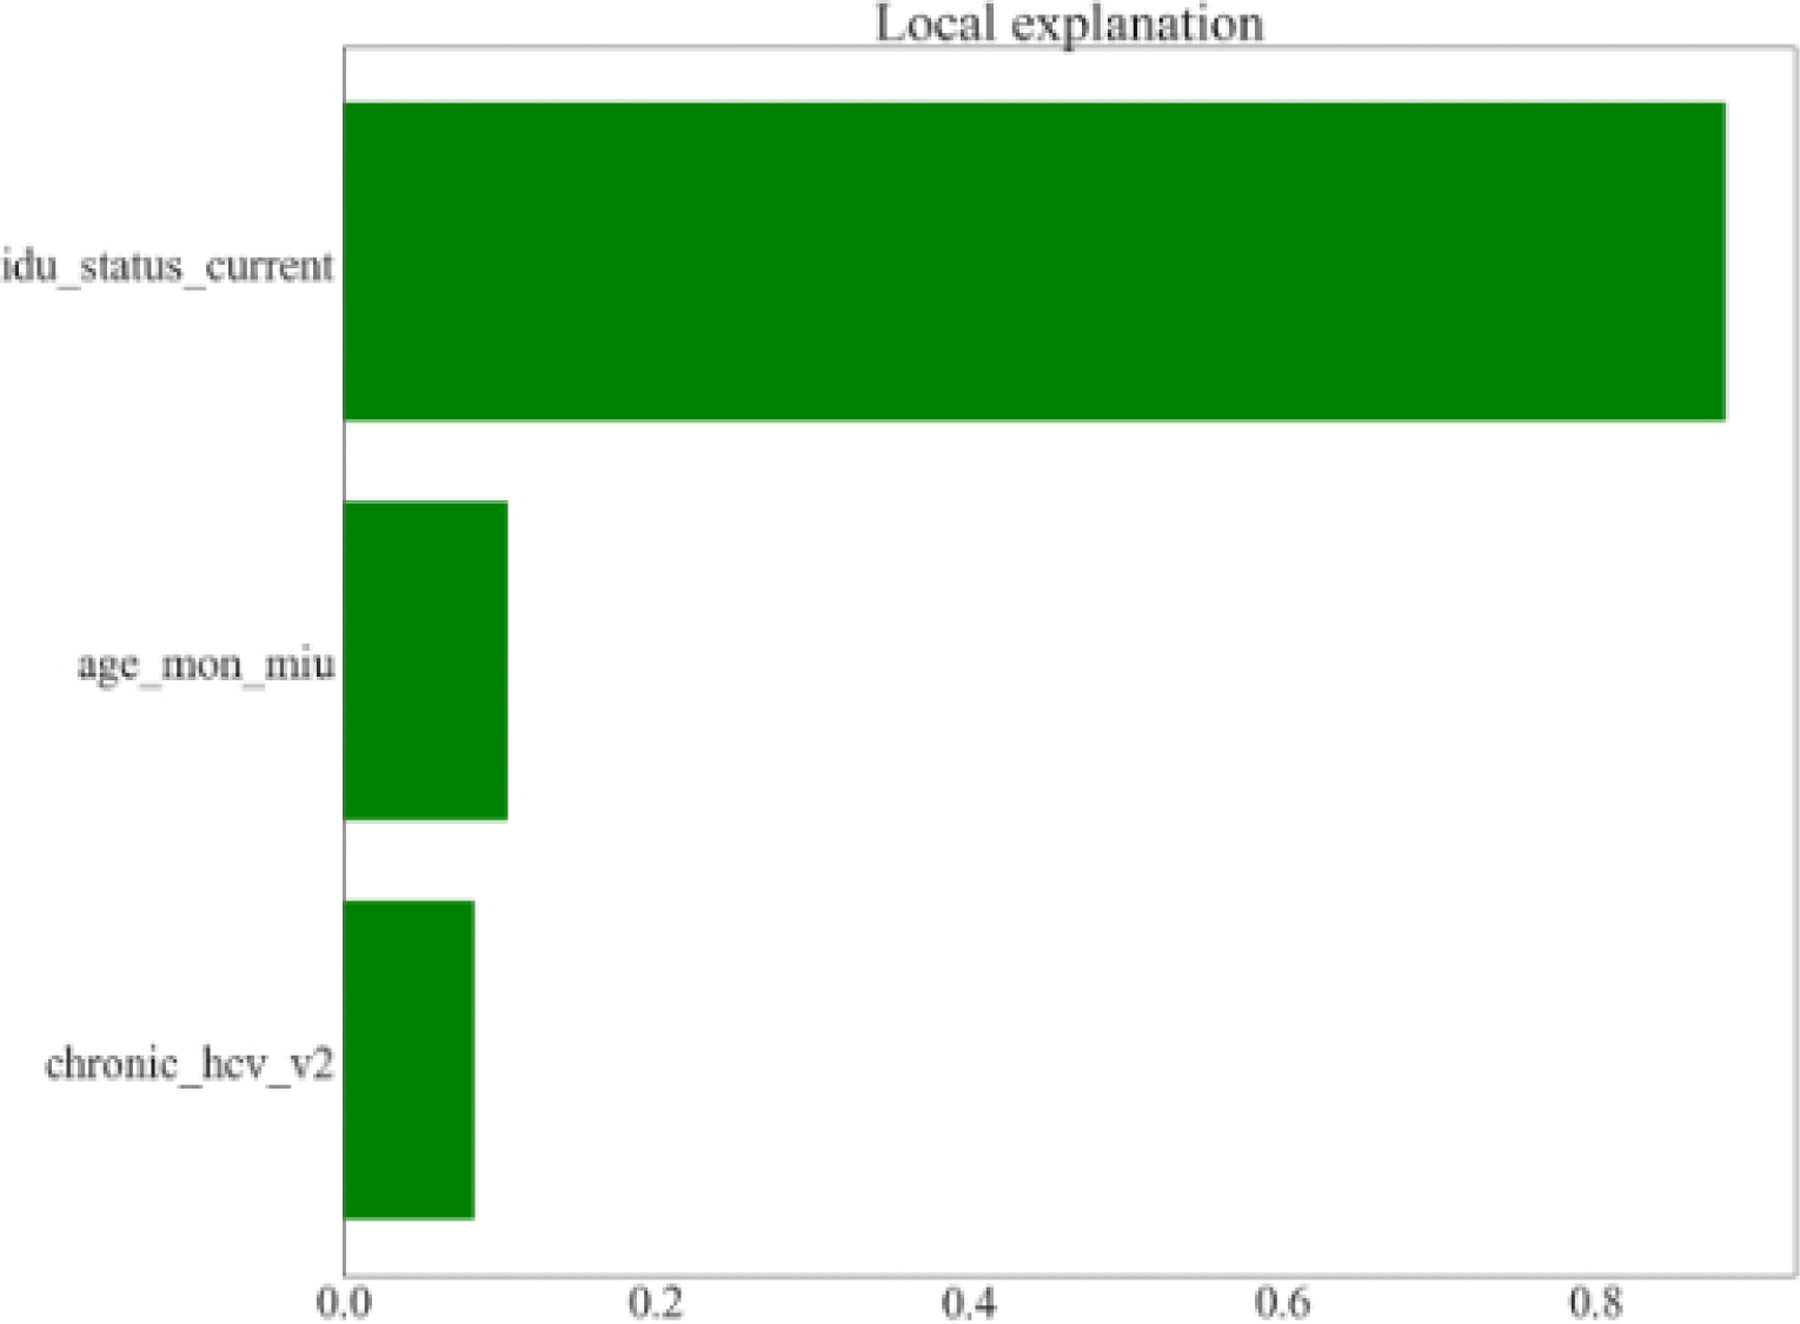
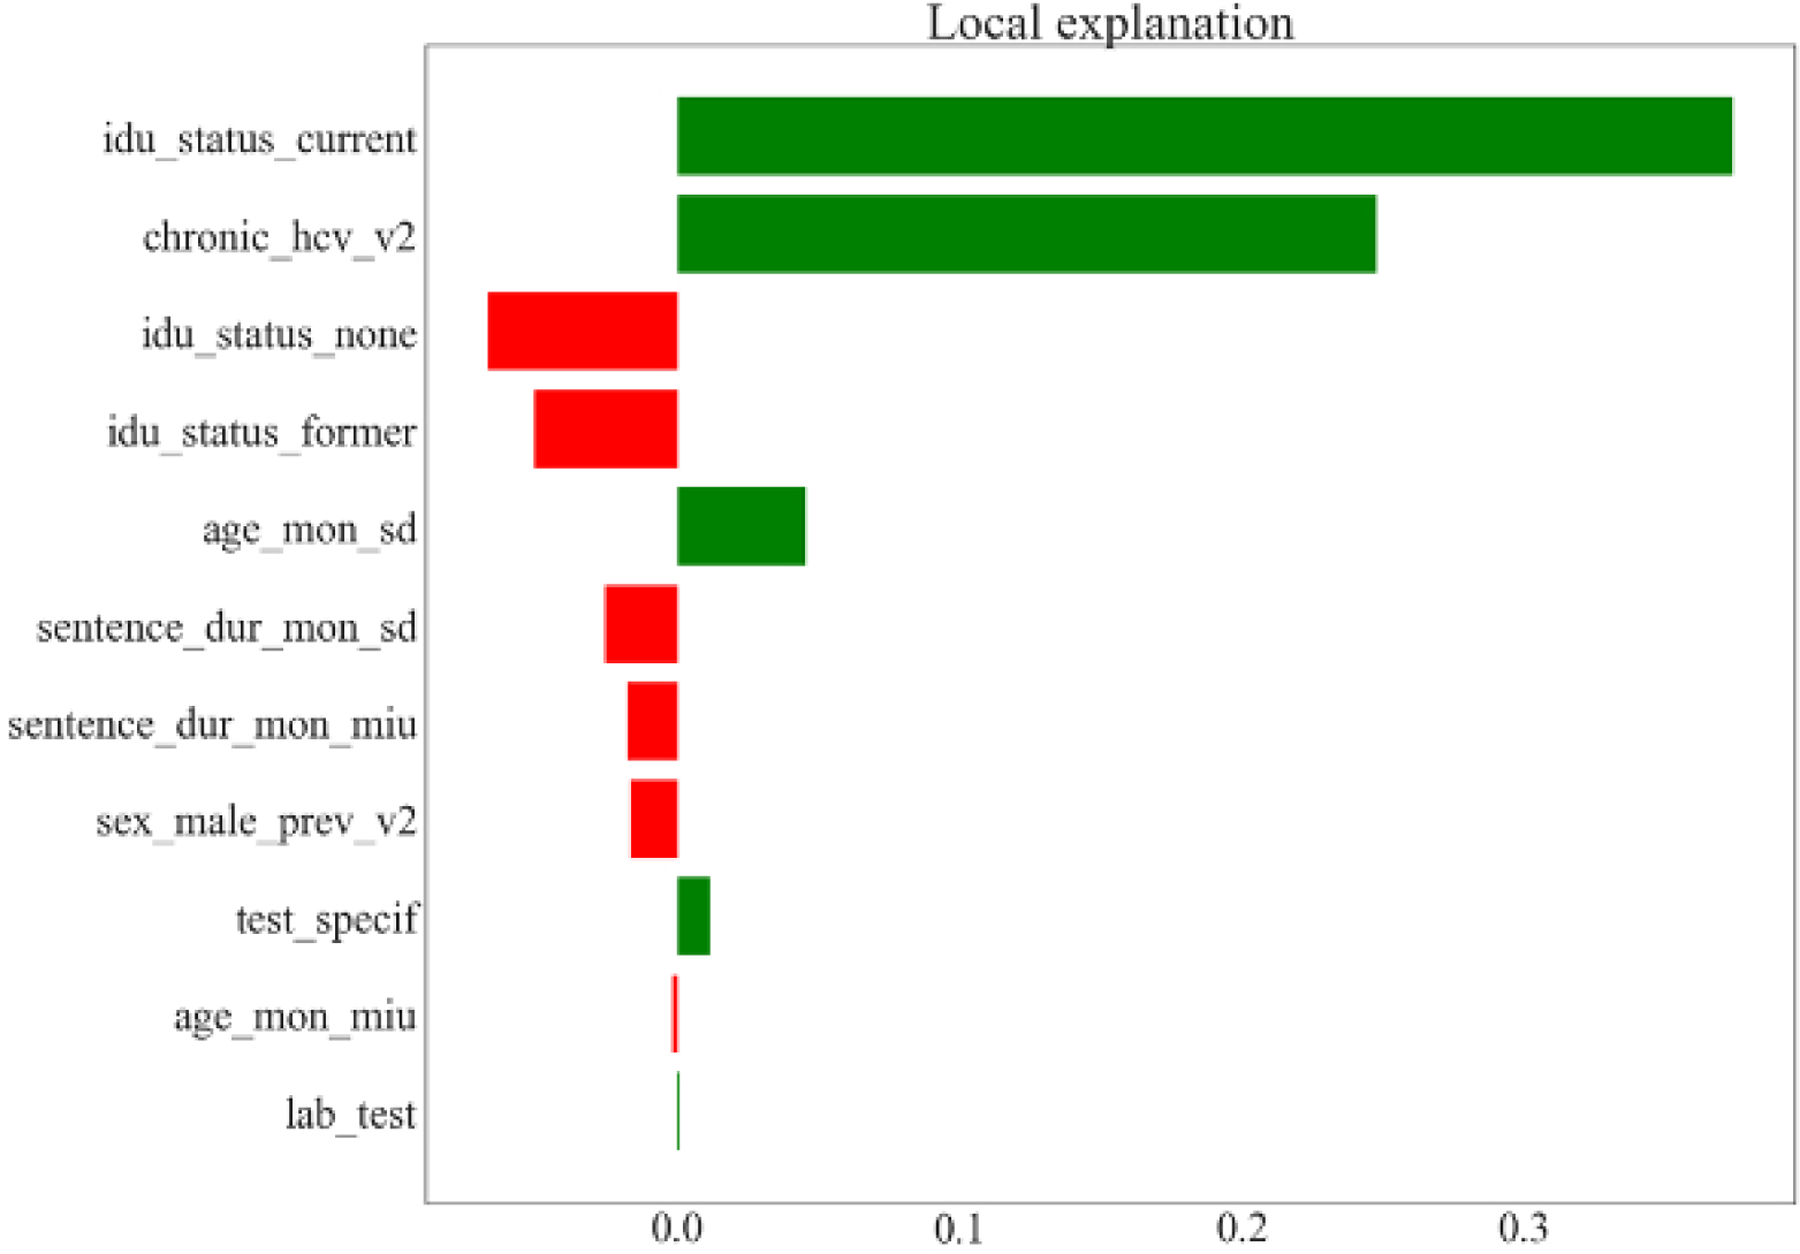
Methods: We combine 2 algorithm adaptation methods-multitarget stacking and regression chain with maximum correlation-with different base learners including linear regression (LR), elastic net (EE) with second-order terms, Gaussian process regression (GPR), random forests (RFs), and neural networks. We optimize integrated models using variable selection and hyperparameter tuning. We compare the accuracy, efficiency, and interpretability of different approaches. As an example application, we develop metamodels to emulate a microsimulation model of testing and treatment strategies for hepatitis C in correctional settings.

Results: Output variables from the simulation model were correlated (average ρ = 0.58). Without multioutput algorithm adaptation methods, in-sample fit (measured by R2) ranged from 0.881 for LR to 0.987 for GPR. The multioutput algorithm adaptation method increased R2 by an average 0.002 across base learners. Variable selection and hyperparameter tuning increased R2 by 0.009. Simpler models such as LR, EE, and RF required minimal training and prediction time. LR and EE had advantages in model interpretability, and we considered methods for improving the interpretability of other models.

Conclusions: In our example application, the choice of base learner had the largest impact on R2; multioutput algorithm adaptation and variable selection and hyperparameter tuning had a modest impact. Although advantages and disadvantages of specific learning algorithms may vary across different modeling applications, our framework for metamodeling in policy analyses with multivariate outcomes has broad applicability to decision analysis in health and medicine.

Keywords: machine learning; metamodeling; model interpretability; simulation modeling.


Figures

Figure 1/
Figure 1/
Average training and prediction times for the five base models Top Left (a): Average training time for each model versus number of input variables (D) when training data size (N_train) = 1600; Top Right (b): Average training time for each model versus training data size (N_train) when number of input variables (D) = 22; Bottom Left (c): Average prediction time for each model versus number of input variables (D) when testing data size (N_test) = 400; Bottom Right (d): Average prediction time for each model versus training data size when number of input variable (D) = 22 and testing data size (N_test) = 400 LR = linear regression, EE = elastic net, GPR = Gaussian process regression, RF = random forest, NN = neural network
Figure 2/
Figure 2/
Partial dependence plots from (A) random forest and (B) Gaussian process regression for predicting the number of hepatitis C virus (HCV) cases identified in one year by risk-based testing. Within each row of figures, the first figure shows the partial dependence on the prevalence of chronic HCV in the initial cohort, and the second shows partial dependence on the prevalence of current IDU in the initial cohort. The blue shaded region in each graph is the 95% confidence interval. A. Partial dependence plots from random forest (RF) B. Partial dependence plots from Gaussian process regression (GPR)
Figure 2/
Figure 2/
Partial dependence plots from (A) random forest and (B) Gaussian process regression for predicting the number of hepatitis C virus (HCV) cases identified in one year by risk-based testing. Within each row of figures, the first figure shows the partial dependence on the prevalence of chronic HCV in the initial cohort, and the second shows partial dependence on the prevalence of current IDU in the initial cohort. The blue shaded region in each graph is the 95% confidence interval. A. Partial dependence plots from random forest (RF) B. Partial dependence plots from Gaussian process regression (GPR)
Figure 3/
Figure 3/
Prediction of the number of hepatitis C virus (HCV) cases identified in one year by risk-based testing. LIME (local interpretable model agnostic) models from RF (random forest) and GPR (Gaussian process regression) for one test data point when limiting the local linear regression variables to variables found by variable selection. The bar width is the weight of each variable in the local regression. The local regression has a bias term. Variable definitions are as follows: age_mon_miu = mean age in months; age_mon_sd = standard deviation of age in months; chronic_hcv_v2 = % of people with chronic HCV infection; idu_status_current = % of people who are current drug injectors; idu_status_former = % of people who are former drug injectors; idu_status_none = % of people who are not drug injectors; lab_test = type of fibrosis staging test (APRI or fibroscan); sentence_dur_mon_miu = mean sentence duration in months; sentence_dur_mon_sd = standard deviation of sentence duration in months; sex_male_prev_v2 = % males in the cohort; test_specif = specificity of fibrosis staging test. A. LIME model from random forest (RF) B. LIME model from Gaussian process regression (GPR)
Figure 3/
Figure 3/
Prediction of the number of hepatitis C virus (HCV) cases identified in one year by risk-based testing. LIME (local interpretable model agnostic) models from RF (random forest) and GPR (Gaussian process regression) for one test data point when limiting the local linear regression variables to variables found by variable selection. The bar width is the weight of each variable in the local regression. The local regression has a bias term. Variable definitions are as follows: age_mon_miu = mean age in months; age_mon_sd = standard deviation of age in months; chronic_hcv_v2 = % of people with chronic HCV infection; idu_status_current = % of people who are current drug injectors; idu_status_former = % of people who are former drug injectors; idu_status_none = % of people who are not drug injectors; lab_test = type of fibrosis staging test (APRI or fibroscan); sentence_dur_mon_miu = mean sentence duration in months; sentence_dur_mon_sd = standard deviation of sentence duration in months; sex_male_prev_v2 = % males in the cohort; test_specif = specificity of fibrosis staging test. A. LIME model from random forest (RF) B. LIME model from Gaussian process regression (GPR)

Similar articles

Cited by

References

    1. Soeteman DI, Resch SC, Jalal H, Dugdale CM, Penazzato M, Weinstein MC, et al. Developing and validating metamodels of a microsimulation model of infant HIV testing and screening strategies used in a decision support tool for health policy makers. MDM Policy Pract 2020. Jan;5(1):2381468320932894. - PMC - PubMed
    1. Fröhlich H, Balling R, Beerenwinkel N, Kohlbacher O, Kumar S, Lengauer T, et al. From hype to reality: data science enabling personalized medicine. BMC Med 2018. Aug;16(1):150. - PMC - PubMed
    1. He J, Baxter SL, Xu J, Xu J, Zhou X, Zhang K. The practical implementation of artificial intelligence technologies in medicine. Nature Medicine 2019. Jan;25(1):30–6. - PMC - PubMed
    1. Watson DS, Krutzinna J, Bruce IN, Griffiths CE, McInnes IB, Barnes MR, et al. Clinical applications of machine learning algorithms: beyond the black box. BMJ 2019. Mar 12;364:l886. - PubMed
    1. Neumann PJ, Kim DD, Trikalinos TA, Sculpher MJ, Salomon JA, Prosser LA, et al. Future directions for cost-effectiveness analyses in health and medicine. Med Decis Making 2018. Oct;38(7):767–77. - PubMed

Publication types